Standards of living are marked by a number of indicators most upfront of which are economic measures such as per capita GDP or per capita wealth. However, other indicators of the standard and quality of life include basic health indicator and life expectancy at birth has long been a marker of the average “quantity of life” a country provides. Yet after the increases of the twentieth century and 21st centuries which saw average life expectancy in the world rise from 32 years in 1900 to 71 in 2021, much of the world has seen a decline in recent years in the wake of the COVID-19 pandemic. Statistics Canada has already noted that for three years in a row, life expectancy at birth for Canadians has declined from 2019 to 2022 with this decline being driven by an increase in unexpected deaths (such as substance related deaths, suicides and homicides) as well as the impact of COVID.
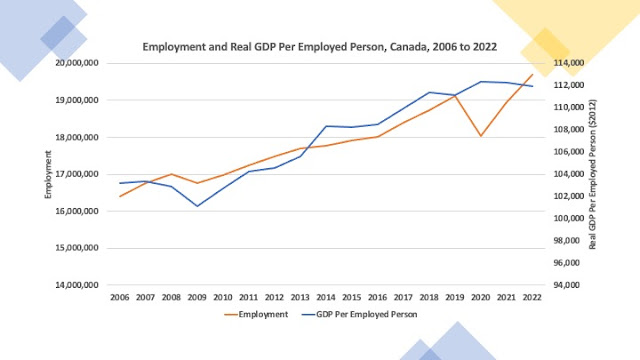
However, what is more interesting in the Canadian case is just as real per capita GDP growth slowed after 2010, so did the growth in life expectancy at birth which highlights the connection between economic growth and performance and ultimately health indicators such as life expectancy. The accompanying figure plots life expectancy at birth for Canada and Ontario at assorted overlapping three-year intervals since 2005 and they show that life expectancy at birth grew from 2005/07 to 2011/13 from 80.51 years to 81.73 years for Canada and 80.86 years to 82.19 years for Ontario. Growth then slowed and life expectancy at birth peaked at 81.94 years from 2015 to 2018 for Canada and 82.41 years for Ontario. Since then, both have declined hitting 81.55 years for Canada and 81.97 for Ontario by 2020-22.

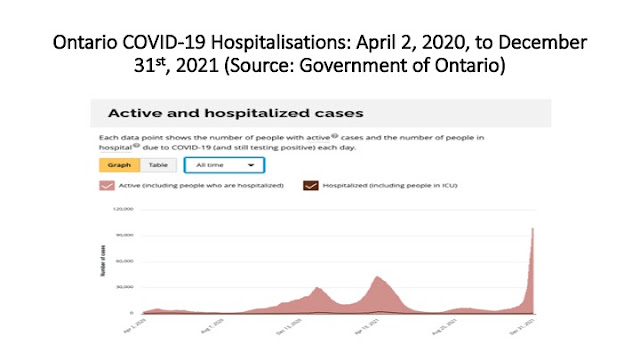
While much of the decline definitely coincides with the pandemic, life expectancy was essentially flat from approximately 2011/13 to 2017/19 when the decline begins but then accelerates during the 2019/2021 window as the pandemic strikes. So, the takeaways I get from this is that the pandemic indeed is associated with a decline in life expectancy at birth, but growth had already plateaued and begun to slip well before this in the wake of the 2008/09 recession and the slower economic growth and performance since. The pandemic appears to have strained or augmented whatever forces were already in play prior to 2020.
Of course, one might ask if this has also occurred in other countries. For example, a quick glance shows life expectancy at birth in Japan rising from 2012 until 2020 before a decline set in going from 83.1 years to peak at 84.56 in 2020 before declining to 84 by 2022. From 2012 to the pandemic start in 2020, life expectancy at birth grew 1.8 percent in Japan but only 0.2 percent in Canada. Germany, on the other hand from 2012 to 2020 grew by 0.6 percent (from 80.54 to 81.04) years. The United States on the other hand saw life expectancy essentially flat since 2012 (growing just under 0.1 percent) to the pandemic with a decline during the pandemic. These trends are food for thought indeed.