Northern Economist 2.0

Wednesday, 27 August 2025

Tariff Exposure and Employment Change in Canadian CMAs: A Crisis Averted?


Well, we are now nearly six months into regime change in American foreign and trade policy and the subsequent the trade war and it is well worth seeing what the impact of the trade chaos and disruption has been on employment growth in Canadian cities since January.  Early in 2025, there was a highly publicized report by the Canadian Chamber of Commerce that ranked Canadian CMAs by their exposure and vulnerability to tariffs based on the trade component of their economies.  According to the report, the most tariff exposed cities – and likely to face high economic costs as a result – were Saint John, NB followed by Calgary, Windsor, Kitchener-Cambridge-Waterloo and Brantford Ontario.  Also high on the list after these five were Guelph, Saguenay and Hamilton. At the bottom – the least exposed was Sudbury followed by Kamloops, Nanaimo, Winnipeg and Regina. 

So, how has employment growth in these cities fared since January of 2025?  Figure 1 plots ranked data for Canadian CMAs obtained from Statistics Canada and used to calculate the percent growth in employment from January 2025 to July 2025 (using three-month moving average seasonally adjusted data).  A couple of notes. First, Prince Edward Island is included in Figure 1 treating the small island province as a CMA. It is not in subsequent figures. Second, Belleville-Quinte is not included as the employment growth over these six months came out to 90 percent and the official note mentioned there was a small sample issue and to use caution in interpreting – so out it went. There were small sample issues noted for several other CMAs, but they were retained as the percentage changes did not seem as extreme as Belleville. 


Figure 1 shows that Canada despite the trade war saw some employment growth going from 20,912,00 jobs in January 2025 to 21,019,900 jobs by July 2025 – an increase of half a percent.  Percent growth in employment was greatest in Red Deer (10.4 percent), followed by Hamilton (8.1 percent), Nanaimo (6.3 percent), Saint John New Brunswick (6 percent), Kamloops (5.8 percent) and Sudbury (5.8 percent).  Of these 41 CMAs, well over half – 25 of them – saw their employment grow since January 2025.  The remainder all saw their employment shrink to varying degrees with the worst hit being Windsor (-5.2 percent), Trios-Rivieres (-4.6 percent), Saguenay (-3.9 percent), Kelowna (-3.2 percent) and Kingston (-3 percent). 


Based on what were projected to be the worst hit cities because of their tariff exposure, it appears that there are some surprising anomalies.  For comparison purposes, Figure 2 plots the CMAs ranked from highest (most exposed) to lowest (least exposed) based on the February 2025 Canadian Chamber of Commerce study and ranking. Saint John, NB was ranked most exposed and yet at 6 percent growth saw the fourth highest gain in employment across Canada’s CMAs.  Calgary was ranked second most exposed but at 1.2 percent employment growth (well above the national performance) ranked 15th highest in terms of CMA employment performance.  Most interesting of all is Hamilton, Ontario where there has been much gnashing of teeth and wailing about the demise of steel and its impact on the local economy.  Between January 2025 and July 2025, Hamilton went from 421,3000 jobs to 455,600 jobs – an increase of 34,300 jobs or 8.1 percent growth in employment.  Hamilton was ranked 8th highest in terms of tariff exposure leading to  the expectation it would be nearer the bottom of any CMA employment growth and yet here we are at essentially first place in the country among major cities (because Red Deer’s numbers are also problematic given the small size of the sample apparently).

Now, at the same time, there are some cities where their negative employment growth has matched expectations given their tariff exposure ranking.  Windsor was ranked third highest in terms of tariff exposure and indeed has fared the worst of all the CMAs.  Trois Rivieres and Saguenay also were highly exposed to tariffs and in both cases are also at the bottom in terms of employment growth.  Sudbury, on the other hand was ranked least tariff exposed of all the CMAs and to expectations, its employment growth has been quite good ranking 6th highest in the country.  

What this all suggests is that the impact of the trade war and tariffs has probably been more complex and variable on Canada’s assorted economies than one might have expected based either on resilience or local responses as well as other activities which may have taken up the slack.  Hamilton, for example, seems rather anomalous but the reality is that it has a large educational and medical sector and has become a major transport and logistics hub both due to cargo through its airport as well as the location of a large new Amazon distribution centre there. 


The relationship between tariff exposure and employment growth across these CMAs is further explored in the two remaining figures.  Figure 3 is a radar plot of ranked CMA employment against the tariff exposure index, and some very large divergences are obvious.  Saint John ranks quite high in terms of employment growth but there is an extremely large tariff exposure spike associated with it.  Calgary also is approximately in the top third of employment growth but also has a rather large tariff exposure spike.  Figure 4 does a scatterplot with trend charting the relationship between employment growth and the tariff exposure index.  Greater tariff exposure is indeed related to lower employment growth on average but there is a lot of variation around the trend.

All in all, some cities have done much better than one might have expected, some have done worse, and some have been bang-on.  The factors accounting for this variable performance are probably as numerous and unique as the performance differences and greatly influenced by local economic conditions and responses.

Thursday, 7 August 2025

Municipal Employment in Ontario's North


Municipal public finances are always of interest to the average city resident given that municipalities are the level of government closest to the public providing important and much needed services.  At the same time, municipal ratepayers are sensitive to the taxation of their property and are always interested in indicators that shed light on efficient provision of municipal services.  In northern Ontario, the concerns are amplified by generally weaker property tax bases and a greater reliance on both residential taxation as well as borrowing in order to get things done.

One important indicator is municipal employment given that wages and salaries often account for two thirds or more of city budgets.  In the case of Ontario, data is readily available from the Financial Information Returns of the Ministry of Municipal Affairs.  Figure 1 plots total municipal employment (FT, PT and Seasonal) for northern Ontario’s five major urban centers as reported in the FIR reports from 2001 to 2023 (only 2022 for Thunder Bay as at the time of putting this blog post together, it appears the report has not been filed yet).  


All municipalities except for North Bay have seen employment trend upwards but with some substantial differences.  Thunder Bay saw the largest increase at 44.7 percent followed by Greater Sudbury at 18.2 percent, Timmins at 15.8 percent, the Sault at 14.1 percent and finally North Bay at only 0.4 percent.  As well, of these five cities, Thunder Bay has the largest municipal workforce clocking in at 3,404 in 2022 compared to (2023 numbers) 2,647 for Greater Sudbury, 1501 for The Sault, 827 for North Bay and 957 for Timmins.


Of course, the total numbers can be misleading given that these cities vary in population size, so Figure 2 calculates the total number of municipal employees per 10,000 population and again plots them for the 2001 to 2023 period.  Here the numbers partially parallel Figure 1 given that Thunder Bay even after adjusting for population has usually had the most municipal employees per 10,000 population.  At the end of the time-period, Thunder Bay had 313 municipal employees for every 10,000-population compared to 158 for Greater Sudbury, 191 for the Sault, 157 for North Bay and 233 for Timmins.  Finally, Figure 3 plots the percent growth in municipal employees per 10,000 population since 2001.  Here, Thunder Bay again tops the list at 49.4 percent growth followed by Timmins at 24.7 percent, Sudbury at 24.0 percent, the Sault at 13.4 percent and North Bay at 2.6 percent.  


So, the numbers pretty much speak for themselves.  Of course, one might argue that some cities have much larger numbers of municipal employees than others because they provide more services or have chosen to structure the delivery of services in a manner that best meets the needs of their ratepayers and that requires more staff.  On the other hand, municipal politicians at budget time often lament that their hands are tied by provincial legislation that pretty much mandates everything that they do and as a result all they can do is pass the costs down to ratepayers.  The question that arises in that case is why such widely varying numbers of employees if everyone is providing similar services because of provincial mandates?  Of course, the answer is probably more complicated than this simple analysis allows for but one wonders what it is.

Monday, 28 October 2024

Technological Change and Employment in Economic History


Technological change has been the chief contributor to economic growth since the industrial revolution. Yet, technological change always seems accompanied by anxieties related to long-term unemployment despite increases in both total employment and per capita income over the last 150 years.  This anxiety continues  with the current onset and diffusion of assorted new technologies including AI, machine learning and quantum computing.  Yet the evidence suggests that despite over 150 years of rapid technological change, more jobs have been created than destroyed so that on net employment has continued to rise and matched or exceeded population growth.


My coauthor Olivia Di Matteo (UBC) and I have a paper on the program of the Social Science History Association Meetings in Toronto this week that looks at whether the past can inform the future when it comes to the impact of technology – quantum computing in particular – on the economy.  Our paper overviews the recent history of technological anxiety with comparison to actual outcomes, surveys the state of quantum computing and the challenges it faces, and then tries to extrapolate from current available metrics and past performance what the potential effects on employment and income might be.  The historical evidence suggests a positive and significant relationship between income, employment and assorted measures of technological change including computing measures.  Going forward there is no reason why future growth cannot benefit from new quantum technology, but much depends on having a measure of quantum computing to gauge its impact on income and employment.  Measuring the impact of quantum computing is more difficult given that new metrics apart from those obtained during the age of classical computing may apply.


The focus in the remainder of this blog post (excerpted directly from material in that paper)  is the historical evidence on employment performance in three countries at the forefront of technological change over the last 150 years: The United Kingdom (Figure 1), Canada (Figure 2), and the United States (Figure 3)[See note at end of post for data sources]. The United Kingdom’s experience as the first industrial nation revealed increases in both employment and the labour force as technological change both created and destroyed jobs but with substantial net job creation.  Indeed, using census records on employment in England and Wales since 1871 and Labour Force Survey Data from 1992, Stewart, De, and Cole (2015) show declines in occupations such as agricultural labourers, washers, launderers, telephonists, and telegraph operators both in absolute numbers and as a share of employment.  Meanwhile, these declines were accompanied by increases in other occupations such as accountants, bar staff, hairdressers, and other services. Overall, employment in the United Kingdom has trended steadily upwards since the mid 19th century irrespective of massive technological change as Figure 1 illustrates.


The picture is similar for Canada, as illustrated in Figure 2.   Between 1851 and 2021, in tandem with a population that grew from 2.4 to 38.3 million – a 16-fold increase – estimates of the Canadian labour force show growth from 762,000 to 20 million – a 26-fold increase in size.  Employment data is available from 1891, and over the period 1891 to 2021, employment in Canada grew from 1.6 to 18.0 million – a 11-fold increase – while the labour force over the same span also increased from 1.7 to 20 million – an approximately 12-fold increase.  The slowdown after 2017 in terms of labour force and employment can be attributed to the impact of the pandemic, and as the chart illustrates, there was recovery by 2022.  Evidence for the United States parallels that of the United Kingdom and Canada with respect to employment as illustrated in Figure 3. Again, from 1900 to 2022 – ostensibly a period of great technological change – total employment in the United States expanded six-fold while the population grew four-fold.  


So, why all the anxiety about technological change?  Well, despite the historical evidence to date, there is a background foreboding that much like mutual fund returns, the past may not be an indicator of the future if the onset of quantum information technologies, AI and machine learning together somehow represent a fundamentally different economic process that unlike the past will destroy more jobs than it creates. However, at this point these new technologies are still in their infancy and there is really no reason at this stage to expect the future to be that much different than the past, unless the relationship between technological change and its contribution to the economy itself shifts in some unforeseen fashion.


Sources/References


Data Sources for Figures 1-3: UK [  Data Source: A millennium of macroeconomic data for the UK, The Bank of England's collection of historical macroeconomic and financial statistics, Volume 3.1.], Canada: [Denton and Ostry (1961); Historical Statistics of Canada; Statistics Canada Catalogue 71-201 Annual, 1973 & 1989, Historical labour force statistics, actual data, seasonal factors, seasonally adjusted data; Statistics Canada, v102029212 Canada [11124], Labour force (Persons), Total, all occupations; Both sexes v102029368 Canada [11124], Employment (Persons), Total, all occupations, Both sexes]; USA:[ Historical Statistics of the United States (HSUS) from 1900 to 1945 and that of the Bureau of Labour Statistics (BLS) from 1948 to 2023.]


Stewart. I., D. De, and A. Cole (2015) Technology and People: The great job-creating machine. Deloitte.

Wednesday, 26 June 2024

Ontario's Dynamic Economy in Doubt

 This post originally appeared in the Fraser Institute Blog.


Ontario’s future as dynamic economy in doubt—if employment trends continue

— June 22, 2024


As Canada’s largest province both economically and in terms of population, Ontario is a key driver of Canadian prosperity. Its economic strength manifests itself via job creation and Ontario has nearly 40 per cent of the country’s employment. Since 2010, Ontario’s total employment has grown by more than 21 per cent while the rest of Canada (ROC) has expanded by about 18 per cent. While Ontario’s employment growth mirrors that of the rest of the country, it does exhibit some interesting differences in terms of public, private and self-employment shares of total employment and their performance over time.


The first chart below plots public-sector employment as a share of total employment for Ontario and the rest of Canada for the period 2010 to 2023. Overall, Ontario is somewhat less reliant on public sector employment but there is a difference in trends over time. From 2010 to 2019, Ontario was marked by a slight decline in the public-sector share of employment as it went from 19 to 18 per cent. At the same time, the rest of the country stayed at about 20 per cent. Since 2019, both Ontario and the ROC have seen a jump in public-sector employment to nearly 20 per cent for Ontario and 22 per cent for the ROC with a levelling off after 2022.


The second chart shows Ontario consistently above the ROC when it comes to private sector employment shares reflecting Ontario’s continuing role as a centre for Canadian manufacturing and finance especially in the Greater Toronto Hamilton Area (GTHA). Moreover, since 2010 that share has grown from under 66 per cent to 67 per cent with that growth continuing after the post pandemic employment rebound. The rest of the country has been somewhat more moribund in this regard as its private sector employment share is no higher than in 2014.


The third chart is more concerning given the trends revealed for Ontario and the rest of Canada. First, Ontario’s self-employment share was relatively stable between 2010 and 2020 at an average just above 15 per cent. Over the same period, the ROC saw a decline that by 2020 brought the share to below 15 per cent. Indeed, over the 2010 to 2020 period, the ROC went from slightly above Ontario to below when it came to the self-employment share. When the pandemic hit, the self-employment share in both Ontario and the ROC took a steep dive from which neither has yet to recover. This represents a remarkable free-fall that does not bode well for the future.


What are the implications of these trends?


While the long-term increase in total private sector employment is reassuring, the rise in public sector employment and drop in self-employment is not. To start, a drop in self-employment means a drop in the number of small businesses and ultimately a decline in entrepreneurship. The shock and restrictions of the pandemic were invariably a factor as many smaller and family or individually run businesses decided to pack up shop for good. While some of these individuals may have gravitated towards public-sector employment it is more likely given the aging labour force that they simply have decided to retire from the labour force permanently.


This is a national trend but in a province that is the economic engine of the country , it foreshadows a decline in innovation and future economic growth. Small businesses are the backbone for developing entrepreneurship and innovation and they also provide opportunities for financial independence aside from traditional employers in both the private and public sector. Moreover, while the self-employed themselves may only account for 14 per cent of employment, they in turn are responsible for a large chunk of the remaining private-sector employment.


In terms of other takeaways, another interesting item to note is that for Ontario, the period of declining public-sector employment shares occurred under the McGuinty-Wynne governments while the increase since 2019 has been under the Ford government. While the pandemic is inevitably a factor in the post-2019 public-employment surge, as it recedes into the past there seems to be no movement towards the public-sector share shrinking. Indeed, if one looks at the public-sector salary disclosure lists, during the McGuinty-Wynne era spanning 2003 to 2018 the list added 130,981 salaries over $100,000 to the broader public sector. Since 2018—a much shorter time period—nearly 150,000 salaries have been added to the list.


More public-sector employment is not better for long-term economic growth. Ontario’s future as an innovative and dynamic economy may be in peril if these trends continue.

Author:

Livio Di Matteo

Wednesday, 21 June 2023

Recent Employment Growth in Ontario: A Snapshot

 When it comes to employment growth, the Canadian and Ontario economies are still growing relatively robustly despite nearly a year of Bank rate increases that aim to cool off the economy and inflation.  The accompanying figure presents the percent change in total employment (monthly data, three-month moving average, not seasonally adjusted) across Ontario and its main economic regions over two recent time periods: May 2022 to May 2023 (over one year) and January 2023 to May 2023 (the last five months).  The results suggest overall robust growth but with some major differences across the province.


Year over year (May 2022 to May 2023), employment in Ontario as a whole has grown nearly 2 percent with the period from January 2023 to May 2023 growing at just below 1.5 percent.  Year over year growth was highest in Windsor-Sarnia (9 percent) followed by the Kitchener-Waterloo-Barrie area (7 percent), Muskoka-Kawartha (5 percent) and then the Northwest (4 percent).  Toronto and Ottawa also saw growth year over year at about 2 percent respectively.  The latter two account for most of the job creation in Ontario despite the lower growth rate because well over half of Ontario employment is in these two cities.  

What does stand out in these employment growth numbers is that some parts of Ontario are not doing as well as others.  Kingston-Pembroke, Hamilton-Niagara, London and Northeastern Ontario have seen employment decline both year-over-year and since January of this year.  While Windsor is up significantly year-over-year, it turns out that 2023 has seen much slower growth.  Stratford-Bruce is down year-over-year but there has been growth in 2023.  Then there is Northwestern Ontario which appears to be in the midst of a relatively strong employment surge.  

So, overall Ontario is still booming.  Over the period 2006 to 2023, average annual monthly employment growth has been approximately 1.2 percent so growth rates in the 1.5 to 2 percent range mean Ontario as a whole is still doing exceptionally well.  True, these growth rates are down from the immediate rebound of the post pandemic era but overall since May of 2022 Ontario has added 144,000 jobs which averages to about 12,000 jobs a month - well above historical performance.  On average, since 2006 Ontario has added about 7500 jobs a month.  As for the regions exhibiting slowdowns in employment creation, they are in many respects areas where longer-term economic and employment growth has consistently been a challenge with the exception of the Northwest which seems to be seeing a robust uptick rooted in forestry, mining and tourism as well as public sector construction.

So, with the first half of 2023 nearly done, it appears Ontario overall is in good shape.

Wednesday, 22 March 2023

Thunder Bay and Sudbury: A Tale of Two Economies


The Conference Board of Canada has issued its March 2023 Metropolitan outlooks for Thunder Bay and Greater Sudbury and the immediate news looks good for Thunder Bay.  As a result of the construction of a new provincial jail in Thunder Bay over the new two years, Thunder Bay is expected to see its real GDP grow 3.6 percent in 2023 making it number 1 out of 24 comparable CMAs for economic growth.  On the other hand, Sudbury at only 1.4 percent projected growth for 2023 is still doing well and expected to rank 12th out of the same 24 CMAs.  Sudbury is doing well as a result of expected persistence of demand for nickel given the growth of the electric car industry. In terms of how Thunder Bay and Sudbury will fare in the longer term based on these economic drivers, the Conference Board projects that Sudbury will see some continued growth particularly in employment but Thunder Bay after the construction boom is expected to falter somewhat given the absence of a more robust long-term driver. 


Figures 1 and 2 plot both real GDP growth and employment growth for Thunder Bay, Sudbury and Ontario as presented by the Conference Board reports.  While 2023 sees Thunder Bay surpass both Ontario and Sudbury for growth, for the 2024 to 2027 period, Sudbury sees real GDP growth stay at about 1.5 percent while Thunder Bay falls to just over one-half of one percent.  Despite the anticipated slowdown in 2023, Ontario real GDP growth recovers to an average of over 2 percent for 2024-27. In terms of employment growth, Thunder Bay sees a surge to a 4 percent growth in jobs created for 2024 but eventually sees employment shrink moving into 2025 to 2027.  While Sudbury also is expected to see lower employment growth moving forward, it remains positive to 2027.


And finally, Figure 3 provides a retrospective on local investment spending for the two cities in terms of the value of building permits from 2014 to 2021.  Fluctuations notwithstanding, the long-term trend up to 2021 has been slightly positive for Sudbury, and slightly negative for Thunder Bay. Going forward, housing starts are an important component of building permits, and the provincial and federal budgets are expected to see some initiatives for boosting housing spending.  The Conference Board is forecasting that total housing starts in Thunder Bay will fall from 193 units in 2021 to 161 in 2023 but then start to increase reaching 237 by 2027.  Sudbury is expected to follow a similar pattern declining from 434 starts in 2021 to 269 by 2023 but then recovering to 301 by 2027.


Both communities have aging populations which in the absence of economic opportunities attracting large scale immigration means that investment, employment, and real GDP growth in the long term will lag the rest of the province. One potential game changer is of course in the area of mining for both communities given the global demand for critical minerals and the expected development of the Ring of Fire.  Tomorrow’s provincial budget may provide a glimpse of what might happen there in terms of infrastructure spending.

Sunday, 8 January 2023

Measuring Municipal Employment in Northern Ontario


It is municipal budget season in Ontario and many municipal ratepayers across the province are waking up to projections of fairly large tax increases as a result of inflationary pressure. It is interesting that when municipal finance officers talk about inflation they invariably mention the effects of the war in Ukraine.  I must admit, I would be interested in an explanation by a municipal CAO as to how the war in Ukraine has directly impacted a municipal budget in Thunder Bay or Sudbury.  Nevertheless, we should move on to the main event here.


When it comes to Ontario’s municipal sector, getting a handle on the numbers can be a challenging and complicated endeavor. Indeed, it has already been noted by at least one think tank that municipal budgets in Canada are not user friendly and are quite difficult for the average citizen to understand.  In the case of Ontario municipal budgetary information, there are standardized reporting templates or Financial Information Returns that are available through the Ministry of Municipal Affairs and there is annual data for each municipality but the assorted excel spreadsheets with multiple sheets and windows are not terribly user friendly. 


And then there is the case of trying to get a handle on employment numbers – again not a very transparent process.  There is your core municipal employment in terms of administration and staff which can then be augmented by protection services such as fire, employment and paramedics and then there are some municipalities with other services such as long-term care.  Thunder Bay is a classic example of the difficulties in getting estimates as they are presented as Full Time Equivalents or FTEs with police reported separately and the time series not terribly extensive even when you can track them down.  And of course, given the idiosyncrasies of each municipality, forget about inter municipal comparisons. 


In the end, trying to get data on municipal employment in any Ontario municipality is exceedingly difficult and so one is often forced to improvise.  One avenue worth pursuing  is not going directly to municipalities but the provincial government which as a result of its public sector disclosure act collects data on Ontario public sector employees making more than $100,000.  This allows one to at least get a consistent comparative handle on municipal employees across Ontario municipalities albeit only those earning over $100,000.


Figure 1 presents the number of municipal employees earning $100,000 or more for the five major northern Ontario cities – Thunder Bay, Timmins, Greater Sudbury, Sault Ste. Marie and North Bay – for the period 2017 to 2021.  The number of employees making over $100,000 – let’s call them Listers – grew in all five of these cities over time with a particularly noticeable bump in 2020.  For example, in Thunder Bay, there were 417 municipal Listers in 2017 and this rose to 452 by 2019 and then jumped to 558 in 2020 before declining slightly to 547 in 2021.  A similar pattern was observed for Greater Sudbury and to a lesser extent in the other three  cities.


Interestingly enough, in 2021, Thunder Bay had the most municipal Listers at 547 followed by Sudbury at 540, then the Sault at 246, North Bay at 187 and finally Timmins at 142.  This ranking roughly parallels population size with the exception that based on population, one would expect Sudbury to exceed Thunder Bay.  Sudbury’s population is about 60 percent more than Thunder Bay but in 2021 Thunder Bay had practically the same number of employees making over $100,000. Indeed, one can make an additional number of comparisons from the data – the total wage and salary bill in 2021 for Listers, in each municipality, the average salary per Lister and the per capita cost of Listers in each municipality (constructed by dividing the total wage and salary bill for those making more than $100,00 by the municipality’s population). These are presented in Figures 2 to 4.


Figure 2 ranks the total wage and salary bill for municipal listers and shows the total in 2021 was largest for Thunder Bay at $69.6 million (down slightly from $70.9 million in 2020 but up substantially from 2019 at $54.7 million) and the smallest for Timmins at $17.4 million.  Given the difference sin municipal population size, the totals needs to be supplement with adjustments for employment size or population.   


Figure 3 ranks the municipalities by the average salary per municipal lister and they range from $135,557 for North Bay (Thunder Bay is second at $127,171) to a low of $122,188 for Timmins.  Figure 4 is the most interesting however as it takes the total wage and salary bill for Listers in each municipality and divides by the population of the municipality to present a per capita cost.  The per capita cost of Listers was highest in Thunder Bay at $628 per capita and lowest in Greater Sudbury at $403 per capita. 


The Thunder Bay numbers are worth drilling down into further given that adjusted for population, they definitely standout from the other municipalities.  That will be a future post.


Wednesday, 24 August 2022

Employment Density in Canadian CMAs

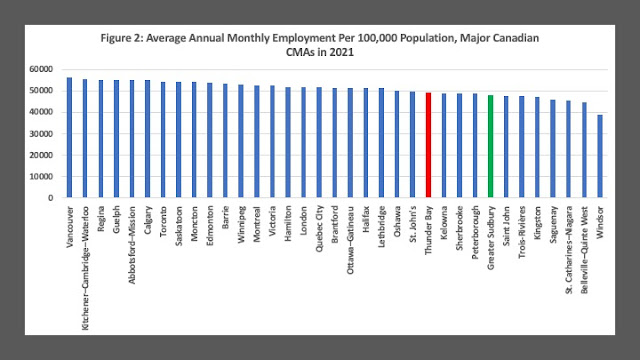
 Labor markets are at the forefront in terms of current policy issues given the shortages that are plaguing so many sectors in Canada's economy.  During the pandemic year, employment in Canada took a major hit but had largely recovered by the end of 2021.  When we look at employment and jobs in Canada using data from Statistics Canada, our usual approach to where the jobs are is something akin to what we see in Figure 1 below.  Canada has 35 major Census Metropolitan Areas (CMAs) each of which is a regional labor market on its own with employment opportunities that need to be filled and employment that is created. Canada's largest nodes of employment are Toronto, Montreal and Vancouver with average monthly employment in 2021 at 3.4, 2.4 and 1.5 million jobs respectively. The numbers fall quite dramatically after that and by 11th place London you below 300,000 jobs.  Twelve cities have fewer than 100,000 people employed ranging from Guelph at an average of 91,000 to Belleville which is just below 50,000.  Incidentally, Thunder Bay has the second smallest total number of jobs of these 35 Canadian CMAs.


Of course, larger population centers generally are going to have more total employment.  Another way to look at employment is in terms of employment intensity or density.  In per capita terms, do some cities simply have more employment depth or density adjusted for population meaning ultimately more jobs and opportunity?  This is done in Figure 2 where the same cities are now ranked in terms of employment per 100,000 population.  The falloff from the top to bottom performers is no longer as dramatic when the comparison is done this way.  Vancouver is now the most employment dense CMA with 56,507 people employment per 100,000 population while Windsor is the least employment dense at 39,122.  Thunder Bay moves up significantly from the previous ranking now placing 24th out of 35.  Meanwhile, Toronto is not as employment dense as Regina or Guelph but tops Saskatoon and Moncton. 

A historical point: Thunder Bay's CMA population has not changed much in 40 years but its total employment prior to the forest sector crisis of the early 2000s used to fluctuate between 65,000 and 70,000 jobs whereas now it fluctuates around 60,000.  That means that several decades ago, Thunder Bay was more employment dense than the present. Naturally, a historical examination of employment density is in order for many Canadian CMAs but one suspects it would provide answers that many would rather not hear.


Still, if you are looking for employment nationally, it is not just the total size of the labour market in terms of jobs that you should be looking at but also the density of employment.  On the one hand, places with low employment density may be facing more of a labour shortage and therefore be a source of opportunity.  More likely, places with higher employment to population ratios are simply more dynamic economically and have more opportunities to offer.  Places with low employment to population ratios may simply be more economically depressed that those with higher ones. 

Friday, 8 July 2022

The Shape of Labour Force Things to Come


If the June 2022 Labour Force Survey is part of a trend, Canada’s labour shortage issues are going to be getting worse.  On the positive side, the unemployment rate reached a new consecutive low of 4.9 percent in June and politicians with vested interests will no doubt seize on this as good news.  On the other hand, total employment fell in June by 43,000 jobs with the employment loss almost entirely due to a decrease in workers aged 55 years and older.  As well, the number of self-employed workers fell by 59,000 (2.2 percent) while the number of employees in both the public and private sectors held steady.  Dig deeper, and the long-term trend shows self-employment declining while public sector employment has grown over the last few years – not exactly good news for the health of the business sector.  And, as final points, the size of the labour force between May and June shrank by 97,500 while the participation rate in the economy shrank from 65.3 percent to 64.9 percent.  Remember that this is the start of summer, usually when things pick up.


So, what is going on here? I like to term this the Thunder Bayization of Canada’s economy.  For quite a few years now, Thunder Bay and indeed much of northern Ontario has seen low unemployment rates.  These are usually touted by local community leaders as good economic news.  After all, if the unemployment rate is low what could be better news than that?  Except, the problem is that in the case of Thunder Bay, both the labour force and total employment shrank permanently after the forest sector crisis nearly twenty years ago and has never really recovered.  Moreover, with the aging of its labour force, the local labour force has shrunk faster than employment hence resulting in a decline in unemployment rates.  Total employment has shrunk.  This continues as even the June 2022 labour force shows that in Thunder Bay since May the labour force and total employment both fell though this time employment fell a bit more than the labour force so that the unemployment rate rose slightly to 4.3 percent.  Think about it – a chronically depressed city-region with an unemployment rate below the national average of 4.9 percent.


There is a lot going on here but basically, the two-year pandemic hiatus of less work with substantial government benefits, the continuation of extended EI benefits and accumulated savings have caused a shrinking of people ready and willing to work.  Combine that with an aging labour force – about 20 percent of the labour force and employment is people aged 55 and over – and the start of retirements which has probably also been accentuated by the pandemic.  Indeed, one suspects that for some the CERB was a nice early retirement/buyout package courtesy of the government.  Then there is the pandemic toll on small business and the resulting shrinking of self-employment also.  Put it all together, and you have the start of a growing and continuing labour shortage in Canada. 


Thunder Bay can function in an economy where the number of people shrink, and inflows of assorted government transfers keep the economy going.  However, can this be a sustainable future for an entire country where more and more people simply withdraw or retire from the labour force and the number of people available for work and employed shrinks?  Can an economy where everyone wants to enjoy the consumption of goods and services exist alongside one where there are not enough people available to work?  In the absence of immigration, this would probably be worse.  Food for thought.


Thursday, 5 August 2021

Employment Growth Snapshot: The Niagara Region


Ontario’s economy over the last decade has seen the GTA-Waterloo-Barrie triangle as the province's employment growth engine with the Ottawa region thrown in for good measure.  The rest of the province has seen more differential and often slower employment growth.  While many in northern Ontario might feel that all of southern Ontario is a cornucopia of economic growth it remains that even this  region is not homogeneous.  One interesting region a stone’s throw from the GTA is of course the Niagara region which can be subdivided into the Hamilton area at the head of the lake and St. Catharines-Niagara along the remainder of the Niagara peninsula.


Figures 1 and 2 show employment in these two sub regions of Niagara for the period 2006 to 2021.  After almost a decade of stability, Hamilton saw an employment boom after 2016 which saw about 30,000 jobs – an 8 percent increase – added literally overnight.  While there was a drop during the pandemic, the rebound has returned employment to almost where it was during the boom suggesting that this is a permanent expansion in its employment base.  Between 2006 and 2019, St. Catharines-Niagara added about 12,000 jobs – an expansion of 6 percent over a much longer term.  However, the pandemic rebound does not seem to have taken hold in the region and employment now is back where it was over a decade ago.


This differential performance between two sub-regions adjacent to the GTA is largely a function of Hamilton’s closer proximity to Toronto which is fueling a construction boom in residential development both detached and multi-unit.  The downtown area is seeing numerous high density condominium units and even the rest of the city particularly on the mountain fringe demarked by beyond Rymal Road is seeing residential development.  Of course the continued expansion of residential sub-divisions is causing concern as adjacent farmland is being taken out of service and urban sprawl proceeds.  This of course raises an interesting dilemma as on the one hand, housing has become extremely unaffordable in Hamilton over the last couple of years in part because of supply constraints in the face of increasing demand.


However, it is not just all residential construction.  There have been quite a few non-residential projects over the last few years including a new Amazon distribution center currently underway near the airport area, and expanding transport, retail and research facilities. The result is employment growth as Hamilton becomes increasingly integrated into the Mississauga Conurbation stretching from Oshawa-Whitby in the east to Hamilton with feelers stretching down to St. Catharines.  The launch of hourly GO-Train service into Hamilton this month is the final linchpin that will make the city a home to more Toronto based employees.  However, without an expansion in housing supply whether high density infill or new greenfield, housing prices will likely continue to rise.  This risks pricing local residents out of their own city - something that is already happening. 

Monday, 12 July 2021

Moving Beyond the Pandemic in Ontario


With each passing day, the new COVID-19 case count has been diminishing in Ontario.  Today’s tally was 114 and there were zero deaths.  Indeed, the number of daily deaths has been in the single digits since July 1st.  For Thunder Bay District, the last while has  seen a zero daily case count more often than not  There are only two active cases in the District and the hospital has no COVID cases.  And vaccination rates continue to grow with 69 percent of all people in Ontario having received at least one dose and 47 percent being fully vaccinated with two doses.  For the time being, the pandemic is practically over, and the province is slowly reopening its economy with the third stage set to begin this Friday.


Moving forward, the challenge is many-fold.  First, the damage done to the economy is significant.  Ontario had the most protracted lock down in Canada and indeed in much of the developed world.  There are many businesses that after such a protracted lock down will not reopen.  The implications for business formation and investment is serious.  Moreover, the reopening is proceeding at such a slow pace that it may indeed be too late for many businesses.  Employment is rebounding but we are still not where we were before the pandemic.  In 2019, total employment in Ontario stood at 7.377 million employed persons.  In 2020 it fell to an annualized 7.022 million. As of June 2021, the most recent numbers suggest that at 7.273 million, we are still not there yet.


And, try getting anything done.  Employment and labour force participation have both shrunk.  The labour shortage which has been underway due to the aging of the population has been made worse with the shutdown and withdrawal of labour not to mention the reduced immigration of the last year.  Indeed, if Thunder Bay is any indicator, trying to get anything done in terms of household repairs and services is very difficult. Everyone is booked and prices have gone up.  Thunder Bay was always a difficult place to get things done without a bevy of personal connections often acquired in high school and the problems seem to have become worse in the wake of the pandemic. 


Yet the recovery continues, but much depends on what happens next with the pandemic.  The summer is a golden time and for the post-pandemic recovery to continue beyond September vaccination rates must continue to rise.  With new variants percolating around the world and travel resuming, getting total double vaccination rates above 80 percent is crucial.  September and the return to more indoor activity will be an important test as to whether or not we really have got things under control.


While it is important to relax restrictions as normalcy returns there is one restriction that should be maintained for the remainder of the summer and into the fall and it should be a very simple one – if you are in an indoor public space, you must wear a mask.  It is true other provinces are already moving away from this but in my opinion this is premature.  I think you can probably open everything up for indoor activity – gyms, theaters, dining etc… with fairly generous capacity constraints but the one thing that should be maintained is a face mask particularly this fall. Even in a restaurant, except at your table with your designated dining partner or party, there needs to be a face mask on the way in and as soon as you leave your table with servers always masked.  It’s a simple rule and one with the greatest benefits in preventing a resurgence until the vaccination rates are much higher.  


Whether we are up to this final task or plan to throw this modest caution to the winds remains to be seen.


Tuesday, 11 May 2021

Ontario Employment During a Pandemic Year

 Statistics Canada's April 2021 Labour Force survey results show the employment effects of the third wave lock-downs in Canada and Ontario.  Indeed, of the 207,000 jobs lost in Canada between March and April, about three quarters (153,000) were in Ontario with a sizeable portion of the losses amongst youth (73,000). and in Toronto (53,000).   However, the monthly numbers obscure the fact that for the most part, there has been an employment recovery underway in Ontario.  From a peak of 7,487,300 jobs in February of 2020, employment in Ontario fell 13 percent to bottom out at 6,497,300 in June of 2020 before starting to rise again and as of April 2021 stood at 7,256,500 jobs.  However, this employment level is still nearly 231,000 jobs below the February 2020 employment peak.

Based on the April numbers, year over year we are up 257,000 jobs or about 3.7 percent.  The accompanying figure plots major Ontario urban centers and Ontario as a whole in terms of the ranked percentage employment gains from April 2020 to April 2021.  It also includes the percentage change from February 2020 to April 2020.  Peterborough, Windsor and Brantford, have seen the largest percent employment gains over the course of the last twelve months.  Indeed, if one goes back to February 2020, Peterborough is up 5,000 jobs from the February employment peak - or nearly 9 percent.   Brantford is also up from its February peak as are Guelph and London.  

Everyone else is still below where they were in February of 2020.  The worst year over year performances are in Sudbury, Oshawa and Barrie, which range from a 0 percent increase to a six percent drop.  Indeed, Barrie is down over 15,000 jobs since February of 2020 for a total drop of 12 percent.  Barrie's recovery appears to have peaked in August of 2021 and has come down in employment terms since. 

And of course, there is the biggest job engine of them all - Toronto. Here the year over year April numbers are up 2.2 percent - for an increase of 70,600 jobs but Toronto is still down 180,000 jobs from its February 2020 peak.  So, nearly a year and a half into the pandemic, Ontario is still hurting with Toronto the largest source of missing jobs.