Northern Economist 2.0

Wednesday 21 June 2023

Recent Employment Growth in Ontario: A Snapshot

 When it comes to employment growth, the Canadian and Ontario economies are still growing relatively robustly despite nearly a year of Bank rate increases that aim to cool off the economy and inflation.  The accompanying figure presents the percent change in total employment (monthly data, three-month moving average, not seasonally adjusted) across Ontario and its main economic regions over two recent time periods: May 2022 to May 2023 (over one year) and January 2023 to May 2023 (the last five months).  The results suggest overall robust growth but with some major differences across the province.


Year over year (May 2022 to May 2023), employment in Ontario as a whole has grown nearly 2 percent with the period from January 2023 to May 2023 growing at just below 1.5 percent.  Year over year growth was highest in Windsor-Sarnia (9 percent) followed by the Kitchener-Waterloo-Barrie area (7 percent), Muskoka-Kawartha (5 percent) and then the Northwest (4 percent).  Toronto and Ottawa also saw growth year over year at about 2 percent respectively.  The latter two account for most of the job creation in Ontario despite the lower growth rate because well over half of Ontario employment is in these two cities.  

What does stand out in these employment growth numbers is that some parts of Ontario are not doing as well as others.  Kingston-Pembroke, Hamilton-Niagara, London and Northeastern Ontario have seen employment decline both year-over-year and since January of this year.  While Windsor is up significantly year-over-year, it turns out that 2023 has seen much slower growth.  Stratford-Bruce is down year-over-year but there has been growth in 2023.  Then there is Northwestern Ontario which appears to be in the midst of a relatively strong employment surge.  

So, overall Ontario is still booming.  Over the period 2006 to 2023, average annual monthly employment growth has been approximately 1.2 percent so growth rates in the 1.5 to 2 percent range mean Ontario as a whole is still doing exceptionally well.  True, these growth rates are down from the immediate rebound of the post pandemic era but overall since May of 2022 Ontario has added 144,000 jobs which averages to about 12,000 jobs a month - well above historical performance.  On average, since 2006 Ontario has added about 7500 jobs a month.  As for the regions exhibiting slowdowns in employment creation, they are in many respects areas where longer-term economic and employment growth has consistently been a challenge with the exception of the Northwest which seems to be seeing a robust uptick rooted in forestry, mining and tourism as well as public sector construction.

So, with the first half of 2023 nearly done, it appears Ontario overall is in good shape.

Tuesday 3 January 2023

The Rise of the Polygon: The Evolution of Regional Concentration in Ontario

Last post, we looked at Ontario’s population and in particular its concentration in the GTA and what I termed the GTAPlus or "The Polygon" – a geographic area essentially going from Oshawa to the end of the Niagara peninsula and then to Kitchener-Waterloo and finally out to Barrie and back to Oshawa with Toronto approximately in the center.  Approximately two-thirds of Ontario’s population and by extension its economy are clustered in this small area whose perimeter is about 500 km and encompasses a total area of nearly 14,000 square kilometers and a land area of about 11,000 square kilometers.  On a map of Ontario, this area looks like a postage stamp and represents only about 1.3 percent of its area. Yet, well over nine million people out of Ontario’s 14 million people live here and it accounts for approximately 600 billion in GDP – nearly 70 percent of Ontario’s economy.


In many respects, this core area has always been the heart of Ontario’s economy but less so in the past in terms of its population, urban, and economic dominance.  There was a time when Ontario had somewhat more dispersed and balanced urban and economic development but the economic development of the last century has increasingly concentrated economic activity in The Polygon.  
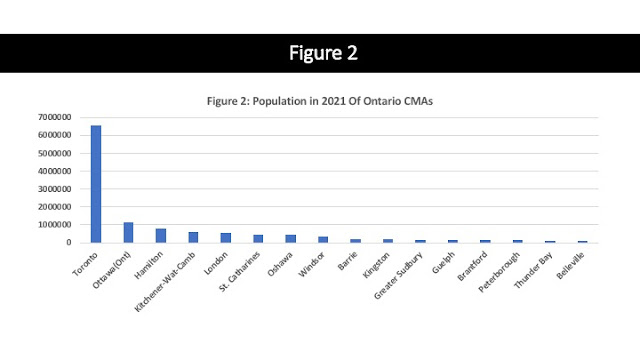
In order to provide some perspective on the evolution of Ontario’s population over time, we start with Figure 1 which plots the population of Ontario’s largest municipalities today ranked according to their 2021 population.  These differ from CMA populations – for example, while Hamilton is the third largest CMA in Ontario, its municipal boundaries and population make it the fifth largest municipality in Ontario after Toronto, Ottawa, Mississauga and Brampton.  Population size today versus 1921obscures the size of these cities 100 years ago so Figure 2 also plots the 1921 populations on their own.


Needless to say, the rankings have shifted somewhat over time.  London, Ontario was Ontario’s third largest municipality in 1921 while Hamilton was fourth, Windsor fifth and Thunder Bay (then the two Lakehead municipalities of Fort William and Port Arthur) would have been Ontario’s sixth largest city.  Ontario’s third and fourth largest cities today – Mississauga and Brampton were essentially small towns in 1921.  Indeed, much of the GTA outside of the City of Toronto today in 1921 was at the bottom of the municipal population rankings.  Indeed, when one considers these 30 largest municipalities (though Pickering and Ajax have been combined) – 23 of them can be considered members of the Polygon.  These municipalities alone account for nearly 9 million people in Ontario today, representing nearly two thirds of Ontario’s population.  However, in 1921, they totaled about 700,000 out of Ontario 2.9 million for approximately 25 percent of Ontario’s population.


Put another way, in 1921, nearly three quarters of Ontario’s population lived outside the Polygon whereas today it is at best one-third.  The increasing concentration of economic activity and population in The Polygon – Ontario’s geographic top 1 percent so to speak – reflects the decline of resource sector (agriculture included) and manufacturing industries that had dispersed population prior to 
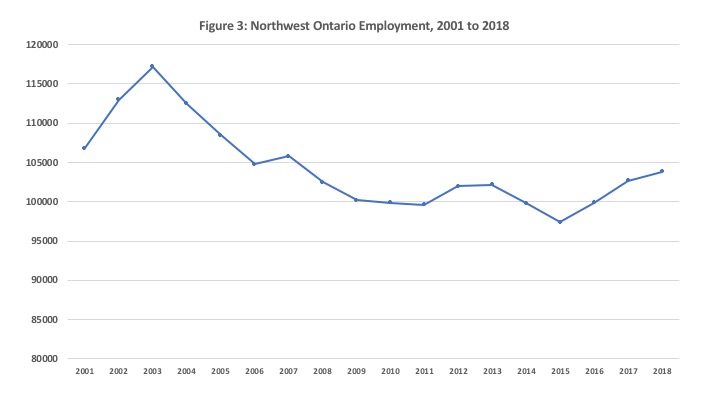
the mid 20th century.  The relative decline of cities such as Thunder Bay, Sudbury, London and Windsor – the North and Southwest regions of the province – reflects this economic shift. The growth of the Polygon cities reflects the rise of services and knowledge industries and the increasing importance of having large urban agglomerations with economies of scale and scope for associated industries and robust international connections to world cities as the source of growth.


Is this a problem?  Well it depends on your perspective I suppose.  The Polygon is a dynamic and growing population and economic cluster in Ontario and is essentially Ontario’s gateway to the international economy.  While small and compact, it has a very diverse population given it is the end point for most of the international immigration into Ontario.  By world standards, having 9 million plus people clustered on 11,000 square kilometers – over 800 persons per square kilometer – is not exactly at the top of the list.  The Polygon is still quite roomy by world standards.  For example, the Hong Kong SAR with an area of just over 1,000 square kilometers has about 7,000 people per square kilometer.  Nevertheless, for the Polygon region to proposer, it will need continuing investment in infrastructure not least of which will be housing.  It will also need investment in quality of life infrastructure such as green space and recreational facilities, not to mention transit.  Still, these challenges represent opportunities for creative solutions and innovation. The most important challenge is the institutional framework given the patchwork of municipalities and jurisdictions in this area.  Infrastructure development based on existing municipal boundaries is a sense fails to take into account the true scope of the Polygon as a growing and integrated region.


Some of those creative solutions will also need to address what happens to those living outside The Polygon.  Here the challenges are more diverse.  In the end, Ontario really consists of three regions - The Polygon, The Ottawa Nexus (Ottawa and the Kingston-Pembroke area) and then everyone else. Figure 3 outlines what this looks like in terms of distribution with the Polygon at closer to 10 million people here because Muskoka-Kawarthas are lumped into it for population purposes. The Ottawa region is the next largest outside of the Polygon but with its role as the federal capital and its own relatively compact outlying region, it will easily  find its own solutions to its growth and development issues.  More problematic will be those parts of Ontario outside of the Polygon and Ottawa Nexus, the Southwest from London to Windsor and upwards into the Bruce Peninsula and of course “The North” which with 90 percent of Ontario’s land area only has about 6 percent of the population.  The interests of a high growth densely populated region like the Polygon will differ from these slower growth and lower population density parts of Ontario.  


Needless to say, there will not be a one size fits all solution to economic growth and development in these regions but their success will ultimately all hinge on their ability to tap into opportunities offered by the Polygon and how to market the goods and service of their regions there and beyond.  There is strength in numbers and it is time for cities like Windsor and London in the Southwest, Thunder Bay and Sudbury, in the North and Peterborough and Kingston in the East to forge better relationships within their regions and with each other to promote their common interests outside.  These cities may have greater success by magnifying their lobbying power and political influence within Ontario by presenting a more  united front when it comes to economic development issues.  Easier said than done?  Yes, but when it comes to the economic future, there is no say, only do.

Monday 2 January 2023

Measuring Ontario: Introducing "The Polygon"


Happy 2023! This is the first post of the year.  Northern Economist started out as a blog dealing mainly with Thunder Bay and northern Ontario economic and policy issues but over the years the posts have branched out into a wider range of topics with Ontario as a whole much of the focus.  For 2023, I will be looking at Ontario issues a lot more given Ontario’s importance as an economy in its own right not only within Canada but indeed the world economy.  At 14.2 million people, Ontario is the largest province in Canada making up 37 percent of its population.  Within North America, if Ontario was a US state, it would be the fifth largest in terms of population coming in between New York (19.3 million) and Pennsylvania (12.8 million).  If Ontario was a country, it would be the 75th largest country in the world by population. And as for its economic size, with an estimated GDP of 956 billion dollars in 2021 ($707 billion USD), Ontario would be among one of the 25 largest economies in the world.  Yet, most of Ontario’s population and economy is highly concentrated in a rather small geographic area as illustrated in Figure 1.


As part of getting to Figure 1, let me review some of the other ways of looking at Ontario's population and economy in terms of boundaries.  Ontario’s population has been growing robustly and this robust growth is a factor -along with low productivity and business investment - why per capita GDP lately has not been growing as fast.  Ontario’s population can be looked at a variety of different lenses – economic regions, CMAs or municipalities.  Ontario used to be a very rural province but as industrialization progressed by the early 20th century half of its population lived in urban areas.  Today, over 85 percent of Ontario’s population is urban and it is increasingly being concentrated in a number of large urban areas chief of which is the GTA. 


Figure 2 plots the ranked populations of Ontario’s CMAs.  A CMA (Census Metropolitan Area) must have a total population of at least 100,000 of which 50,000 or more must live in the core.  Generally a CMA is formed of one or more adjacent municipalities and CMAs and municipalities bearing the same name usually differ in size.  For example, the City of Hamilton is just over 500,000 but its CMA is closer to 800,000 people.  The largest CMA in Ontario is the Toronto clocking in at 6.6 million.  Next comes the Ottawa CMA at just over one million, and then comes Hamilton at over 800,000 and they fall away after that in size with Belleville at about 114,000. 

Figure 3 shows the population share of these CMAs and they show the Toronto CMA – the GTA – accounting for nearly half of Ontario’s population.  Indeed, the GTA, Ottawa and Hamilton together account for 60 percent of Ontario’s population, the remaining CMAs account for 25 percent and the rest of Ontario represents 15 percent of the population.  


Another way of looking at the distribution of Ontario’s population is via the Economic Regions used by Statistics Canada and the provincial government – which total eleven.  These are broader geographic entities covering specific parts of the province and contain not only CMAs and municipalities but also all the other urban entities whether they are villages, townships, etc… as well as rural areas.  Think of them as the eleven kingdoms of Ontario.   Figure 4 ranks the regions by population size and again the Toronto (GTA) region at 6.9 million people is the largest followed this time by Hamilton-Niagara at 1.6 million and the Kitchener-Waterloo-Cambridge region at 1.5 million.  The region centered on Ottawa comes in fourth place and the much of western Ontario followed by the north and east.  At 241,000 people the Northwest is Ontario’s smallest economic region by population size.  Figure 5 plots the distribution of population by region and Toronto and the adjacent regions of Hamilton-Niagara and Kitchener-Waterloo-Cambridge account for two-thirds of Ontario’s population.  Eastern Ontario – consisting of Kingston-Pembroke and Ottawa together account for 13 percent.  Western Ontario including Stratford-Bruce is 11 percent the remaining largely northern regions – Northeast, Northwest, Muskoka-Kawartha account for nine percent.


As total output is well correlated with total population, these rankings are also pretty good indicators  of the economic size  of these regions.   However, these CMA and economic regions are just one way of dividing up the province geographically.  Here is another. Take a map of Ontario and starting at Barrie, draw a line to Oshawa and then to the end of the Niagara peninsula just below Niagara Falls, and then continue up to Kitchener and back to Barrie.  You get a rather nice looking polygon that on a map of Ontario looks a bit like a postage stamp in terms of its size.  Let's look at figure 1 again to better introduce "The Polygon'.


It turns out nearly two-thirds of Ontario population and just over two-thirds of its economy is clustered in this small polygon going from Oshawa to the end of the Niagara peninsula and then to Kitchener-Waterloo and finally out to Barrie with Toronto and the GTA  approximately in the center.  This small postage stamp area relative to the rest of the province – See Figure 1 again -  has most of Ontario’s economy and population concentrated. “The Polygon” is essentially the GTAPlus and while Toronto since confederation has always been Ontario’s largest city, its dominance of the province’s economy and population has grown to an extent that was unimaginable in the 19th century when Ontario was a more dispersed province in terms of its economic activity and population.  Much of this dominance however is rooted in the growth of a regional economy as demarcated by the Polygon. More on that in a future post.

Saturday 10 August 2019

Ontario Employment Growth Showing Regional Weakness

The July 2019 Labour Force Survey was released by Statistics Canada yesterday and showed total national employment in July was down slightly (by -0.1%) while the unemployment rate moved upwards to 5.7 percent.  What was also interesting was the year over year change in employment as it showed the last twelve months have seen substantial employment growth even if recent growth has slowed a bit.  Seasonally unadjusted employment growth results showed an increase between July 2018 and July 2019 of 2.2% for Canada and 2.3 percent for Ontario.  However, as the accompanying figure shows, when the rates are examined by economic region and ranked there is quite a difference in performance across the province.


The highest growth was for Kingston-Pembroke at 8.9% followed by the Ottawa at 4.2%.  It would appear that eastern Ontario as a whole is doing quite well.  The Kingston area is apparently seeing substantial residential and non-residential construction activity - including hospital and bridge construction - as well as an increase in food manufacturing.  Next was Toronto at 3.4% and then nearby Kitcher-Waterloo-Barrie also at 3.4%.  Lagging behind but still positive are Stratford-Bruce at 0.8% and Hamilton-Niagara at 0.6%.  Thus, eastern and central Ontario edging into the Niagara peninsula have seen employment growth.  The remainder - mainly Southwestern and Northern Ontario have not done well - seeing employment declines.  The largest decline was London at -4.5% followed by Northeast Ontario at -2.6% , Muskoka-Kawarthas at -1.8%, the Northwest at -1.7% and then Windsor-Sarnia at -0.2%. 

With respect to Northern Ontario, employment in the Northeast declined from 257,400 to 250,800 between July 2018 and 2019 while the unemployment rate rose from 6% to 6.8%.  In the Northwest, employment fell from 107,800 to 106,000 while the unemployment rate rose from 4.9% to 5.6%.  If there is an economic slowdown or recession in the offing, it would appear that it may already be underway in parts of Ontario.

Thursday 7 February 2019

Regional Employment Update: Ontario Regions and the North


Ontario’s economy has increasingly become a tale of two regions – the GTA and everyone else.  It is worth doing a quick review and update of regional employment numbers (data from Statistics Canada) that provide some additional insight on the past and the most recent distribution of regional employment.  In 2001, employment in Ontario was 5.921 million jobs and over the period 2001 to 2018 it rose by 22 percent to reach 7.242 million jobs.  Figure 1 plots the growth rate of Ontario employment as well as for the five major regions from 2001 to 2018 as well as for the sub-periods of 2001 to 2010 and 2010 to 2018. 

 
In terms of overall growth rates, employment expanded the most in the GTA, which saw an increase between 2001 and 2018 of nearly 32 percent.  Indeed, the GTA’s share of Ontario employment during this period went from 45 percent to 48 percent.  The next largest increase was for the area immediately adjacent to the GTA – central Ontario - comprising of Muskoka and the Kawarthas, Kitchener-Waterloo-Barrie and Hamilton Niagara.  It saw growth of nearly 23 percent in employment and its share of Ontario’s employment remained constant at about 23 percent of the total between 2001 and 2018.

The next highest growth rates were for Eastern Ontario and the Southwest respectively at 17 and 5 percent each.  However, this employment growth was not enough for both of these regions to hold their own in terms of employment shares.  While Eastern Ontario maintained its 13 percent share of total employment between 2001 and 2018, the Southwest saw a decline from 13 to 11 percent.   


And then there is the north which saw employment drop by 1 percent between 2001 and 2018 from 358,000 to 354,000 and its employment share of the provincial total drop from 6 percent to 5 percent.  Of course, this trend is nothing new, but such an update is another reminder that despite a plethora of studies and government pronouncements over time - including the Northern Ontario Growth plan -  there has not been a reversal of northern Ontario’s economic fortunes.  Figures 2 and 3 break employment over time in the Northeast and the Northwest.  The Northeast reached its peak employment circa 2008 and has since generally trended down.  The Northwest peaked in 2003 and has trended down since though there has been a slight rebound since 2015.

And there you have it - again.