
Happy 2023! This is the first post of the year. Northern Economist started out as a blog dealing mainly with Thunder Bay and northern Ontario economic and policy issues but over the years the posts have branched out into a wider range of topics with Ontario as a whole much of the focus. For 2023, I will be looking at Ontario issues a lot more given Ontario’s importance as an economy in its own right not only within Canada but indeed the world economy. At 14.2 million people, Ontario is the largest province in Canada making up 37 percent of its population. Within North America, if Ontario was a US state, it would be the fifth largest in terms of population coming in between New York (19.3 million) and Pennsylvania (12.8 million). If Ontario was a country, it would be the 75th largest country in the world by population. And as for its economic size, with an estimated GDP of 956 billion dollars in 2021 ($707 billion USD), Ontario would be among one of the 25 largest economies in the world. Yet, most of Ontario’s population and economy is highly concentrated in a rather small geographic area as illustrated in Figure 1.

As part of getting to Figure 1, let me review some of the other ways of looking at Ontario's population and economy in terms of boundaries. Ontario’s population has been growing robustly and this robust growth is a factor -along with low productivity and business investment - why per capita GDP lately has not been growing as fast. Ontario’s population can be looked at a variety of different lenses – economic regions, CMAs or municipalities. Ontario used to be a very rural province but as industrialization progressed by the early 20th century half of its population lived in urban areas. Today, over 85 percent of Ontario’s population is urban and it is increasingly being concentrated in a number of large urban areas chief of which is the GTA.
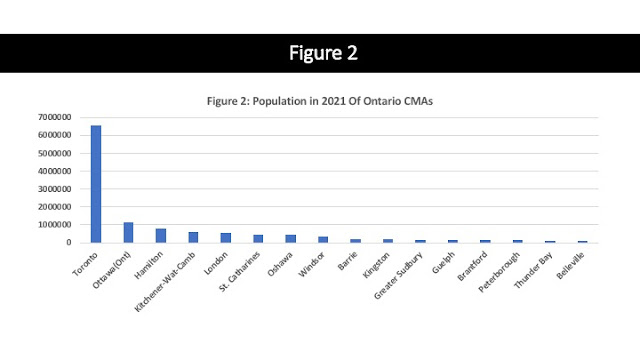
Figure 2 plots the ranked populations of Ontario’s CMAs. A CMA (Census Metropolitan Area) must have a total population of at least 100,000 of which 50,000 or more must live in the core. Generally a CMA is formed of one or more adjacent municipalities and CMAs and municipalities bearing the same name usually differ in size. For example, the City of Hamilton is just over 500,000 but its CMA is closer to 800,000 people. The largest CMA in Ontario is the Toronto clocking in at 6.6 million. Next comes the Ottawa CMA at just over one million, and then comes Hamilton at over 800,000 and they fall away after that in size with Belleville at about 114,000.
Figure 3 shows the population share of these CMAs and they show the Toronto CMA – the GTA – accounting for nearly half of Ontario’s population. Indeed, the GTA, Ottawa and Hamilton together account for 60 percent of Ontario’s population, the remaining CMAs account for 25 percent and the rest of Ontario represents 15 percent of the population.

Another way of looking at the distribution of Ontario’s population is via the Economic Regions used by Statistics Canada and the provincial government – which total eleven. These are broader geographic entities covering specific parts of the province and contain not only CMAs and municipalities but also all the other urban entities whether they are villages, townships, etc… as well as rural areas. Think of them as the eleven kingdoms of Ontario. Figure 4 ranks the regions by population size and again the Toronto (GTA) region at 6.9 million people is the largest followed this time by Hamilton-Niagara at 1.6 million and the Kitchener-Waterloo-Cambridge region at 1.5 million. The region centered on Ottawa comes in fourth place and the much of western Ontario followed by the north and east. At 241,000 people the Northwest is Ontario’s smallest economic region by population size. Figure 5 plots the distribution of population by region and Toronto and the adjacent regions of Hamilton-Niagara and Kitchener-Waterloo-Cambridge account for two-thirds of Ontario’s population. Eastern Ontario – consisting of Kingston-Pembroke and Ottawa together account for 13 percent. Western Ontario including Stratford-Bruce is 11 percent the remaining largely northern regions – Northeast, Northwest, Muskoka-Kawartha account for nine percent.


As total output is well correlated with total population, these rankings are also pretty good indicators of the economic size of these regions. However, these CMA and economic regions are just one way of dividing up the province geographically. Here is another. Take a map of Ontario and starting at Barrie, draw a line to Oshawa and then to the end of the Niagara peninsula just below Niagara Falls, and then continue up to Kitchener and back to Barrie. You get a rather nice looking polygon that on a map of Ontario looks a bit like a postage stamp in terms of its size. Let's look at figure 1 again to better introduce "The Polygon'.

It turns out nearly two-thirds of Ontario population and just over two-thirds of its economy is clustered in this small polygon going from Oshawa to the end of the Niagara peninsula and then to Kitchener-Waterloo and finally out to Barrie with Toronto and the GTA approximately in the center. This small postage stamp area relative to the rest of the province – See Figure 1 again - has most of Ontario’s economy and population concentrated. “The Polygon” is essentially the GTAPlus and while Toronto since confederation has always been Ontario’s largest city, its dominance of the province’s economy and population has grown to an extent that was unimaginable in the 19th century when Ontario was a more dispersed province in terms of its economic activity and population. Much of this dominance however is rooted in the growth of a regional economy as demarcated by the Polygon. More on that in a future post.