Northern Economist 2.0

Tuesday, 31 March 2026

Northwest Resilience and Growth


The Northwestern Ontario Municipal Association (NOMA) will be meeting April 22nd to 24th for its 2026 conference and annual general meeting in Thunder Bay, under the theme “Resilience.” After the winter we have had, resilience is an apt theme though one suspects the choice of theme pertains to the economy and municipal finances rather than the weather and the gauntlet that has become the region’s highways. Economic resilience is especially important these days and it is important to note that the economy in Northwestern Ontario has been doing rather well over the last few years if one is to take labour force data at face value.

It has been an era not of decline or stagnation but of growth with that growth occurring both in the region’s dominant metropolis of Thunder Bay but also outside of it.  Indeed, there has been a noticeable improvement in one of the key indicators at least from the general public’s perspective – the unemployment rate.  From highs of 8 percent in the wake of the Great Recession and Forest Sector Crisis, the unemployment rate in Northwestern Ontario in 2025 stood at 4.6 percent compared to over 6 percent for Canada and over 7 percent for Ontario.  Using data from Statistics Canada, a more detailed portrait of improvement emerges. 


Figure 1 plots three labour market indicators for Northwestern Ontario comparing 2015 with 2025.  Between these two years, the population aged 15 years and over grew from 173,400 to 184,200. The labour force grew from 104,700 to 112,500 and employment grew from 98,400 to 107,300.  Of course, it is worth looking at the data in terms of the Thunder Bay CMA and the rest of the region given that Thunder Bay CMA accounts for about 60 percent of both the population and employment of the entire region.  


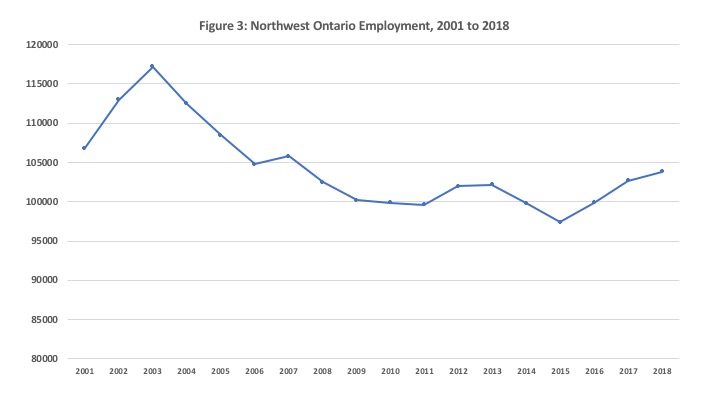
Figure 2 repeats the indicators for the Thunder Bay and adds Full Time(FT) and Part Time (PT) Employment.  Thunder Bay’s population aged 15 years and over increased by 7,400 between 2015 and 2025.  This was accompanied by labour force growth also of 7,400 individuals and employment growth again of 7,400 with FT employment growing by 8,100 while PT Employment declined by 700 jobs.  The good news here is that this employment creation was overwhelming FT employment, and this pattern repeats itself outside of Thunder Bay.   Figure 3 shows that for the rest of Northwest Ontario outside of Thunder Bay, the population aged 15 years and over grew by 3,400 with the labour force growing by 400 and employment growing by 1500.  FT employment in the region outside Thunder Bay grew by 1,800 while PT employment also declined by 300 jobs.  


Figure 4 compares percent growth in these indicators across Thunder Bay and the Rest of Northwest Ontario.  Between 2015 and 2025, population aged 15 and over grew 7 percent in Thunder Bay and 5 percent in the rest of the region.  The labour force grew nearly 12 percent in Thunder Bay but only 1 percent in the rest of the region.  Meanwhile, employment grew 12.5 percent in Thunder Bay and 3.8 percent in the rest of the region.  Full time employment grew impressively by nearly 18 percent in Thunder Bay and almost 6 percent outside of Thunder Bay.  Part time employment declined more in Thunder Bay at -5 percent as opposed to about -4 percent outside of Thunder Bay.


Figure 5 illustrates the annual unemployment rates in Thunder Bay and the outside region.  Both have declined over time with the decline somewhat sharper in the region outside of Thunder Bay.  That is because the labour force has expanded more rapidly in Thunder Bay relative to the rest of the region as Thunder Bay has attracted more population growth.  Nonetheless, a rising tide appears to have lifted all boats and the improvement in full time employment is especially welcome.


What has been driving these improvements?  The construction work both in Thunder Bay and the region whether on the electricity grid or highway improvement has been a factor.  Thunder Bay can add housing and hotel construction to this set of projects not to mention a billion-dollar correctional facility. Then there is mining development which continues to generate employment and activity.  Of course, the region also benefits from a large public sector and quasi-public sector particularly in the health, social assistance and indigenous economic sectors which has also been a factor in employment growth nationwide.  All these sectors in Northwest Ontario have been relatively well sheltered from the ongoing tariff dispute with the United States.  While the Northwest has not escaped unscathed from recent employment losses, it remains that much of the fallout has hit the manufacturing sector in southern Ontario.

So, regional municipal delegates and leaders will have a lot to celebrate at this year’s NOMA Meetings. Indeed, this growth should also be reflected in growing municipal tax bases which will afford additional revenue.  Yet, it is not time to rest on laurels given that the economy both nationally and globally remains turbulent and uncertain.  Hopefully the region will be able to capitalize both on critical minerals mining as well as the growth in defense related spending.

Thursday, 7 February 2019

Regional Employment Update: Ontario Regions and the North


Ontario’s economy has increasingly become a tale of two regions – the GTA and everyone else.  It is worth doing a quick review and update of regional employment numbers (data from Statistics Canada) that provide some additional insight on the past and the most recent distribution of regional employment.  In 2001, employment in Ontario was 5.921 million jobs and over the period 2001 to 2018 it rose by 22 percent to reach 7.242 million jobs.  Figure 1 plots the growth rate of Ontario employment as well as for the five major regions from 2001 to 2018 as well as for the sub-periods of 2001 to 2010 and 2010 to 2018. 

 
In terms of overall growth rates, employment expanded the most in the GTA, which saw an increase between 2001 and 2018 of nearly 32 percent.  Indeed, the GTA’s share of Ontario employment during this period went from 45 percent to 48 percent.  The next largest increase was for the area immediately adjacent to the GTA – central Ontario - comprising of Muskoka and the Kawarthas, Kitchener-Waterloo-Barrie and Hamilton Niagara.  It saw growth of nearly 23 percent in employment and its share of Ontario’s employment remained constant at about 23 percent of the total between 2001 and 2018.

The next highest growth rates were for Eastern Ontario and the Southwest respectively at 17 and 5 percent each.  However, this employment growth was not enough for both of these regions to hold their own in terms of employment shares.  While Eastern Ontario maintained its 13 percent share of total employment between 2001 and 2018, the Southwest saw a decline from 13 to 11 percent.   


And then there is the north which saw employment drop by 1 percent between 2001 and 2018 from 358,000 to 354,000 and its employment share of the provincial total drop from 6 percent to 5 percent.  Of course, this trend is nothing new, but such an update is another reminder that despite a plethora of studies and government pronouncements over time - including the Northern Ontario Growth plan -  there has not been a reversal of northern Ontario’s economic fortunes.  Figures 2 and 3 break employment over time in the Northeast and the Northwest.  The Northeast reached its peak employment circa 2008 and has since generally trended down.  The Northwest peaked in 2003 and has trended down since though there has been a slight rebound since 2015.

And there you have it - again.

Tuesday, 6 November 2018

Natural Resource Resurgence in the Northwest


There has been good news when it comes to the forest sector in northwestern Ontario in the wake of nearly a decade of doom and gloom.  Softwood lumber prices have rebounded and there is expanded production underway at sawmills in Ear Falls and Kenora with the two plants now providing about 250 jobs.    In White River, the previously closed sawmill has now been operating for about five years.  Resolute Forest Products just announced its third quarter profits were up and  it would pay a special dividend and its optimism for the future recently translated into an announcement that it would invest $53.5 million on its northwestern mill operations. 

According to the MNR, in 2006, there were 40 large active sawmills in Ontario (mills that processed more than 50,000 cubic metres annually) of which 34 were in northern Ontario.  There were 58 medium size mills (processing 5,000 to 50,000 cubic metres annually) in Ontario of which 14 were in northern Ontario. There were nearly 60 small sawmills in Ontario (less than 5,000 cubic metres in production annually) of which 19 were in northern Ontario.  The sawmill industry was distributed throughout the province, but large employment intensive mills were concentrated in the north.  By 2012, Ontario was down to about 97 mills – a 40 percent reduction from 158 to 97 sawmills. 

As for the pulp and paper mills, Canada as a whole saw a decline from 50 to 30 pulp mills between 2000 and 2014 – a reduction again of 40 percent.  Approximately over the same period, total employment in logging, paper and wood products in Canada fell from 308,664 to 190,651 – a loss of 118,000 jobs or a drop of about 38 percent.  As for northern Ontario, in 2003 there were 12 large pulp and paper mills in northern Ontario while by 2012 the number had gone down to 7 – a drop of 42 percent.  Since then, the mill in Iroquois Falls has also shut down and while there were plans for redevelopment it has since suffered an unfortunate fire.

The forest sector crisis in northern Ontario saw the loss of over 20,000 jobs in the northwest part of the province alone.  It was not just a downturn but in many respects the end of an entire way of life.  Well-paying industrial jobs in many small communities that supported a small-town friends and family oriented lifestyle vanished. After the destruction of the forest sector crisis that saw pulp and sawmills shuttered and significant employment losses, we are now seeing new investment and some employment recovery.  However, despite this recovery in investment and employment, it is unlikely that the size of the industry well ever again return to its former glory.


The following figures present an overview of the evolution of employment in northwestern Ontario’s resource sector.  Figure 1 plots the number of resource occupations defined by Statistics Canada as production, supervisors, technical, laborers and harvesting in natural resource, agriculture and related activities.  Note that these numbers include all resource activities and not just forest sector ones.  Still, the good news is that the number employed in resource occupations bottomed out in 2012 and has since been on an upward trend with the last few months of 2018 showing a distinct surge. In 2012, monthly resource employment in NW Ontario averaged 5600 whereas in 2018 to date it has been 7270 – an increase of almost 30 percent.  Much of this has been due to the mining sector but forestry has also played a role.

Figure 2 shows a similar trend, but it is annual resource employment by industry rather than occupation with resource industries defined as forestry, fishing, mining, quarrying, oil and gas.  Needless to say, for northwestern Ontario this would mainly be forestry and mining.  Here, the rebound seems to date from 2014 with annual employment going from 3000 in 2014 to 5100 in 2017 – an increase of 70 percent.  However, from 2002 to 2009 total employment plummeted from 9000 to just under 3000 - a drop of about 67 percent.

So resource employment is on the rebound, but we are nowhere near the peaks reached in the period from 2000 to 2003 just before the forest sector crisis took hold.  The remaining firms are more efficient and capital and technology intensive and therefore will not employ as many people for similar levels of output as produced a decade ago.  Still, the sector has survived and in some respects is even thriving which is good news.