
Ontario’s economy has
increasingly become a tale of two regions – the GTA and everyone else. It is worth doing a quick review and update
of regional employment numbers (data from Statistics Canada) that provide some
additional insight on the past and the most recent distribution of regional
employment. In 2001, employment in
Ontario was 5.921 million jobs and over the period 2001 to 2018 it rose by 22
percent to reach 7.242 million jobs.
Figure 1 plots the growth rate of Ontario employment as well as for the
five major regions from 2001 to 2018 as well as for the sub-periods of 2001 to
2010 and 2010 to 2018.

In terms of overall
growth rates, employment expanded the most in the GTA, which saw an increase
between 2001 and 2018 of nearly 32 percent.
Indeed, the GTA’s share of Ontario employment during this period went
from 45 percent to 48 percent. The next
largest increase was for the area immediately adjacent to the GTA – central Ontario
- comprising of Muskoka and the Kawarthas, Kitchener-Waterloo-Barrie and
Hamilton Niagara. It saw growth of
nearly 23 percent in employment and its share of Ontario’s employment remained
constant at about 23 percent of the total between 2001 and 2018.
The next highest
growth rates were for Eastern Ontario and the Southwest respectively at 17 and
5 percent each. However, this employment
growth was not enough for both of these regions to hold their own in terms of
employment shares. While Eastern Ontario
maintained its 13 percent share of total employment between 2001 and 2018, the
Southwest saw a decline from 13 to 11 percent.

And then there is the
north which saw employment drop by 1 percent between 2001 and 2018 from 358,000
to 354,000 and its employment share of the provincial total drop from 6 percent
to 5 percent. Of course, this trend is nothing
new, but such an update is another reminder that despite a plethora of studies
and government pronouncements over time - including the Northern Ontario Growth
plan - there has not been a reversal of
northern Ontario’s economic fortunes.
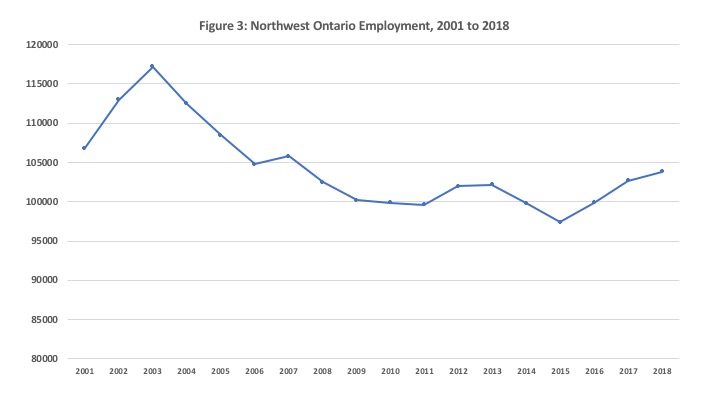
Figures 2 and 3 break employment over time in the Northeast and the Northwest. The Northeast reached its peak employment circa
2008 and has since generally trended down.
The Northwest peaked in 2003 and has trended down since though there has
been a slight rebound since 2015.
And there you have it - again.