Shortly, there will be a municipal election in Thunder Bay with
a new council selected. It is likely
there will be a major change in composition with quite a few new faces and this
will usher in a period of change though perhaps not as much change as one might
expect. In the end, The City of Thunder
Bay is a corporation and what an election does is essentially select its board
of directors who serve as an executive laying out direction with execution and
implementation being the responsibility of the City Administration. Sometimes, the more things change, the more they stay the same.
The City Manager reports to City Council and is responsible for putting into effect the directives of council within the framework of what is allowed by the Province of Ontario. More importantly, the City Manager and Administration possess the information set from which the councillors then make their decision. As well, given their role as full time employees rather than part-time representatives, they have the time to deal with the detail of issues. Inevitably, some councillors will find the level of information and detail overwhelming. The overwhelming complexity of issues in the past has often resulted in meetings where councillors on the advice of administration quickly make decisions on millions of dollars of spending and complicated bylaws with long-term impact while then spending hours debating relatively minor matters involving a few thousand dollars.
There are some departing members of the outgoing council that it will be sad to see go given that among them are the remnants of what passes for a fiscal conservative in Thunder Bay political life these days. Based on a perusal of the candidate slate currently up for election, this is likely to be one of the more activist councils that Thunder Bay has seen in some time and their first test will be the 2023 budget. A relatively new council will be heavily dependent on the advice of administration and also eager to deliver on whatever promises they have made and agendas they campaigned on, and the result will likely be a heftier tax increase than has occurred over the last few years.
The Mayor’s position is essentially one of first among equals despite whatever strong mayor powers are eventually afforded by the provincial government to Thunder Bay. The outgoing Mayor was good for Thunder Bay given he was articulate, well informed and lent a certain dignity and gravitas to the position – though some times while in the midst of yet another marathon Zoom meeting he seemed increasingly exasperated and resembled an artist being forced to work on a much smaller canvas. Such a sentiment is understandable, but the Mayor might have been happier by drawing inspiration from others in Thunder Bay and northern Ontario in a range of positions and occupations who have made a career of working on a smaller canvas.
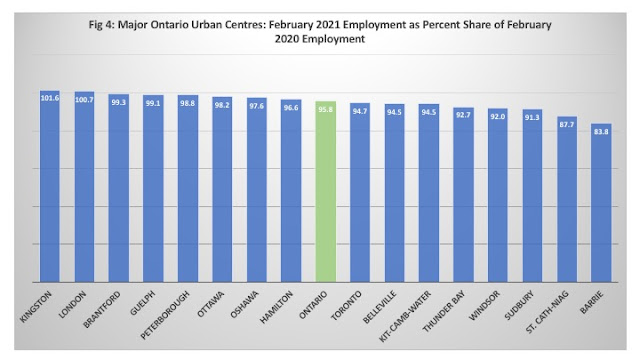
In the end, the challenges for the next council are many. There is a housing and homelessness crisis in Thunder Bay that parallels that in other cities given the climb in rents and home prices during the course of the pandemic. There is crime – with 12 murders already in 2022, Thunder Bay is well on the road to regaining its title as Canada’s murder city in per capita terms. And of course who can forget infrastructure whether it is roads and sewers or recreational infrastructure given that the Turf facility has reared its head as an issue in the election with some candidates expressing support for the concept but not at the original high cost.
Surprisingly, little mention has been made of the other chaotic infrastructure problem Thunder Bay faced during the pandemic which was the plague of leaky pipes in homes throughout the city in the wake of the sodium hydroxide water supply lead mitigation experiment. Needless to say, the public silence from the outgoing Mayor and council on this issue - no doubt on the legal advice from City Administration and its lawyers given potential costs and legal liabilities - has left a bitter taste for many. So much for a friendly community oriented city with your elected representatives always ready to lend an ear.
And the biggest issue? Well elections are in the end obviously no place for serious long term policy discussions but the fact remains that Thunder Bay’s regional role as a centre for a growing and under counted Indigenous population is the big one. Increasingly Thunder Bay and its municipal ratepayers are paying for regional services on a city tax base. The latest example here is in the case of the Thunder Bay Police Service and the recommended changes that among other things ultimately mean the Police Service has to take a regional lens to its operations.
A move to a more regional approach in policing in the end is a continuation of a trend over the last twenty-five years that can be best described as informal and piecemeal northwestern Ontario regional government by default - a regional hospital service, a district social services board, a district emergency service organization, and regional public utilities such as Synergy North and TBayTel. Indigenous organizations have also established presence in Thunder Bay and Sioux lookout providing regional services to their members. Yet, there was never really any type of democratic regional mandate for this evolution. True, one can always blame the province or Ottawa given that much of this is under provincial or federal jurisdiction but our local municipal leaders to date have ignored the long term picture painted by this evolution. After all, it is a complicated and overwhelming set of circumstances.
Of course the trend to more regional services is also a function of the claim that Thunder Bay has under counted its population and more services need to be provided to service this under counted population. But how can you provide more services if you do not know how many people there are? After all, on the one hand there are claims made by some municipal candidates we are losing people “daily” to other cities but at the same time there are apparently tens of thousands more people here who need services. Which is it? Unfortunately, social surveys based on self-reporting and life stories however compelling and reflective of reality do not a rigorous estimate make.
At minimum you would think we could put an estimate together ourselves based on local and regional electricity use from Synergy, cell phone and phone subscriptions from TBayTel, patient counts (given they have addresses or OHIP cards) from medical facilities in the region, and school enrollments from all the public boards. These should be correlated with population growth and enable an estimate with upper and lower bounds keyed to census benchmarks. In the absence of this, one ultimately has to accept the Census results which do say that according to the 2021 census, the number of Indigenous residents of the Thunder Bay Census Metropolitan Area grew by about 12 per cent between 2016 and 2021, to a total of 17,000 people.
And so, what next? Well, one suspects that after a honey moon period of sunny optimism, it will be business as usual for the next council accompanied with a fairly hefty tax increase. All the candidates acknowledge a lot of issues ranging from roads to crime to homelessness to mental health to opioid addiction. They don’t agree with increasing what taxpayers pay when it comes to revisiting the Turf facility and want to explore alternatives like donations and fundraising but in the end they will solve problems by “taking action” and “working tirelessly” which usually means a tax increase as a starting point under the banner of investing in ourselves and then avoiding constituents when they complain too much.
Nevertheless, hope springs eternal. Maybe this council will be different.