Northern Economist 2.0

Sunday 27 November 2022

Northern Ontario: Demographic Indicator Overview


Last week, I gave an economic overview of the challenges and opportunities facing northern Ontario’s economy at the Regional Meetings of the Economic Developers Council of Ontario in Thunder Bay.  I covered a lot of ground, and it is worth presenting some of the highlights for the regional economy in terms of current indicators.  This post, a quick overview of some of the key demographic trends that have been emerging in northern Ontario over the last while.   


Figure 1 provides Census results from 2006 to 2021 and they show that despite the perceptions, northern Ontario’s population is starting to grow once again.  While the period 2006 to 2016 saw a slight decline, the 2021 Census shows that population is up in both the Northeast and Northwest of the region. Between 2016 and 2021, northern Ontario’s total population grew from 780,140 to 789,519 – an increase of 1.2 percent (See figure 2) with the Northeast growing much faster that the Northwest.  On the other hand, from 2011 to 2016, the Northwest grew substantially while the Northeast actually shrank.  


Two other trends worth noting.  First, while the conventional wisdom is that the major urban centres in Ontario’s north are all major attractors of population within the region, it turns out that between 2016 and 2021, Thunder Bay, Sudbury and North Bay grew while Timmins and Sault Ste. Marie shrank somewhat (See Figure 3).  Second, the 
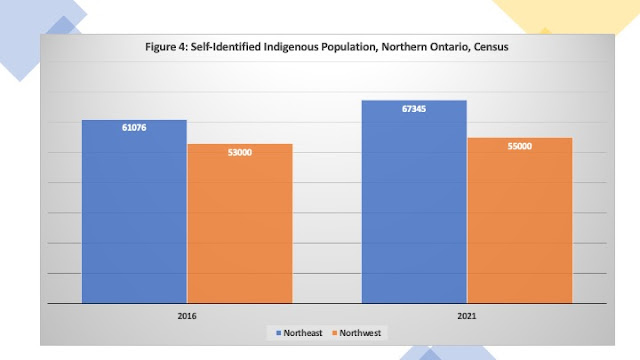
population that self-identified as Indigenous in the Census has been growing.  According to the Census (See Figure 4) the Indigenous population in the Northeast rose from about 61,000 to 67,000 (about a 10 percent increase while that in the Northwest grew from about 53,000 to 55,000 – about a four percent increase.  If one adds up the two regions, in 2021 about 122,345 people in that year identified as Indigenous in the north or about 15 percent of northern Ontario’s population.  About 24 percent of the Northwest’s population self-identified as Indigenous while 12 percent of those in the Northeast did so.  However, it should be noted that these figures may be an under count of the Indigenous population.


The trends are positive in that the region’s population is growing but the point to consider is that it is growing slower than Ontario as a whole.  While Ontario’s population was up nearly 5 percent from 2016, the North is only up about 1 percent.  This means northern Ontario’s share of Ontario’s population (which peaked in the early 1950s at nearly 12 percent) will continue to decline, all other things given.  While 2021 saw the region’s share at 5.6 percent, according to Ontario government population projections, that share could decline to 4 percent by 2046.  It is relative rather than absolute decline in population that is the real concern given that a declining share is also associated with declining long-term representation and influence within the province and the country.

Monday 5 April 2021

COVID-19 Case Trends for Ontario and TBD: What a Difference A Month Makes

 Ontario appears to be firmly in the grip of a third wave of COVID-19 that is marked by the spread of the new and more infectious variants.  As Figure 1 illustrates,  and the trend line suggests we are going to surpass the peak of the second wave in terms of daily cases.  


Ontario has been reporting close to 3,000 cases a day for the last four days and it does not look to be anywhere near peaking.  On the other hand, the Thunder Bay District appears to have gotten its long second wave finally under control and as Figure 2 shows, the trend is now down.

A month ago, the trends seemed to be completely opposite.  At that time, the Thunder Bay District was trending up pretty rapidly while Ontario as a whole up until two weeks ago still seemed undecided as to whether it was going to trend up or down.  

Of course, Thunder Bay is probably only going to have a brief reprieve because new variants of COVID-19 do not appear to have gained a foothold in the district yet though they have been making an appearance both in the Northwest.  If you check this map provided by the Toronto Star - as of March 30th, Thunder Bay District still appears to be reporting 0 new variant COVID-19 cases whereas the Northwest Health District to our west is reporting 24% new variant cases and the Algoma to our east it is reporting 68 percent.  We are lagging for now but one suspects this is not going to last.  

The only possible salvation is if Thunder Bay District can get ahead of the new variants by vaccinating heavily.  Apparently, the Astra-Zeneca was available at pharmacies as of Saturday but I am not aware if any vaccines were given out during the long-weekend.  Whereas in Thunder Bay, it is normal to have your MRI scheduled at 3 in the morning because of demand and capacity constraints, it would appear that round the clock vaccination during a pandemic is not happening.  That is either because we are incapable of innovating or thinking fast enough or more likely - there is simply not enough vaccine to keep giving shots 24/7. As well, there have been now more than a few anecdotal stories emerging on how it is possible to get a vaccine at the end of the day if you know someone working there.  I suppose what else is new in Thunder Bay, Canada's biggest high school clique masquerading as a large urban center.

Without widespread vaccination quickly, the new variants will gain a foothold here too. Relying on people social distancing and following the rules is not happening. If you have been to a large retailer the last few days, watch how most people going in do not even bother to sanitize their hands.  Compliance with and enforcement of public health measures has been the problem all along in Thunder Bay and beyond.


Monday 1 June 2020

Ontario’s “404 Error”: Is This As Good As COVID Is Going to Get?


Well, it is June 1 and after several months of dealing with the pandemic, Ontario’s daily number of new cases was 404.  Oddly enough, the internet “error” signal as your case number is probably divine commentary on the state of Ontario’s efforts to date on dealing with the corona virus.  It does appear that Ontario has stalled when it comes to reducing the daily number of new cases and after last week’s large gatherings at Trinity-Bellwoods Park and now the demonstrations in Toronto over the weekend, there will likely be another spike in cases about two weeks down the road.  Toronto has already been responsible for a disproportionate number of new cases in Ontario and this will likely get worse.  

 Of the 3,409 cases added to the Ontario total between May 16 and May 23, the Toronto Public Health Unit area added 1,955 of them – nearly 60 percent of the total.  The population of this area in 2016 was 2.7 million out of 13.5 million for Ontario as a whole – a 20 percent share.  So, it appears that COVID-19 in Toronto is occurring at about three times the provincial rate and it does not look like it is going to improve anytime soon.

The crux of the matter is illustrated in Figure 1 which shows the number of daily new COVID-19 cases from January 25th to June 1st with a 0.5 bandwidth LOWESS smooth.  The results do not require a degree in statistics or epidemiology to interpret.  We appear to have a reached a daily plateau in terms of the number of new cases.  In terms of the growth rate of total cases, we have not cracked the 1 percent daily growth rate barrier.  Indeed, the best we ever did was May 26th and 27th when we got down to 1.1 percent, but the growth rate has inched up since and today was 1.5 percent. By way of comparison, Italy is now down to a 0.1 percent growth rate in total cases. 

 
And speaking of Italy, here is another interesting comparison.  In Figure 2, Ontario and Italy daily cases are plotted since January 25th and guess what – despite having about 4 times our population and one of the worst outbreaks of Covid-19 in the world, Italy is now at about the same number of daily new cases as Ontario.


So, we do have a problem and the problem is Ontario’s disjointed attempts at dealing with the pandemic.  Like much of the country, we moved slowly at the outset in dealing with the pandemic and this still seems to be the hallmark of the Ontario response. Case in point.  Pearson airport today announced new strict health measures for dealing with COVID-19-effective June 1st including the compulsory wearing of face masks everywhere in the terminal.   Interestingly, these were not announced April 1st or even May 1st but June 1st.  Seriously?  Airports are under federal jurisdiction, why so long in finally announcing and implementing these types of measures?  The federal government is probably too busy rushing funding to one group after another – today it was $2.2 billion for municipalities - as a sort of fiscal atonement for the sin of not being ready for the pandemic and then reacting too slowly when it began.

I think a glimmer of hope is from the news reported in Italy that Dr. Alberto Zangrillo, the head of the San Raffaele hospital in Milan apparently has claimed that ““the virus clinically no longer exists in Italy”, provoking a furore in Italy. “The swabs performed over the past 10 days have showed a viral load that is absolutely infinitesimal in quantitative terms compared to those carried out a month or two months ago.”  Essentially, the virus has begun to mutate and has become less lethal.  As for Dr. Zangrillo – he looks like a pretty solid researcher type to me given his Google Scholar page.  Of course, this has been challenged by health experts and I certainly would not rush out into the street to demonstrate in public celebration. Nevertheless, Italy has been ahead of the curve with respect to the severity of the illness and if this is true, then it is a glimmer of hope. We could use a lucky break from the lack of initial awareness and plodding approaches of both the Ontario and Federal governments.

Saturday 16 May 2020

Ontario's Covid 19 Progress to Date: Not Quite There Yet

As of May 16th, 2020 Ontario is reporting 22,313 confirmed cases of Covid-19 and 1,858 deaths.  The good news is that 75 percent of cases are resolved and the active number of cases is trending down.  There have been some data glitches in reporting the last few days and while the number of new cases is trending down, it remains that the number of new cases is still what I would term a smouldering burn with the potential for re-ignition.  This is of course a concern given that Ontario is beginning to resume activity with an acceleration of openings on Tuesday.

To be fair, this is a disease whose transmission can be prevented by avoiding crowds and long-term presence in confined spaces, spending more time in outdoor well ventilated areas, practicing social distancing and practicing good hand hygiene. At the same time, this requires a fair amount of self-discipline and given that our daily case numbers are still bouncing between 300 and 400 for a week now, it means a chunk of the population still believes the rules do not apply to them and do not understand the concept of negative externalities.  These are probably the same types of people who let their barking dogs out in the middle of the night or throw cigarette butts and fast food wrappers out the window as they drive.

The figure below shows the number of daily cases with a LOWESS smoothing trend fitted for the period January 25th to May 16th.  The trend shows the number of daily cases peaked on Day 92 - circa April 25th - have have been trending downward since but the decline has been slowing and there may even be a slight upward tick.


Of course, it is not the number of new cases per day but the growth rate of total cases that is even more important and the goal should be to get it below 1 percent (and ultimately zero).  Italy, for example, is now seeing the growth rate of its total Covid-19 confirmed cases at about 0.4 percent.  But then despite initial stumbles, it has been following a stricter lock-down because it was hit much harder than other places.  Why is 1 percent important?  Well, at one percent growth it would take 72 days for the total number of cases to double.  At 20 percent daily growth - which was where Ontario was in late March - the total number of cases would double in just over three days.  If you want to get the pandemic under full control and have new cases not reignite a major spike that overwhelms the health care system, then you need that growth rate below 1 percent.  Ontario at present has seen the growth rate fall below 2 percent but the last few days have not seen it below 1.5 percent.  That is not good enough.

Ontario also appears to have a number of distinct regional pandemics under way as the next figure illustrates.  When the cases are sorted by public health units in terms of total confirmed cases per million and a two-unit moving average applied, here is what the picture looks like.
 

The highest rates of infection have been in Toronto and  Peel at 3,023 and 2,466 cases per million respectively.  There is then a drop off to a second tier in terms of severity and these health unit areas are Leeds-Grenville & Lanark (Eastern Ontario), Windsor-Essex, Durham. Ottawa, Haldimand-Norfolk, Waterloo, York and Lambton and they range from a high of 1,932 to a low of 1,713.  There is then another drop-off to a third tier consisting of the remainder going from a high of 1,291 cases per million in Niagara Region to a low of 150 cases per million in Algoma.  Note, that some of these regions are nowhere near 1 million people in population.  Thunder Bay District, for example, clocks in at 520 cases per million population but there are only about 140,000 people in the District so do the math and you can see the absolute numbers are quite small.

So, what is the long and short of this?  To date, the province has been pursuing a one-size fits all policy in dealing with the epidemic which was fine in dealing with the start of the first phases of the pandemic. However,  a one size fits all policy for re-opening given that some people are already slacking off on precautions is a bit of a concern especially in the parts of the province with higher case densities.  So, if we are going to open things up up at the same rate everywhere, everyone everywhere needs to continue exhibiting common sense and exercising personal caution and distancing measures.


Monday 27 April 2020

COVID-19 Trends in Thunder Bay District

Thunder Bay District's first COVID-19 case was reported about one month ago - on March 26th.  Since then, the number of cases have grown but the number of daily new cases appears to have declined from the peak reached April 15th.  We have however, also registered out first death as of April 23rd and given mortality rates from the illness, one can probably expect a couple more deaths based on current case load numbers.  The first figure below shows the steady ascent from the first case to the current (as of yesterday) total of 63.


The ascent appears to have slowed since the 21st and the next figure plotting daily new cases does appear to show a distinct hump peaking somewhere between April 11th and April 15th.  If over the next week, growth in new cases drys up completely then it may be that the pandemic has failed to take firm root in our part of Ontario.  This is certainly good news, but not a cause to relax given the need to maintain physical distancing protocols and precautions in the absence of either a cure or a vaccine.


Its not over yet. Maintaining personal discipline over the next few months is crucial to arresting the progress of this virus.


Saturday 18 April 2020

Is COVID-19 Peaking in Ontario?

It is now Day 85 of the start of the Covid-19 pandemic in Ontario as dated from the first case on January 25th of 2020.  There are signs of the epidemic peaking in parts of Canada like British Columbia and Saskatchewan along with discussion of the gradual reopening of activity in measured and methodical ways.  In Ontario,  as of Saturday morning the 18th of April, there have been 10,010 confirmed cases of COVID-19 and a total of 514 deaths.  The number of new cases reported today was 485,  down from 564 the previous day and 514 the day before that.  There has been some talk in Ontario also that the pandemic may be slowing and that there is some cause for cautious optimism.  Indeed, the province is expected to release new modelling numbers on Monday that some have hinted may show some support for optimism.


Well, in anticipation of that, here is my go at the numbers to date using STATA and a simple data smoothing regression technique known as LOWESS.  Figure 1 plots the total number of cases since Day 1(January 25th) when there was the first case to the present with the red line as the smoothed curve.  Needless to say, this figure does not look particularly reassuring but it is the total cumulative number of confirmed cases and the more appropriate graph in order to judge growth rates in the total case figure is Figure 2 which presents the log of total confirmed cases.  Here the evidence still shows an increase but somewhere around Day 70 - that is around April 3rd - there does seem to be a change in the growth rate and the curve trends upwards less steeply.  This is a bit of good news.


Figure 3 is yet another go at the numbers, this time a plot of the number of new confirmed cases per day again with a regression smooth.  The number of new cases per day begin to soar circa Day 50 which is March 14th but again note that the trend in new cases per day - as visualized by the LOWESS smooth - goes up at a lower rate again circa the April 3rd point.


However, the best news of all comes from looking at the growth of cases per day in terms of daily percentage growth rates in total confirmed  cases.  Figure 4 presents this data with the accompanying LOWESS smooth.  One can discount the far left of the diagram as this is the start of the pandemic with few cases and therefore some very large growth rates when the number of cases double.  The data smooth line basically shows the increase in growth rates picking up steam after Day 20 - which would be the 13th of February though the actual data starts picking that up closer to Day 30 which is February 23rd.  The  daily percent growth peaks a bit before Day 60 - March 24th - and then starts to slowly come down.  Growth has been under 8 percent since April 11th and just fell below 6 percent in today's release coming in at 5.1 percent.


So, despite my limited knowledge (borrowing from Star Trek, "I'm an economist Jim, not an epidemiologist!"), I would hazard to guess that the infection numbers today reflect what was going on about ten days ago. This gets further complicated by the fact that we are running more tests today than we were ten days ago and indeed a month ago.  Nevertheless, if we are testing more and the total number of new cases is stable but not soaring and the percentage growth rates seem to coming down, then yes we may be on the verge of bending the curve downwards and getting the pandemic under control in this province.  Assuming over the last 10 days, we have all continued physical distancing and taking precautions and the number of tests is maintained at current levels or increased, then the growth rates this week should come in about 5 percent at the start of the week and then head down towards 4 percent by Friday.  Let us hope.