Northern Economist 2.0

Thursday 18 November 2021

COVID-19 Wave Score: Ontario 4, Thunder Bay 1


It has been a while since I have plotted the COVID-19 daily case counts for both Ontario and the Thunder Bay District but with the gradually mounting numbers of recent days, now is as good a time as any to look back at the big picture for both the province and our region. The evidence suggests that for the time being matters are well in hand likely the result of Ontario’s high double vaccination rates as well as the gradual easing of restrictions with the maintenance of mask wearing in public indoor spaces.


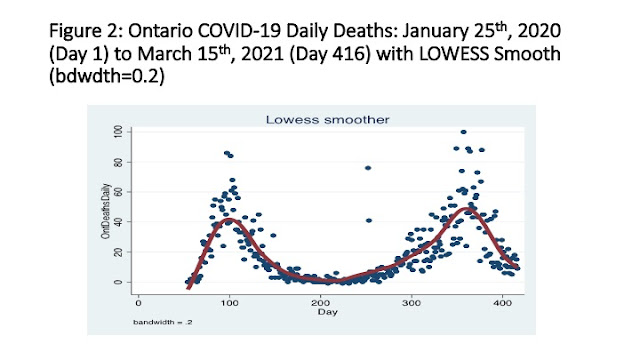
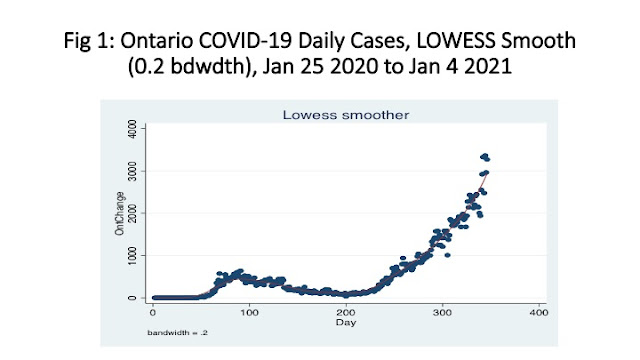
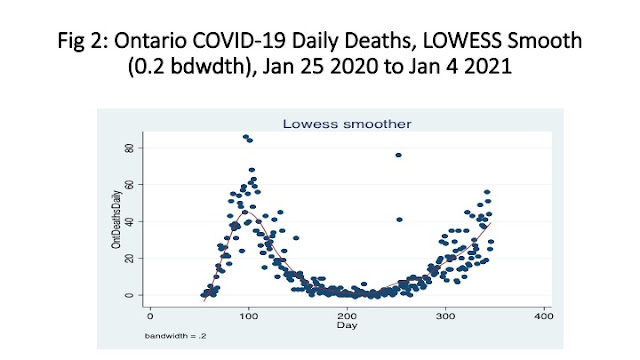
Figure 1 plots Ontario’s daily cases since the start of the pandemic and there have indeed been four waves with the second and third waves the most severe. Our fourth wave is underway, but it is subdued relative to the second and third waves.  Yet this fourth wave seems to have two components based on Figure 1 – a first upswing that appears to have peaked about mid-September and followed by a short decline and then a second upswing that does seem to coincide with the broader reopening of Ontario in mid-October.  Figure 2 does a better job of separating out these two components of the fourth wave with the current upswing starting at about day 640 which corresponds to the last week of October – several days before Halloween.


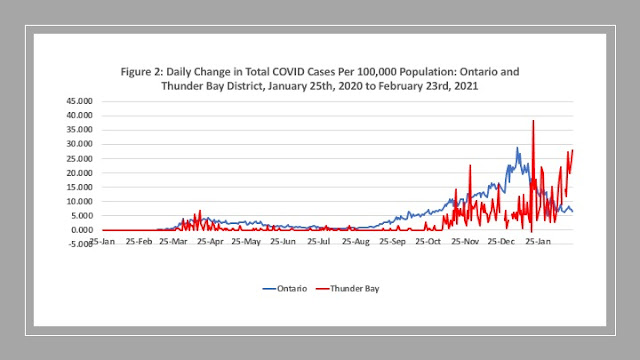
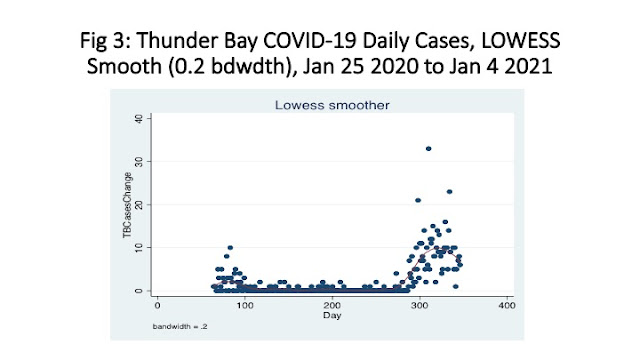
Similar charts are presented for Thunder Bay District in Figures 3 and 4.  Figure 3 reveals that over the course of nearly two years, Thunder Bay only had one very long wave that started circa Day 250 (around the first week of October 2020) and then rose over the course of the next four months to peak during the first week of March 2021 before starting a gradual decline to the current daily levels.  However, Thunder Day district also appears to be in the process of seeing a gradual upswing as Figure 4 illustrates with numbers over the last few weeks distinctly higher than they were in August. Still, over the course of the long haul, Ontario has had four distinct waves while Thunder Bay's relative isolation in the end resulted in only one.


So, going into the Christmas season and the winter, the current trends show there is likely to be a continued increase in cases though we should hopefully be spared the surges of previous waves provided vaccine provided immunity does not wane, school children begin to be vaccinated in large numbers, and booster shots make their way into the older population in a timely manner.  Many recent cases are in the school age population and given that COVID-19 is generally not very severe in the very young, that has also spared hospital ICU capacity.  So, for the time being this is what the pandemic looks like – ever present and persistent- but likely to stay in abeyance provided new and more lethal variants do not emerge.

Thursday 17 June 2021

Ontario: Is it Requiem for the Pandemic ?


Well the news in Ontario has improved dramatically on the pandemic front.  Daily case numbers today were 370 – down from over 2,000 a month ago.  Daily deaths have also been falling.  If one takes a look at the daily case counts since the start of the pandemic in late January of 2020, it looks like that the third wave is definitely on the way out.  Ontario (See Figure 1) had three waves each worse than the other.  The first wave now looks relatively minor compared to the second one which peaked in early January of 2021 and the third wave which peaked in mid-April of 2021.  


While the steep decline can be attributed to the lengthy lockdown and the rising vaccination rates (as of today 76% of Ontarians aged 18 plus have received a first shot and almost 20% have had two shots) there is also the effect of seasonality. Much like last summer, warmer weather and more people being outdoors has helped slow transmission.  Note that the second wave peaked in early winter and the drop was not as pronounced as what we are experiencing currently because we are mainly indoors in the December to March period of the year. As for the lengthy protracted lockdowns, it will be interesting to see what the retrospective analysis will be like on their actual effectiveness.


Of course, data will be a challenge and as we all know in Canada data on the pandemic from the outset  has been less than optimal. Governments at both the federal and provincial level are hoping to declare victory and move on hoping that we all forget the chaos of coordination of data, response and most recently vaccine distribution.  Trying to snag a vaccine appointment in a decentralized and chaotic system has made the process a veritable rodeo.  It will be tempting to shrug one’s shoulders and move on, but the most important lesson of the pandemic is to learn from the pandemic. If we simply do what we did in the wake of SARS two decades ago - study, plan and ignore -  what is the point? 


As for Thunder Bay District, Figure 2 illustrates that after the initial onset of the pandemic in spring of 2020 which produced a very small first wave, we had a long period of relative inactivity until mid-November of 2020 when our second wave began, and it never really ended until recently.  We had a long second wave that peaked in early March of 2021 and then began to decline and bottomed out in mid-April.  We have not gone to zero cases but have instead since mid-April been averaging 5 to 6 cases daily.  Our active case count is down and in recent days most of the cases have been outside the City of Thunder Bay, but the infection is still there percolating quietly.  


So, is this it? Is the pandemic over?  With rising vaccination rates, it is tempting to see this as the last wave.  However, there are caveats.  Full vaccinations need to continue to rise as herd immunity requires anywhere from 75 to 85 percent of the population getting two doses. However, even once fully vaccinated, it does not mean that new variants might not come along that can overcome vaccines.  And there will be no doubt a need for boosters at some point.  In addition, the steep decline is a function of the warmer weather and the real test will come this fall.  In the before time, the return to indoor activity in September was always marked by a resurgence of colds and flus and asthma with a peak usually hitting the third week of September.  If reasonable precautions such as continued masking are maintained, this should not be a problem. Still, it will be difficult to sort out colds from flus from COVID this fall. While things should be much more normal, it will probably not be as normal as we would like.

Tuesday 1 June 2021

COVID-19: An International Overview


COVID-19 case counts, mortality rates vary widely across developed world


Livio Di Matteo

Appeared in the Epoch Times, May 26, 2021


Perhaps the most noteworthy feature of the pandemic is that there was no uniform pattern of impact across advanced countries. The pandemic unfolded differently in each developed country, and governments that spent more did not as a rule more successfully contain the virus or better maintain their economies.

From the first reports of a pneumonia of unknown origin in Wuhan, China, in December 2019, the COVID-19 pandemic grew and spread around the world, with massive impacts on health, mortality rates, economies, and government budgets. Currently, the global tally is nearly 165 million cases and 3.5 million deaths. With the spread of new variants and differential rates of vaccination around the world, the effects of the pandemic will continue to reverberate worldwide.


However, we can already learn from this pandemic to help shape responses to future outbreaks.

Many people, including policymakers, view the pandemic as unprecedented or surprising, but only because the technological and economic progress of the 21st century—and resulting high living standards—has caused many to lose historical perspective. Plague and pestilence have been part of the human experience since the start of recorded history. Pandemics have happened before and will happen again. Nevertheless, many countries were caught unprepared for COVID-19.


Moreover, the pandemic did not strike everyone simultaneously, and even with additional time, some advanced countries seemed unable to heed warning signs and act quickly to implement proactive measures. Despite our instantaneous 21st-century communication and information dissemination, many countries seemingly had to experience their own pandemic before taking the matter seriously—even countries that experienced past viral outbreaks such as SARS.


As such, the pandemic’s effects were surprisingly severe in developed countries. For example, the International Monetary Fund’s advanced economies, which comprise only 18 percent of all countries, in 2020 accounted for 40 percent of the 30 countries with the highest COVID-19 deaths per million (although the older populations of advanced countries were a key factor in initial death tolls).


In the absence of vaccines or effective treatments, the world’s first year of the pandemic response unfolded more like a medieval plague or the Spanish flu. Control efforts consisted largely of face-masking, quarantines, lockdowns, and physical distancing. In the end, unlike the Black Death, it was not the deaths from COVID-19 per se that devastated economies, but rather the restrictions and stringent measures imposed by government to reduce spread. Lockdowns, quarantines, and travel restrictions disrupted global supply chains and had severe economic impacts on the international travel industry, labour-intensive services, food and accommodation, tourism, and the arts and entertainment sectors. Indeed, a one unit increase in the Oxford Stringency Index, which tracks government policy responses to the pandemic based on data from more than 180 countries, was associated with an approximate percentage point drop in real GDP growth of 0.1 percent.


Moreover, as noted in a new study published by the Fraser Institute, prolonged levels of stringent government restrictions did not significantly reduce COVID-19 case counts or deaths per million. On the plus side, high rates of testing helped control mortality rates, with each additional 100,000 tests per million associated with 21 fewer COVID-19 deaths per million. And again, countries with larger elderly populations experienced higher COVID-19 mortality rates.


Crucially, the number of hospital beds played a key role. Internationally, each additional hospital bed (per 1,000 people) was associated with 31.5 fewer COVID-19 deaths per million. Even among advanced countries, there are substantial variations in bed numbers. In 2020, hospital beds per 1,000 ranged from highs of 13.1 in Japan, 12.2 in South Korea and 8.0 in Germany to lows of 2.5 in Canada and Denmark, 2.4 in Singapore and 2.2 in Sweden.


In the end, though all countries experienced the pandemic, its intensity and severity varied as did the economic impact, and there wasn’t always a direct linear relationship between the intensity of the disease and the economic and fiscal impact. Indeed, countries with governments that spent more did not necessarily experience a better outcome in either maintaining their economies or containing the virus.

Clearly, how each country chose to play the cards they were dealt was an important determinant of the health and economic impacts reported during the pandemic’s first year.

Wednesday 26 May 2021

Canada's COVID 19 Performance: Oped


Canada’s COVID performance on key measures among worst in developed world

Livio Di Matteo 
Appeared in the Globe and Mail, May 26, 2021

There have been more than 167 million COVID-19 cases worldwide and 3.5 million deaths. Canada ranks 22nd in the world with more than 1.3 million cases and more than 25,000 deaths. Given the spread of new variants and varying vaccination rates around the world, the effects of the pandemic will be with us for some time to come.

But how does Canada compare to other advanced countries? For 2020, COVID cases per million ranged from a high of 87,000 (Czech Republic) to a low of 7 (Taiwan). Canada (approximately 19,000) ranked 24th out of 35 advanced countries. Deaths per million ranged from a high of almost 1,800 (Belgium) to 0.3 (Taiwan), with Canada in 22nd place (approximately 500 deaths per million).

However, on a crucial measure—the “case fatality rate” (total deaths from COVID-19 as a percentage of total COVID-19 cases), Canada in 2020 had the 7th highest rate (meaning 7th worst) in the developed world, due primarily to COVID’s impact on Canadians in long-term care. In 2020, 11 per cent of Canada’s COVID-19 cases, and more than 70 per cent of COVID-19 deaths, were in long-term care facilities. According to the Canadian Institute for Health Information, while Canada’s overall COVID-19 mortality rate was relatively low compared with rates in other OECD countries, we had the highest proportion of deaths in long-term care. If we’ve learned anything from COVID, it’s that we must do a much better job with long-term care here at home.

Unfortunately, lessons provided are not always lessons learned. Crucially, Canada failed to learn from the SARS outbreak.

Between 2002 and 2004, some 30 countries reported SARS cases, with only eight countries reporting more than 10 cases and only five (China, Hong Kong, Taiwan, Singapore and Canada) reporting more than 100 cases. Fast-forward to 2020, these five countries combined reported about 18,000 fewer COVID-19 cases (per million) compared to countries that did not experience SARS. Apparently, countries heavily hit by SARS learned something about how to prevent viral spread during a pandemic. Except Canada. While Hong Kong, Singapore, China and Taiwan in 2020 saw COVID-19 deaths (per million) range from 22 to 0.3, Canada reported nearly 500 deaths per million. In this key five-country group, Canada was an outlier.

Why? Post-SARS, governments in Canada studied and planned for future pandemics and increased spending on public health measures. Yet we were still unprepared for COVID-19. For example, in the years before the pandemic, the federal government seemingly (and quietly) deactivated its pandemic early warning system, failed to maintain stockpiles of personal protective equipment (e.g. masks), and once the pandemic began often moved slowly to deal with its impact. On the other hand, following its SARS epidemic, Taiwan established a National Command Centre in 2004, which helped coordinate and map out its current—and significantly more successful—pandemic response.

As for other lessons from around the world, high rates of testing remain an important factor, with each additional 100,000 tests (per million) associated with 21 fewer COVID-19 deaths per million. Last year Canada ranked 26th out of 35 advanced economies for COVID-19 tests per million.

Another important factor was the number of hospital beds per 1,000, with each additional bed associated with 31.5 fewer COVID-19 deaths per million. Among 35 advanced countries, Canada ranked 32nd for the number of hospital beds. What does that look like? Again, among advanced countries, hospital beds per 1,000 ranged from 13.1 (Japan) to 2.2 (Sweden), with Canada near the bottom at 2.5.

In summary, key deficiencies in Canada’s pre-pandemic preparation and response capability (even after the lessons of SARS), combined with low rates of testing, low numbers of hospital beds, and an inadequately prepared and protected long-term care sector, have produced relatively poor results, particularly on certain measures of mortality. As a result, Canada was forced to rely on lockdowns and other stringent measures, which—while effective during the first wave—were less effective as time wore on and Canadians grew tired and confused with the shifting rules. And it’s the restrictions imposed by government, not the pandemic’s death rates, which caused the economic disruption that will continue until a sufficient proportion of the population has been vaccinated and we reach some level of herd immunity.

In light of the suffering we’ve witnessed across the country, let’s hope we actually learn more this time around.

Monday 3 May 2021

COVID-19 Case Trends: Ontario and Thunder Bay Seem to Be Stalling

 It is the start of the month and a good time to review how Ontario and Thunder Bay District are faring in terms of the trend in daily COVID-19 case counts.  Ontario has now been in a lock down for about four weeks with Thunder Bay District in a lock for weeks before then.  The current restrictions are set to last until May 20th but it is likely they will be extended given that while the upward surge has been arrested in Ontario, there is not yet a downward trend.  As of today, Ontario is reporting a total of 473,901 COVID-19 cases and 8,118 deaths.  Daily cases climbed above 3,000 about April 2nd and peaked at 4,812 on April 16th but they have stubbornly remained above 3,000 since.  Figure 1 plots Ontario's daily cases with a LOWESS smooth and the best that can be said is that the cases have stalled with a distinct downward trend yet to emerge. 


As for the Thunder Bay District, Figure 2 shows that since the peak that was reached circa the first week of March (about Day 408), there has been a dramatic decline but we have not gone down to zero.  Rather, we seem to be leveling off at about 5 to 10 cases daily. Indeed, the average cases reported over the last two weeks is about 7.  While this is a rather manageable problem for the time being compared to what things were like in early March, it remains that these embers are capable of still sparking a much larger conflagration. Indeed, given the much higher case numbers to the west of us in the Northwestern Health Unit as well as the prairies, the potential for the more rapid spread of new variants is still there.


One suspects a distinct downward trend for the province is still several weeks away and will only occur as the vaccination process gets to larger numbers of people.  Complete eradication will likely not occur given the spread of new variants, the general non-compliance with general restriction measures by a surprisingly large share of the population and of course the refusal or reluctance of some to get vaccinated. In the United States, the widely circulating variants and vaccine hesitancy has led experts to conclude that herd immunity there is unlikely and that the virus will continue to circulate for some time to come.  It is likely not going to be any different in Canada.  The new normal will include precautions and some level of restrictions for some time to come - likely a few years.


Monday 26 April 2021

Thunder Bay City Finances Reporting Another Surplus


The City of Thunder Bay is now projecting a positive variance of $3 million for the 2021 budget year.  Despite the ongoing COVID-19 pandemic and its costs, the City of Thunder Bay is receiving more financial support than expected from both federal and provincial levels of government.  As well, policing costs as well as other expenses such as debt interest are coming in lower than expected.  If the assumptions underlying this budget update forecast come to pass, then for 2021, Thunder Bay will have its seventh consecutive positive budget variance making for accumulated variances of $17.1 million over seven years. 


Needless to say, this “good news” will be used to lend a positive vibe to discussions of spending more money on big capital projects such as a revised Multi-use Indoor Turf Facility project or the new proposed police facility.  After all, with City finances in such “good shape”, we can afford to spend more. Until next fall of course when the discussion will tilt to how we need to raise taxes 3-4 percent. It would appear that the budget spin in Thunder Bay changes from quarter to quarter depending on the need to support the needs and aspirations of the moment.


Positive variances are an odd term.  The term variance makes it sound like all that has happened is that the numbers they are getting now are somehow at “variance” with the original budget.  The degree of economic literacy in the general public and maybe amongst a few of the city councilors is such that they probably do not realize that a “positive variance” on the budget is not some type of COVID-19 hybrid spreading to the finances but rather than what it really is: a surplus.  What the city is really saying is that they either have or are projecting an operating surplus on the tax supported budget.  At three million dollars it is just about the size of the tax increase they brought in this year meaning that once again taxes came in much higher than if spending estimates were on the nose.


Of course, this is a COVID-19 year and a lot of unexpected things can happen.  Moreover, while having very large positive variances means that the tax rate levy that was imposed was again higher than it needed to be in 2021, one does not want municipalities to become spendthrifts and needlessly run down their reserves.  After all, it was not that long ago that negative variances were more of a concern as the accompanying figure illustrates.  As the numbers for the City of Thunder Bay show, negative variances used to be a problem but to its credit the city actually got a handle on its spending to the point where the financial leaks have been plugged.  Too bad, they could not solve the City’s ongoing leaky water pipe crisis too.


Municipal governments of course are not allowed to run deficits on operating expenditures by the provincial government, so deficits are covered out of reserve funds while surpluses can be used to augment reserve funds.  At the same time, many municipalities – Thunder Bay included – are now in the practice of running habitual surpluses funded out of tax increases that are often higher than they need to be. Enjoy the surplus. We are paying for it as ultimately it comes from taxpayers at either the local, provincial or federal level.

Monday 5 April 2021

COVID-19 Case Trends for Ontario and TBD: What a Difference A Month Makes

 Ontario appears to be firmly in the grip of a third wave of COVID-19 that is marked by the spread of the new and more infectious variants.  As Figure 1 illustrates,  and the trend line suggests we are going to surpass the peak of the second wave in terms of daily cases.  


Ontario has been reporting close to 3,000 cases a day for the last four days and it does not look to be anywhere near peaking.  On the other hand, the Thunder Bay District appears to have gotten its long second wave finally under control and as Figure 2 shows, the trend is now down.

A month ago, the trends seemed to be completely opposite.  At that time, the Thunder Bay District was trending up pretty rapidly while Ontario as a whole up until two weeks ago still seemed undecided as to whether it was going to trend up or down.  

Of course, Thunder Bay is probably only going to have a brief reprieve because new variants of COVID-19 do not appear to have gained a foothold in the district yet though they have been making an appearance both in the Northwest.  If you check this map provided by the Toronto Star - as of March 30th, Thunder Bay District still appears to be reporting 0 new variant COVID-19 cases whereas the Northwest Health District to our west is reporting 24% new variant cases and the Algoma to our east it is reporting 68 percent.  We are lagging for now but one suspects this is not going to last.  

The only possible salvation is if Thunder Bay District can get ahead of the new variants by vaccinating heavily.  Apparently, the Astra-Zeneca was available at pharmacies as of Saturday but I am not aware if any vaccines were given out during the long-weekend.  Whereas in Thunder Bay, it is normal to have your MRI scheduled at 3 in the morning because of demand and capacity constraints, it would appear that round the clock vaccination during a pandemic is not happening.  That is either because we are incapable of innovating or thinking fast enough or more likely - there is simply not enough vaccine to keep giving shots 24/7. As well, there have been now more than a few anecdotal stories emerging on how it is possible to get a vaccine at the end of the day if you know someone working there.  I suppose what else is new in Thunder Bay, Canada's biggest high school clique masquerading as a large urban center.

Without widespread vaccination quickly, the new variants will gain a foothold here too. Relying on people social distancing and following the rules is not happening. If you have been to a large retailer the last few days, watch how most people going in do not even bother to sanitize their hands.  Compliance with and enforcement of public health measures has been the problem all along in Thunder Bay and beyond.


Monday 15 March 2021

COVID-19 Case Count Developments Update: Ontario and Thunder Bay District

 Once a month is usually sufficient to provide an update of the COVID-19 case count numbers and associated trends but things are moving rapidly this month, especially in Thunder Bay, so an update mid-month is timely.  Today's daily case count was 1,268 for Ontario bringing the total up to 319,373 while for Thunder Bay there was an increase of 51 bringing the total count up to 2,390.  Figure 1 does the Ontario COVID-19 daily case count plot with LOWESS smooth for trend and it appears the downward trend has come to a halt with an uptick now being detected.  The new variants seem to be responsible for increasing case counts around the province and if they continue to gain hold we will have the third wave. However, the trend for deaths from COVID-19 remains on a downward path as illustrated in Figure 2. 


As for the Thunder Bay District, well based on Figure 3 we are still upward bound.  As our District Chief Medical Officer of Health has noted, the coronavirus is probably everywhere in Thunder Bay but that still has not blunted the public's enthusiasm for carrying on as usual if one is to judge street traffic levels as well as  store and mall parking lots over the last week.  The public's seeming lack of concern seems to be at odds with local public health officials and politicians.  The Mayor of Thunder Bay mid last week was on CBC Newsworld and making a case for Thunder Bay as a hot zone and the need for additional assistance including being included in the province's drug store pilot for AstraZeneca distribution.  

The only odd thing was that the Mayor's lobbying effort was a little late given that the program had already been effectively announced the previous week meaning the provincial planning for this had been in the works for some time.  Thunder Bay's case count ascent has been underway since January. One suspects that many variables go into the province designating hot zones (not that anyone is transparent and willing to reveal what they are)  and Thunder Bay is probably considered still a low "risk" because its spread is largely contained to itself given its relative isolation.  If a growing hot zone is adjacent to a large metropolitan center of millions of people, the problem has a different dimension.  Despite some remarks on social media that this is party politics at work, it is not.  It is geography.

In Ontario as cases start to mount and the new more contagious variants spread, it is becoming increasingly obvious that the only thing that will blunt this upsurge is widespread vaccination.  On the plus side, the vaccine delivery process is starting to ramp up but it is now a question of speed.  However, to vaccinate 14 million Ontario residents (with just one dose)  by the end of June requires that we dispense nearly 1 million shots a week.  This should not be a problem given that Ontario usually orders enough flu shots to vaccinate 30-40 percent of its population every year. In an average year 5-6 million flu shots are dispensed in just a few months.  It is not beyond the province's technical ability to effectively double that rate in an emergency.  Indeed, the Premier has stated that the province has the ability to administer 4.8 million vaccine shots a month. Yet it is currently running at about a quarter of that rate or about 300,000 shots a week because in the end you need a vaccine supply.

So here is the ultimate race.  The public is tired of following rules - not that they were ever particularly good at doing so aside for a few weeks last spring when they were actually terrified. As it became apparent that the result of getting COVID-19 for 90 percent of the population was a relatively mild illness, they have been doing their own interpretations of what social distancing and social gathering restrictions mean. At the same time, the virus has been evolving - while the public response has been devolving so to speak - and becoming more contagious so case counts are starting to rise again.  And the final element - the supply of vaccine - which is still not coming in quick enough and probably never will given that we do not have the capability to manufacture our own.

Friday 5 March 2021

Thunder Bay COVID Cases Trending Up Rapidly

Today's case count for the Thunder Bay District was 46, coming on top of 61 the day previous.  A LOWESS plot of the daily cases clearly show the steepness of the upward trend.  The Federal Health Minister this morning on CBC radio noted the situation in Thunder Bay is very serious and potentially exponential.  Given that exponential growth is a growth pattern that shows larger increases over time - that is the slope of a profile is getting steeper rather than diminishing - one might opine that we are probably already there.  The per capita new case count in Thunder Bay district is now the highest in the province.  When the plot is examined over the course of the year, Thunder Bay never really had a "first wave" and indeed its current wave occurs in two phases - a first one starting in November (circa Day 275) that in the end plateaued but never really subsided and a second one that begins to pick up speed the first week in January (circa Day 350) and has never really slowed down.  At present there are now 389 active cases and 35 hospitalized of whom 8 are in the ICU. Have a nice weekend.


Tuesday 23 February 2021

COVID-19 In Thunder Bay Skyrocketing

 Today's announced new COVID-19 case amount in Thunder Bay District stands at 41 bringing the total since the start of the pandemic to 1,418 and the current number of active cases is at 273.  The District's Chief Medical Officer has suggested that we could be headed back to lock-down though given that the surge over the last two weeks was obviously incubated during the last lock-down one wonders if it will matter.  The problem is apparently largely tied to an outbreak among the homeless population in Thunder Bay though given the crowds packing shopping malls and a local ski resort over the last week in the wake of the lifting of the lock-down, it is likely the surge is going to continue.  In addition, while the recent surge is tied to the city's homeless population, it remains that there have now been several good-sized outbreaks in local schools the biggest at McKellar Park.

This is a pretty grim situation.  We can draw only limited comfort from the fact that the total outbreak to date has resulted in a total case count per 100,000 population as of February 23rd still substantially below that of the province as a whole - at 971 cases per 100,000 versus 2003 cases per 100,000 for the province as illustrated in Figure 1.  However, while the provincial total finally seems to be flattening out a bit, Thunder Bay's appears to have picked up steam as Figure 2 illustrates more  clearly.  


Figure 2 plots plots the daily change in cases per 100,000 for both Ontario and the Thunder Bay District since the start of the pandemic and here one can more clearly see that since the start of January, we have been definitely bucking the provincial trend.  While Ontario actually began trending down starting the first week of January, that is when we began to move in the opposite direction.  One wonders aside from the shutting of businesses, how much compliance there really has been with requests to not socialize on the part of the general public in Thunder Bay.  


This is exceedingly worrisome because even if the surge to date is a result of close contact with some of the other outbreaks - such as those affecting the jail and correctional center - the fact that it appears to be spreading more broadly amongst both the homeless population as well as in the schools makes it ever more likely it will spread further.  The flouting of social distancing and safety protocols this last week at local big box stores and the mall as well as the gathering of hundreds outdoors at a local ski resort have merely provided further opportunities.  If cases spike even further over the next two weeks, it will be unlikely that we can rein things in.  After all, in terms of the current daily increases in cases per 100,000, we are at the peak that Ontario was at in early January and there is no evidence it is slowing down.

Friday 5 February 2021

COVID-19 Cases Trends: Where Next for Ontario and Thunder Bay?


The news on COVID infections in Ontario has become quite positive in recent days with counts showing a decline.  Indeed, as Figure 1 shows,there is a definite downwards slope to the daily count profile but we are still some distance away from the lows reached circa the first week of August when daily counts average about 100 per day.  Given the total number of current cases of 275,330, 100 cases per day constitutes a growth rate in cases of about 1/3 of one percent whereas it is currently about 15 times higher at 0.6 percent.  However, the apparent downward trend will start the call for a relaxation of restrictions.


Needless to say, there are reasons not to start relaxing restrictions given the spread of the more contagious new variants as well as some erratic performance of the numbers with widely shifting daily case counts as new reporting systems are implemented.  As well, as Figure 2 shows, deaths have yet to exhibit a substantial downward trend in Ontario.  


At the same time, the new unemployment numbers released today suggest that protracted lock downs come at a great economic cost.  However, the slow and reactive nature of Canadian governments to the pandemic has now put us in this place.   In the absence of substantial high rates of vaccination - given that Canada is lagging other countries substantially - as well as more available rapid testing that would allow business to test and isolate their staff -  it is difficult to see what the other options are?


As for Thunder Bay, well the daily case count trends there do not look too good.  As Figure 3 shows, we have gone up and still appear to be quite high.  While the majority of the recent cases have been confined to the institutional settings of the prison and correctional center, it remains that with the staff going back and forth to home and work and the release of some prisoners into the community, the potential for rapid community spread is still high.  


Needless to say, the move by the Mayor to declare a second state of emergency makes perfect sense given the need to isolate and protect vulnerable populations.  At the same time, the Mayor also called for relaxation of lock down restrictions for small business a few days before which appears somewhat inconsistent with what followed, but politicians are known for changing their minds.  Sometimes, it is even based on evidence.


Given its low population density and relative isolation, Thunder Bay should be able to create a reasonably good bubble.  However, as isolated as it is, it would appear that cases continually pop up and quite a few are linked to travel.  While it is true the number of cases directly linked to travel are small, it remains that those cases have spread the virus whether the case counts and testing catch it or not.  The best thing Thunder Bay and the District Health Unit could do right now is help the move to implement more rapid testing starting with everyone who gets off a plane at the Thunder Bay Airport.  


It would be more useful to catch them as they arrive rather than several weeks later with the subsequent announcement that someone on a flight tested positive.  Rapid testing services should also be provided to businesses and institutions that want to open up more generally.  As well, why not innovate a testing version of the "Ride" program?  The District Health Unit with a mobile van in conjunction with the Thunder Bay police should pick locations around town where continually shifting traffic stop points are set up.  Traffic stops would be conducted and the driver and passengers pulled aside and asked what "essential business they are up to" and then provided with a rapid test and must await the result in their vehicle.  Indeed, given there are limited ways to drive to Thunder Bay, the odd random checkpoint at the City limits might also be a good thing to try.


No doubt there will be many who argue that this is "authoritarian" and an infringement of "Freedoms." Okay. Make the rapid test voluntary if you want.  It can be declined. However, it is still an opportunity for health unit officials to stop and provide information and get the message out in a more direct way to a public that often still does not get it.  The inconvenience of being stopped in itself may make people think twice about going out for non-essential reasons and help slow transmission.


Monday 4 January 2021

COVID-19 in Ontario and Thunder Bay: The Bad News and Some Slightly Better News

 It is the New Year but the old year lingers on in full force as today's COVID-19 numbers for Ontario again topped 3,000.  We are now in the second wave of COVID-19 and it shows no signs of reaching a peak yet.  Indeed, as Figure 1 illustrates, the second wave dwarfs the first by far and at day 344 of the start of the pandemic in Ontario (based on the date of the first case) is still on a steep upward incline.  


 The somewhat better news for Ontario (Figure 2)  is that while deaths are also on an upward incline, they are not increasing as quickly as during the first wave and have yet to surpass the peak reached during the first wave.  However, given the number of cases and the extent to which the virus appears to have become ingrained in the population combined with the stubborn inability of many members of the public to accept the need for taking protective measures and social distancing, we are probably at best a few weeks away from a daily death toll of over 80 - last reached in late April/early May.  


As for Thunder Bay, the good news may be that a peak in terms of daily cases may have finally been reached. As Figure 3 shows, the LOWESS smooth does appear to be on a downward trend with the peak occurring nearly three weeks ago.  However, the down slope is slow and at the current trend it will take about another three weeks to get the daily count back down to close to zero - barring another super-spreader type event that kicked off the last upswing. The current surge in daily cases largely starts from the pickle ball and teen challenge events in November.  


One hopes that appropriate lessons have been learned.  So, there you have it.  Happy New Year.


Friday 20 November 2020

COVID-19 and Hospital Capacity in Ontario


This morning, Ontario reported 1,418 positive COVID-19 cases bringing the total to 100,790 cases to date.  Breaking the 100000-case ceiling will be seen as a milestone of sorts. Of these 100,790 cases, 84716 cases are considered resolved meaning that the number of active cases is currently 16,074.  Of these cases, 518 are presently in hospital with 142 of them in the ICU.  What this means is that of the current number of active cases, about 3.2 percent currently require hospitalization. 


Many Ontarians going about their daily lives have probably made similar calculations and concluded the risk of COVID-19 is small. Even if you catch it, they think the odds of requiring hospitalisation are slim and skewed towards an older or health compromised demographic.  Constant warnings to social distance and not engage in unnecessary social activities are going in one ear and out the other because most have concluded the risk of something bad happening is small.


However, the flip side of this behaviour is the potential of exponential increases in cases and, when combined with Ontario’s diminished hospital capacity, it is this where the real risks lie.  In 1990, Ontario had close to 35,000 acute care hospital beds and a population of 10.3 million people. By 2000, after a decade of fiscal crisis and “health care reform”, the number of acute care beds had declined dramatically to approximately 22,000 - about a 35 percent decline - and have remained practically constant at that level ever since.  However, by 2019, Ontario’s population had increased to 14.5 million – an increase of 41 percent while the population aged 65 and over had increased by over 70 percent.  As a result, acute care beds per capita in Ontario have declined to practically the lowest levels in Canada but in the OECD.  


While COVID-19 may appear manageable at current rates of new cases, if the number of active cases doubled every week, the system would rapidly be overwhelmed even if only 3.2 percent of active cases require hospitalization.  Here is the math:


Essentially, by Week 3 there would be crisis as nearly 10 percent of acute care beds in the hospitals would have to be given over to COVID cases – and this does not factor in any regional differences in severity of the active case count or the need for ICU beds.  By Week 5, essentially 40 percent of acute care beds would be needed for COVID and by this stage the system would not need to reach Week 6 to essentially collapse.  Having 1990 acute care bed numbers would help but only buy you a week or two.  And this is the result of only a doubling of active cases every week.  If cases tripled every week or they doubled in less time, the system would be overwhelmed even more quickly.


The average member of the public may think that only 3 percent of active cases needing to be hospitalized is a small number and with currently just under 1500 new cases a day it is not so bad.   So they carry on paying lip service to any rules and figure there are no consequences to their behavior.  Think again. 


Monday 16 November 2020

The COVID-19 Surge in Ontario and Thunder Bay District


The COVID-19 case count is surging in Ontario and is even affecting more remote parts of the province that saw a relatively mild first wave – such as the Thunder Bay District. It has been a while since I plotted my provincial and local numbers with trend and presented a visual update, so here it is. Figure 1 plots the daily number of cases in Ontario with a LOWESS smooth that highlights the trend.  The second wave of cases is as known already much larger than the first and is definitely poised to continue surging. Based on the trend line, one can easily expect to see 3,000 cases per day within three weeks which brings us the early December.  More ominous is the rise in death rates shown in Figure 2 and here while there is an upward trend, the second wave so far has seen a milder death toll than the first wave.  However, if one extrapolates that trend line, one could see the death toll hit the levels of the first wave in about three weeks also.  Needless to say, the trends are not pointing to a good place.


As for Thunder Bay,  one expects the smugness should be over but Thunder Bay is a stubborn place.  Many in Thunder Bay have been carrying on in their splendid isolationism as if they were somehow exempt from infectious spread given the low number of cases and only one death to date.  As Figure 3 shows, the District was largely spared during the first wave not so much by superior behavior but by geographic distance, low population density and good luck.   


The luck seems to have ended given the large number of close contact cases over the last week.  There has finally been a local super spreader event though the demographic affected at this point appears to be a younger one.  Whether this can be contained and spread to more vulnerable demographics prevented remains to be seen.  If nothing happens to curtail the current trend, at the current trend rate of increase, within three weeks one can expect 25 to 30 cases per day.  And, eventually there will be more deaths.

Thursday 12 November 2020

More Information Is Better: Too Bad Politicians Seem to Have a Double Standard


Several days ago, a member of Thunder Bay City council raised the issue of asking the Thunder Bay District Health Unit for a more detailed breakdown of location when it came to the reporting of COVID-19 cases.  In particular, the councilor in question wanted the numbers and cases just for Thunder Bay alone reported separate from its surrounding communities given that with a population of 109,000, there was no real way of ascertaining identities and he felt it would be helpful for residents to know.  While one might be tempted to conclude it was simply a slow evening at City Council, in fact this has become more of an issue in recent days given the spike in cases.


The councilor in question has a point.  At present, the TBDHU provides only the broadest of descriptions of where individuals reside and the circumstances around the exposure.  At the same time, the TBDHU has actually been announcing specific locations associated with outbreaks within the region when necessary – a case in point this week as 17 COVID-19 cases were connected to the Adult Teen and Challenge facilities in Thunder Bay. However, a breakdown of location to Thunder Bay, Thunder Bay Surrounding Area, District Communities and First Nation Communities does not appear to be a violation of privacy laws.  Moreover, when travel is mentioned as a source of the infection, it would be helpful to know if it was travel within northern Ontario, travel outside northern Ontario but within the province of Ontario, inter-provincial travel or international travel.


While the councilor’s call for more information is laudable, he is in some respects being inconsistent - to say the least.  After all, along with the COVID-19 pandemic underway, Thunder Bay is also experiencing a pandemic of plumbing and water line leaks which may be linked to the introduction of sodium hydroxide into city water in 2016 to mitigate lead.  Despite numerous pleas for assistance and information, the City of Thunder Bay has provided no information as to the extent of the problem, how many homes have been affected, or what neighborhoods are most affected.  Such information might help homeowners know if they are at greater risk of leaks than others and take mitigating steps but instead, we are all being left to social media to acquire information.  If the City of Thunder Bay was managing COVID-19 information in this manner, more people would die.


If the Thunder Bay District Health Unit in the face of mounting cases of infection refused to provide any information whatsoever, it would be seen as irresponsible and contributing to the spread of the disease and its mortality and morbidity.  However, in the case of pinhole leaks in Thunder Bay, the City is collecting information and shares nothing.  The councilor who raised the issue of more information from the District Health Unit has a double standard.  What is good for the goose is good for the gander and he should advocate for the people paying the taxes that support his role as a councilor. 


Monday 19 October 2020

Ranking Canada's COVID-19 Performance: It is Not as Pretty as We Like to Think


The IMF has released the October 2020 edition of its fiscal monitor and economic indicator numbers for world economies and its World Economic Outlook report titled “A Long and Difficult Ascent”  paints a pretty gruesome picture of the carnage wrought by the COVID-19 pandemic.  While the global economic growth outlook has improved somewhat from its June 2020 report, it is still projected at -4.4 percent and is surrounded by a fair amount of risk. 


However, in the end, performance is relative and what is more interesting is how different advanced economies are expected to fare in 2020.   Moreover, what is also of interest is their performance economically and fiscally relative to their pandemic performance – which certainly should be of interest to Canadians.   Polling results have often indicated that Canadians have largely approved of the way that their governments have responded to COVID-19 and an international ranking places Canada near the top of countries whose public thinks their country has handled COVID-19 well.  How justified is this perception by Canadians?


In understanding how well Canada has done dealing with COVID-19, one has to start with how Canada ranks in terms of the severity of the disease which in itself can indicate how good a job Canada has done in limiting its spread.  Figures 1 and 2 plot the ranked total number of COVID-19 cases per 1 million population and the deaths from COVID-19 per 1 million people as of October 17th (as taken from Worldometer) for 35 advanced economies as defined by the IMF.  Cases per 1 million ranged from highs of 32,914 and 25,083 for Israel and the United States to lows of 490 and 376 for Korea and New Zealand respectively.  COVID deaths per million people ranged from highs of 893 and 722 for Belgium and Spain (with the USA third at 675) to lows of 5 for both New Zealand and Singapore.  


Canada ranks 21st in total cases per million – putting it in the bottom half of incidence severity – but 10th highest in deaths per million population putting it in the top third.  So, while Canada was not hit as hard by infections compared to many countries, it was among those seeing higher death rates – largely because of its poor handling of the long-term care sector where over 80 percent of the deaths occurred.  While Canada is not the United States or Spain or Belgium in terms of the incidence and mortality of COVID-19, it is not Australia or New Zealand or Korea either. One might argue being an island helps but it did not help Cyprus or Malta that much.


How about the economic impact?  Figures 3 to 6 are based on the IMF October 2020 World Economic Outlook Report.  Figure 3 ranks the 35 advanced economies in terms of their projected 2020 real GDP growth rates and here Canada ranks 24 out of 35.  While everyone is going to see their economy shrink, some are going to be hit worse than others. Canada is basically at the top of the bottom third with an anticipated drop in real GDP for 2020 of -7.1 percent.  Overall, it is sandwiched between highs of -1.8 and -1.9 percent for Lithuania and Korea and lows of -10.6 and -12.8 for Italy and Spain. Figure 4 ranks these same countries according to their estimated 2020 unemployment rate and here Canada is an honorary Mediterranean country where at 9.7 percent it is coming 4th out of 35 countries – behind Greece, Spain and Italy.  And if one looks at the percentage point increase compared to 2019, Canada’s is a 4 percent point increase.  Based on Figure 5, we are the second worse increase of the 35 advanced countries, behind the Americans who are expected to see a 5.2 percent point rise in their unemployment rate. 


Of course, one might think that Canada’s somewhat mediocre performance relative to other advanced countries when it comes to the spread of COVID-19 and its mortality rate may simply be due to the fact that Canada has been a cheapskate in terms of its public spending compared to other countries.  And, by extension, perhaps our economic performance has been so much worse than other advanced economies because our federal and provincial governments have been captured by deficit scolds who have foisted restraint upon Canadians.  Well, put those notions to rest.  When the government deficit to GDP ratios for these advanced economies are ranked in Figure 6, it appears that Canada is finally number one in something – the size of its 2020 government deficit relative to GDP.  It is expected in 2020 to have the largest government deficit to GDP ratio of these 35 advanced economies registering at 19.7 percent. 


Once again, Canada has been spending a lot and seemingly getting relatively much less for its money.  True, we have not done as badly as some countries when it comes to the effects of COVID-19 on our population (unless you are a resident of a long-term care home) but our economy appears to have been fairly hard hit even with the many billions of support and assistance that have been funneled into it.  Why Canadians have to date been so charitable towards their federal and provincial governments when it comes to performance during the COVID-19 pandemic is a bit of a puzzle to me. Perhaps we just like to be nice.