Northern Economist 2.0

Tuesday, 4 August 2026

Thunder Bay, Sudbury and Ontario: More Crime Trends


Well, with so much data available in the recent releases of crime data from statistics Canada, another crime post is definitely in order especially as a way to mark the end of the civic holiday long weekend.  This time, a focus on Thunder Bay and Greater Sudbury with respect to trends over time given they are northern Ontario’s two largest metropolitan centers, along with a comparison to Ontario as a whole to put things in perspective.  Figure 1a presents the 2025 rates for both all-criminal code incidents (excluding traffic violations) as well as the violent crime rate for Thunder Bay, Greater Sudbury, and Ontario.  As Figure 1a shows, Thunder Bay is definitely experiencing higher police reported crime rates than either Greater Sudbury or Ontario as a whole. 


In 2025, Thunder Bay’s crime rate was 8,374 crimes per 100,000 population compared to 4,706 per 100,000 for Greater Sudbury and 4,297 per 100,000 for Ontario.  Thunder Bay’s crime rate in 2025 was 95 percent greater than Ontario and 10 percent more than Greater Sudbury.  In terms of violent crime, Thunder Bay’s rate was 2,249 per 100,000 compared to 1,177 for Greater Sudbury and 1,078 for Ontario. Violent crime in Thunder Bay in 2025 was109 percent greater than the Ontario rate whereas Greater Sudbury was 9 percent more. 

As well, Figure 1b shows the homicide rate in Thunder Bay for 2025 was 6.1 per 100,000 while in Sudbury it was 4.1 per 100,000 and only 1.3 per 100,000 in Ontario as a whole.  Needless to say, crime rates in Thunder Bay and Sudbury are above the rates for Ontario as a whole but Thunder Bay in general is double the Ontario rate while Sudbury is only about 10 percent more.  However, in terms of homicides, both cities were well above the Ontario rate in 2025 with Thunder Bay 369 percent greater than Ontario as a whole and Sudbury 215 percent greater.

Figure 2 presents a dual scale chart for Ontario with total crimes and violent crimes per 100,000 on the left vertical axis and the homicide rate per 100,000 on the right.  Observations for the three series are plotted from 1998 to 2025 with a linear trend fitted to each series.  If one looks at the three raw series, crime rates including violent crimes and homicides generally declined from 1998 to about 2014 and then started to rise.  Over that period, the crime rate in Ontario went from 7,019 per 100,000 to 3,549 per 100,000 while the violent crime rate declined from 1,222 to 789.  Homicides also fell from 1.4 to 1.2 per 100,000. However, since then, all have increased with the crime rate in 2025 reaching 4,297 per 100,000, violent crime reaching 1,078 and the homicide rate up to 1.3 per 100,000.  In terms of an overall trend, violent crime and total crime rates over the 1998 to 2025 period still trend downwards but the homicide rate in Ontario now shows a rising long-term trend.


Figures 3 and 4 present parallel charts for Thunder Bay and Greater Sudbury.  Both cities follow patterns similar to the rest of the province in that overall crime and violent crime rates decline from 1998 to 2014 and then start to rise with the overall linear trend being downward for the overall 1998 to 2025 period.  Both also show noticeable rising homicide rates over the long term and declining overall crime rates when a linear trend is fitted to the 1998 to 2025 data. In the case of violent crime over the 1998 to 2025 period, Thunder Bay shows a declining violent crime rate when the linear trend is fitted while Greater Sudbury shows a gently rising violent crime rate trend.


Nevertheless, crime is a matter of both level and trend when making comparisons so Figures 5 and 6 focus on the two most serious categories –violent crimes and homicides – to compare Thunder Bay, Greater Sudbury, and Ontario more directly.  Figure 5 presents the violent crime rates and shows that Thunder Bay and Ontario do indeed trend down while Greater Sudbury trends up over the 1998 to 2025 period.  However, when one looks at the gap between Thunder Bay, Sudbury and Ontario, based on the trends, it will be the end of the 21st century when Thunder Bay matches Sudbury’s violent crime rate while it looks like it will always be double the Ontario rate. 


Things look somewhat worse when it comes to the homicide rate (see figure 6).  Both Thunder Bay and Greater Sudbury have seen a major spike in their homicide rates since 2020 which has pulled their trend lines upwards.  However, Thunder Bay is definitely in a class of its own with a level of homicides as well as an upward trajectory that makes the homicide rates in Greater Sudbury and Ontario look modest by comparison.  However, it was not always so. Up until 2008, while homicide rates in both Greater Sudbury and Thunder Bay fluctuated around the Ontario numbers, they tended to parallel each other. Indeed, for the 1998 to 2008 period, the average annual homicide rate (per 100,000 population) in Thunder Bay was 1.4, Greater Sudbury 1.4, and for Ontario it was 1.5.  For the 2015 to 2025 period, the average homicide rate in Thunder Bay was 6.1 while for Greater Sudbury it was 2.2 and for Ontario 1.6.

Taken over the long run, Thunder Bay has always had generally higher crime rates than Ontario as a whole and the gap has been fairly consistent.  However, its reputation as Ontario’s “murder city” is a relatively recent phenomenon. Thunder Bay’s average homicide rates were not out of line with the rest of the province prior to 2008 and it has only been since then that homicide rates in Thunder Bay have soared. It is indeed an interesting question as to what factors are responsible for the increase since 2008.  What is it about the post 2008 period that makes that year in Thunder Bay such a break with the past when it comes to homicides? Sudbury has seen a similar type of spike in homicide rates since 2015 though it remains to be seen if that new upward trend will continue.  Given that this is a municipal election year in Ontario, these numbers should be an interesting focus for debate.

Tuesday, 6 January 2026

Recent Labour Force Performance: Thunder Bay and Sudbury


Welcome to 2026! While everyone is interested in what 2026 will bring economically, it is also important to review what the recent trends have been. While 2025 has been an economically tumultuous year for Canada, in the end the Canadian economy has performed more resiliently than one might have expected.  This is also the case in northern Ontario’s two main urban centres of Thunder Bay and Sudbury.  The accompanying figures plot monthly labour force data from Statistics Canada over the 2011 to 2025 period for the two cities for four variables: total employment, the unemployment rate, the labour force, and population aged over 15 years of age.


The most interesting development is when comparing pre and post pandemic employment levels (Figure 1) which suggests that there has been an upward trend in job creation in both cities since 2020.  It turns out that 2025 continued this trend with Thunder Bay going from about 66,200 to 69,100 jobs over the November 2024 to November 2025 period – an increase of 2,900 jobs or 4.4 percent. Over the same period, Sudbury saw an increase in employment from 90,400 to 94,800 – an increase of 4,400 jobs or 4.9 percent.  While Sudbury had relatively greater employment growth, interestingly enough, its unemployment rate in 2025 was higher than Thunder Bay’s (Figure 2). By the end of 2025, Thunder Bay’s unemployment rate was just under 5 percent while Sudbury’s was nearly 7 percent. 


The reasons for this is that compared to Thunder Bay, Sudbury had a faster rate of both labour force and population growth in 2025 (Figure 3 and 4) relative to jobs created. Sudbury’s working age population in 2025 grew nearly 2 percent, while its labour force grew just over 6 percent.  On the other hand, Thunder Bay's  population growth in 2025 remain flat after several years of growth while its labour force nevertheless rose 4.5 percent as participation rates increased. 


Needless to say, both Thunder Bay and Sudbury did quite well in 2025 when it comes to employment creation and this naturally bodes well for the coming year.  While northern Ontario’s economy still faces challenges going into the new year as a result of the continuing economic adjustment to a more tariff prone United States (Sault Ste. Marie and its steel industry comes to mind), its resilience so far bodes well for the future.  It is important that the region remains alert and on guard to take advantage of new opportunities as they emerge.


Sunday, 24 August 2025

Charting CMA Population Growth in Canada


The news that the Greater Sudbury CMA is poised to reach 200,000 people much sooner rather than later highlights how Canada’s recent population surge has begun to permeate even regions and cities that for years have seen rather lack luster population and economic growth. In the case of Sudbury, the city’s Mayor has made it his goal to grow the city-region’s population to 200,000 by 2050 and given that it is 2025 and population seems to be over 190,000, it is apparent the Mayor may still be in office by the time the goal is reached and thus able to personally celebrat the achievement. 

Meanwhile, Thunder Bay has embarked on a “Smart Growth” Plan that among other things also seeks to attract new residents and population though it has not set a goal for population. Such goals and forecasts are dangerous given that the urban renewal schemes of the 1960s forecast that Thunder Bay (The Lakehead) was going to hit 186,000 people by the 1980s. Yet, even in Thunder Bay, the news is that population growth has been higher than anticipated in recent years with international migration boosting the population of the CMA to over 130,000.

All the optimism for growth in Northern Ontario’s two major urban areas is a cause for celebration given what have been decades of low expectations and performance.  At the same time, one needs to place the recent performance of northern Ontario’s premiere cities into comparative context.  When one looks at the growth of population of Greater Sudbury, and Thunder Bay relative to other Canadian CMAs, the results suggest that even when growth picks up, the lag abides.


Population data for Canada’s CMAs from Statistics Canada is used to plot several charts to provide some context for the last statement.  Figure 1 plots Canada’s population by ranked CMA in 2001 but by the current number of CMAs which have increased since that year (for example, Red Deer, Drummondville, Nanaimo, Kamloops and Chilliwack were not CMAs in 2001 but have since grown to over 100,000 people). Not surprisingly, Toronto, Montreal and Vancouver were the top three CMAs at 4.9, 3.6 and 2.1 million people respectively. Of the forty CMAs shown in Figure 1, Greater Sudbury ranked 21st out of 40 with 164,210 people while Thunder Bay ranked 31st.  Below Thunder Bay were Moncton, Peterborough, Bellville, Kamloops, Lethbridge, Nanaimo, Drummondville, Chilliwack and Red Deer. 


Fast forward to 2024 and Figure 2. In 2024, Toronto, Montreal and Vancouver were still the three largest CMAs at 7.1, 4.6 and 3.1 million people respectively.  Greater Sudbury, even with nearly 192,000 people, had fallen to 25th place while Thunder Bay with 133,000 had fallen to 34th place out of 40.  Figure 3 plots the percent growth in population from 2001 to 2024 for these 40 CMAs and here the evidence shows that population growth was the highest in Calgary, Edmonton, Kelowna, Red Deer and Chilliwack with growth ranging from a high of 82 percent for Calgary to a low of 59 percent for Chilliwack. In terms of growth rates, Greater Sudbury grew 17 percent putting it in 37th place in terms of population growth while Thunder Bay at 5 percent growth came 39th out of 40th.  While second last place in the population growth sweepstakes is better than last – the honour which went to Saguenay – it was not a sterling performance.  


On the plus side all CMAs saw growth from 2001 to 2024 but in the end it is both growth per se as well as relative growth that matters if you are seeking to promote a growth agenda.  Of course, the key question is why Thunder Bay (and even Sudbury) have continued to do so poorly when it comes to the relative population growth sweepstakes.  Bear in mind that population growth per se is only one indicator of economic performance and the presence of economic opportunity.  Rising per capita incomes and by extension individual economic welfare require the economy to grow faster than population.  Thunder Bay and Greater Sudbury have done somewhat better in terms of per capita income growth.  For example, out of 64 major Ontario communities ranked by CMHC, Thunder Bay and Sudbury rank 41st and  21st  respectively in terms of average household income before taxes placing them closer to the middle of the distribution.

Still, despite the celebration of recent population and urban growth, it remains that Greater Sudbury and Thunder Bay are at the bottom in terms of their population growth when it comes to wider comparisons with the rest of Canada. And even worse, Sudbury’s population growth rate since 2001 has been three times that of Thunder Bay at 17 versus 5 percent. Thunder Bay appears to have been particularly afflicted by low overall growth both in terms of its economy and its population and the question is why?  Is it a function of remoteness?  Likely not as many of these CMAs have as many locational disadvantages as Thunder Bay which likes to boast it is in the middle of the country at the confluence of major transport links. Is it the absence of resources or skilled labour?  Again, likely not given its location in the mineral and forest rich shield and the presence of both a community college and university in the community.  

This leads to another factor – institutions, or the arrangements that people have for dealing with one another.  What is it about Thunder Bay in terms of the environment of the community both in terms of local culture and governance that may be militating against growth?  I would argue that it is the absence of competitive behaviour and the prevalence of monopoly that has most stifled the city’s economic growth and development.  In this regard, Thunder Bay is a microcosm of what ails Canada as a whole – a country that has long tolerated monopolies and oligopolies in its economic fabric as manifested in its banking, telecommunication, transport and retail sectors.

In Thunder Bay, this type of non-competitive behaviour that often seeks to block entry of new firms through lengthy approval processes has been compounded by a monopoly municipal government in the wake of amalgamation that has also effectivelt stifled local initiative and innovation (it is no coincidence economic growth in the city dramatically slowed after the merger of the ultra competititve cities of Port Arthur and Fort William in 1970) and a growing reliance on the public sector as the main driver of activity.  If one looks at Thunder Bay, one third of the population essentially works for the public sector and one third is retired or not working and deriving the bulk of its income from some sort of public sector pension.  The remaining third is your private sector and even they are essentially tailoring their businesses to attracting the spending of either the public sector directly via public sector construction projects and contracts or those who derive their incomes from public sector pensions.   With the taxpayer footing the bill in one form or another, there is little incentive for competitive behaviour even in the local private sector and their captive market often results in cost overruns especially on public sector projects.

Needless to say, it is amazing that Thunder Bay's population has grown as much as it has.

Wednesday, 15 January 2025

Housing Starts: Sudbury and Thunder Bay

Housing availability and affordability remain amongst the most pressing issues in current public policy and the north's major urban centers are no exception given the rise in the average price of housing as well as rents.  In response to provincial and federal incentives, both Greater Sudbury and Thunder Bay have seen a ramping up of housing activity.  By late  2024, Thunder Bay had issued 310 building permits and 241 shovel ready housing starts were in progress and as a result had exceeded the housing targets set for 2024.  Greater Sudbury has also seen an increase in housing activity with 2023 the strongest year in a five year period and by late 2024 had seen 610 housing starts of which nearly two thirds were rental units.

For both communities, 2024 marks a departure from recent performance given that Statistics Canada data suggests that for 2023, total housing starts were 263 in Greater Sudbury and 193 in Thunder Bay.  However, as impressive as the current ramping up may be, a glance at historical performance suggests that there is still a ways to go if current construction efforts are able to match those of yesteryear.  Figure 1 plots annual total housing starts from Statistics Canada (Series v42127460 andv42127445)  for Greater Sudbury and Thunder Bay from 1972 to 2023 and for both communities recent housing start total are nowhere near the peaks achieved in either the 1970s or 1980s.  Over the 1972 to 2023 period, Thunder Bay's peak was 1,620 housing starts in 1977 while Sudbury's best year was 1991 when it saw 1,758 housing starts.  


The period since 2000 is particularly flat for Thunder Bay with the best year being 2012 which saw 380 housing starts while Greater Sudbury peaked in 2011 at 595 starts.  And while the 1980s and 1990s were marked by stagnant population growth rates, the period since 2000 has seen some population growth (See Figure 2, Data source: Statistics Canada).  Between 2001 and 2023, Greater Sudbury grew  from 165,532 people to 185,230 - an increase of nearly 12 percent.  Thunder Bay has not done as well on the population growth front but nevertheless still grew by 3 percent of the last period.  A larger population but lower housing starts relative to the past means that population adjusted housing starts remain lackluster relative to even the recent past since 2000.  In 2012, for example, Thunder Bay managed 300 starts per 100,000 population while in 2011, Greater Sudbury was at just over 350 starts per 100,000.  By comparison, 2023 saw both communities at just under 150 starts per 100,000 population.  While 2024 was better even on a population adjusted basis, it remains that neither community appears able to construct at rates approaching those of the 1970s and 1980s.  


This is of course not just a northern Ontario affliction.  In Canada as a whole but Ontario in particular, the last 50 years have seen an increase in assorted regulations and requirements that make rapid project approvals and construction harder to do.  And, new homes built today - with the exception of apartment and condo units - at least anecdotally, often seem to be larger than they were in the past which all things given could also take more time.  Combined with higher land prices, it is understandable that construction today is likely not to approach the rates of the 1970s.   Then there is the fact that populations were much younger in the 1970s and 1980s meaning that labour was more abundant compared to shortages today especially in areas like skilled trades.   The result is a definite slowdown in our ability to meet both demand and need.

Wednesday, 22 March 2023

Thunder Bay and Sudbury: A Tale of Two Economies


The Conference Board of Canada has issued its March 2023 Metropolitan outlooks for Thunder Bay and Greater Sudbury and the immediate news looks good for Thunder Bay.  As a result of the construction of a new provincial jail in Thunder Bay over the new two years, Thunder Bay is expected to see its real GDP grow 3.6 percent in 2023 making it number 1 out of 24 comparable CMAs for economic growth.  On the other hand, Sudbury at only 1.4 percent projected growth for 2023 is still doing well and expected to rank 12th out of the same 24 CMAs.  Sudbury is doing well as a result of expected persistence of demand for nickel given the growth of the electric car industry. In terms of how Thunder Bay and Sudbury will fare in the longer term based on these economic drivers, the Conference Board projects that Sudbury will see some continued growth particularly in employment but Thunder Bay after the construction boom is expected to falter somewhat given the absence of a more robust long-term driver. 


Figures 1 and 2 plot both real GDP growth and employment growth for Thunder Bay, Sudbury and Ontario as presented by the Conference Board reports.  While 2023 sees Thunder Bay surpass both Ontario and Sudbury for growth, for the 2024 to 2027 period, Sudbury sees real GDP growth stay at about 1.5 percent while Thunder Bay falls to just over one-half of one percent.  Despite the anticipated slowdown in 2023, Ontario real GDP growth recovers to an average of over 2 percent for 2024-27. In terms of employment growth, Thunder Bay sees a surge to a 4 percent growth in jobs created for 2024 but eventually sees employment shrink moving into 2025 to 2027.  While Sudbury also is expected to see lower employment growth moving forward, it remains positive to 2027.


And finally, Figure 3 provides a retrospective on local investment spending for the two cities in terms of the value of building permits from 2014 to 2021.  Fluctuations notwithstanding, the long-term trend up to 2021 has been slightly positive for Sudbury, and slightly negative for Thunder Bay. Going forward, housing starts are an important component of building permits, and the provincial and federal budgets are expected to see some initiatives for boosting housing spending.  The Conference Board is forecasting that total housing starts in Thunder Bay will fall from 193 units in 2021 to 161 in 2023 but then start to increase reaching 237 by 2027.  Sudbury is expected to follow a similar pattern declining from 434 starts in 2021 to 269 by 2023 but then recovering to 301 by 2027.


Both communities have aging populations which in the absence of economic opportunities attracting large scale immigration means that investment, employment, and real GDP growth in the long term will lag the rest of the province. One potential game changer is of course in the area of mining for both communities given the global demand for critical minerals and the expected development of the Ring of Fire.  Tomorrow’s provincial budget may provide a glimpse of what might happen there in terms of infrastructure spending.

Thursday, 13 January 2022

2021 Census Updates Out: Since 2016, Sudbury Up 2.2 Percent, Thunder Bay Up 0.3 Percent

A very quick post. So, the 2021 census population numbers are finally out from Statistics Canada along with updates for the entire 2001 to 2021 period. I have been waiting for these numbers for some time to see how Thunder Bay and Sudbury have done and the results are interesting.  Since 2016, Sudbury CMA has seen a population increase from 169,136 to 172,781 - an increase of 2.2 percent.  Indeed, Sudbury has seen a pretty steady increase in population since 2001 going from 164,210 in 2001 to 172,781 - an increase of 5.2 percent.  Thunder Bay CMA went from 126,696 in 2001 to 124,840 by 2016 before rebounding to 125,247 by 2021.  However, since 2001, Thunder Bay CMA  has actually declined by just over 1 percent.  Staring in 2016, there has been a tiny rebound equivalent to about one third of one percent.  Thunder Bay saw a major decline from 2004 to 2016 followed by a rebound that appears to have ended starting 2020. It would appear that the pandemic year has seen a bit of an exodus from Thunder Bay. So, from 2016 to 2021, Sudbury is up 2.2 percent and Thunder Bay 0.3 percent. So, there you have it.


Tuesday, 23 July 2019

Crime Statistics Update 2018: Thunder Bay Crime Rate Down 6 Percent


The Police-reported crime statistics for 2018 from Statistics Canada are out.  The police reported crime statistics provide both the crime rates and the crime severity index as well as more specific data on things like the homicide rate.  According to the report, police-reported crime in Canada, as measured by both the crime rate and the Crime Severity Index (CSI), increased for the fourth consecutive year in 2018, growing by 2%. Despite the increase, the CSI was 17% lower in 2018 than a decade earlier. Indeed, over the period 1998 to 2014, the crime severity index in Canada fell rather dramatically – dropping by about 44 percent - but has now started to rise.

The CSI increased in two-thirds of Canada's largest census metropolitan areas in 2018, with the largest increases in Windsor (+21%), Moncton (+15%) and St. Catharines–Niagara (+15%). Breaking and entering was an important contributor to the increases in Windsor and St. Catharines–Niagara, while fraud was an important contributor to the increases in Moncton and Windsor. The largest decreases in the CSI were in Belleville (-20%), Saguenay (-12%) and Peterborough (-10%). 


The value of the CSI was highest in Lethbridge at 137, followed by Regina at 126.6 and then Winnipeg at 119.4.  Thunder Bay ranked 8th out of 35 on the level of crime as measured by the CSI index (See Figure 1) while Greater Sudbury ranked 14th.  In terms of changes, Thunder Bay and Sudbury both registered an increase in the CSI in 2018 at 9 and 5 percent respectively (See Figure 2) with Thunder Bay reporting the 9th largest increase and Sudbury the 17th.  Driving Thunder Bay’s increase in the CSI were increases in breaking and entering; robbery; fraud; trafficking, production and distribution of cannabis (pre-legalization); attempted murder; and homicide.  As for Sudbury, the increase was driven by Increase in breaking and entering, and sexual assault; and partially offset by decrease in child pornography.


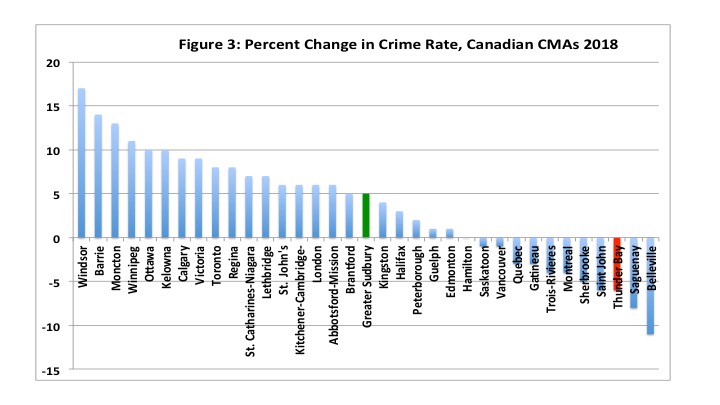
However, when the increase in crime is reported using the traditional crime rate (which measures total reported crimes per 100,000 population without any weighting) Thunder Bay actually registered a decrease in reported crime (See Figure 3) while Sudbury registered an increase.  Indeed, Thunder Bay registered the third largest decrease in crime rates of these 35 CMAs at -6 percent while Sudbury was up 5 percent.  However, at 8 homicides in 2018, Thunder Bay still ranked first in the homicide rate amongst Canadian CMAs coming in at 6.38 per 100,000 of population.  Greater Sudbury comes in at 0.59 per 100,000 – one of the lowest homicide rates in the country.  Barrie was the lowest in 2018 coming in at 0 homicdes.  Brantford, came in as the second-highest this year with a rate of 3.36 homicdes per 100,000 followed by Regina at 3.1.  

So the long and short for Thunder Bay this year is that crime rates are down but the severity is high.


Sunday, 10 March 2019

Some Recent Posts, Activities and Other Musings

Along with Northern Economist, I also contribute to two other blogs - the Fraser Institute and Worthwhile Canadian Initiative.  I try to post material related in some way to Northern Ontario on this blog - albeit with a fair number of exceptions.  My posts on the other two blogs tend to be almost exclusively on either provincial, national or international economic issues and often with a strong economic history bent.

I just did a post on Worthwhile Canadian Initiative comparing the most recent employment numbers to what transpired in the early 1980s.  The inspiration for this was a number of media reports that gushed positively to no end about how well employment was performing and that there was plenty of steam left in Canada's economy.  Indeed, a number of stories noted that Canada's January-February employment growth in 2019 was the best since the same two months on 1981.  Of course, all of these stories neglected to add what happened after February 1981 which was one of the most severe recessions in the postwar period that saw unemployment rates peak at nearly 13 percent.  For this post, click here.

And then there are my last two posts on the Fraser Institute blog.  As part of the lead up to the March 19th Federal Budget, I take a look at federal government finances and note that large deficits are on track until 2022-23.  A key point is that there has not been a revenue slowdown.  While these deficits might be understandable during a recession or as part of a strategic investment mandate, it is not really the case here.  It is just more spending.  For this post, click here.

Finally, a post on the evolution of the United States federal debt looks at the the contribution to the debt to GDP ratio ranked by president all the way back to George Washington who incidentally was pretty good at fiscal management given the hand he was dealt in the wake of the American Revolution.  Overall, wartime presidents have seen the largest increases in their debt to GDP ratios with Franklin Roosevelt and Woodrow Wilson topping the ranking.  For this post, click here.

Overall, it has been a pretty busy time between blogging, the occasional media interview (did The Current in December with an interview after Stanley Fischer) working on research papers in health and historic wealth inequality, public presentations - did Port Arthur Rotary in November and on the books for Fort William Rotary in April - and other assorted research projects.  Of course there is never enough time to do everything and my historical projects on Lakehead Port Statistics pre-1950 and constructing a fiscal series for Ontario pre-1960 are going to take a lot longer than anticipated...

In other news, I am off on some travels this month.  Have a trip to Regina coming to visit their Economic Department and I will be heading off  to Sudbury and Laurentian University next week for a couple of presentations during their Research Week. My first presentation is a paper co-authored with Rob Petrunia (Lakehead) as follows:

Monday March 18th: 1:00 – 2:35 pm Economic Inequality and Crime Rates in Canada (Governors’ Lounge, 11th floor, R.D. Parker Building)The Department of Economics will present a talk by Dr. Livio Di Matteo (professor of Economics at Lakehead University) on a critical issue in an age of globalization and technological change: the rising trend in income and wealth inequality and its adverse social effects.

My second presentation is titled "Arrested Development: Northern Ontario's Economy in the Past, Present and Future and is part of the following session:

Tuesday March 19th: 10:00 – 11:30 am The Economy of Northern Ontario: Structural Changes and Implications for the Labour Market( Governors’ Lounge, 11th floor, R.D. Parker Building)The Department of Economics will present a seminar on the changing economic landscape and the effects of long-term structural changes on the labour market of Northern Ontario

The latter talk with be a pretty expansive overview of the history of Northern Ontario's economy in terms of its development, the host of government initiatives and plans over the decades, what has worked or not worked, and thoughts about the future.

If you are in Sudbury for Research Week, feel free to attend!


Monday, 27 August 2018

Northern Ontario Economic Forecasts: Conference Board Forecasts Slower Growth for Thunder Bay and Sudbury


The Conference Board of Canada recently put out its Summer 2018 Metropolitan Outlooks for Thunder Bay and Greater Sudbury.  Greater Sudbury’s real GDP growth is expected to be 1.2 percent in 2018 and 1.1 percent in 2019 while its employment growth will be  -0.4 per cent in 2018 and rise 1.1 percent in 2019.  Meanwhile, Sudbury’s unemployment rate will rise from 6.7 per cent in 2017 to 7.0 per cent for 2018, before falling to 6.6 per cent next year.  Thunder Bay’s real GDP is expected to grow 1.2 percent in 2018 and 1 percent in 2019 with employment expected to rise 2.2 percent in 2018 but fall -0.7 percent in 2019.  The unemployment rate is expected to be lower than Sudbury’s at 5.1 percent in 2018 compared to 5.6 percent in 2017 but is expected to be 5.4 percent in 2019.

As the accompanying figures show, Thunder Bay and Sudbury have been growing more slowly and are expected to grow more slowly than Canada or Ontario.  Sudbury’s economy has been described as “unsettled” with a steady string of employment losses over the last few years.  Its primary hope is the current rebound in nickel prices given the employment losses have been hitting its mining sector.  


Thunder Bay saw a very good employment growth performance in 2017 that basically helped recover from the 3 percent drop in 2015 – its economy currently can be characterized as “moderate expansion.”  What seems to be driving things at the moment in Thunder Bay s a stronger construction sector with numerous small non-residential projects as residential demand is weak.  Indeed, the housing forecast for 2018 is 155 units – the lowest number of starts in 15 years.  As well, there has been some upturn in manufacturing and transportation.  

So, moving forward.  It appears that both Canada and Ontario are expected to see slower rates of economic growth moving towards 2020 with Thunder Bay and Sudbury even lower.  In terms of employment growth, Sudbury’s recent string of low employment growth is expected to end in 2019 if nickel prices continue their rebound while Thunder Bay in 2019 is expected to see negative employment growth again before resuming growth.  Thunder Bay’s economy has been performing marginally better than Sudbury’s recently as it is somewhat more diversified as in 2017 it had a higher economic structure diversity score of 0.78 compared to Sudbury’s 0.71.

Wednesday, 9 May 2018

Renting in Northern Ontario-You Are Richer Than You Think


When it comes to housing markets, what gets the most attention is the affordability of single detached homes particularly in large urban centres like Toronto and Vancouver.  However, the high price of housing has boiled over into rental markets and it turns out that more Canadians are now renting than ever before.  Over half of the new households formed since 2011 are apparently renting and the greater demand is being reflected in higher rents.

So, what are rents like in the five major northern Ontario cities? Figures 1 and 2 plot the monthly rent for one and two-bedroom apartments in major northern Ontario cities from 1992 to 2017 using data from Statistics Canada.  In 1992, rent for a one-bedroom was the highest in North Bay at $510 monthly and lowest in Timmins at $451 while for a two-bedroom it was highest in Thunder Bay at $620 and lowest in Timmins at $565.  By 2017, monthly rent for a one-bedroom was highest in Sudbury at $848 followed by Thunder Bay at $779. For a two-bedroom in 2017 Sudbury was the highest at $1058 followed again by Thunder Bay at $957.


Over the period 1992 to 2017, the annual average growth rate in rents for a one-bedroom was 2.4 percent in Sudbury, 1.9 percent in Thunder Bay, 1.6 percent in North Bay, 1.8 percent in the Sault and 2.2 percent in Timmins.  Over the same period, for two-bedroom apartments, the average growth rate was 2.4 percent in Sudbury, 1.8 percent in Thunder Bay, 1.9 percent in North Bay, 1.9 percent in the Sault and 2.1 percent in Timmins. Indeed, these increases are pretty close to the inflation rate as measured by the CPI.

The results are informative – rents have gone up in all northern Ontario cities - but the pace of increase picked up after 2004.  The average annual growth rate for one-bedroom apartments in these five cities was 2 percent from 1992 to 2004 and 3 percent from 2004 to 2017. For Greater Sudbury, rent growth was especially pronounced from 2004 to 2017 with an annual average growth rate of 3.5 percent for both one and two-bedrooms.   Thunder Bay in comparison saw average annual growth of 2.5 percent for one-bedrooms and 2.6 percent for two-bedrooms.   However, this period saw Sudbury with a mining boom whereas Thunder Bay experienced the forest sector crisis.

The higher growth rates in rent since 2004 coincide with the run-up in housing prices over the same period.  Even with rent controls, as new tenants come into a rental unit, there is the opportunity to raise the rent to reflect market conditions and the market is getting tighter. As all first year economics students can tell you, the long-term impact of rent control policies is to reduce the stock of units below what they would have been.  As a result, with rising demand, rents have climbed.

However, rents in Thunder Bay and Sudbury are still quite a bit lower than Toronto based on the numbers here.  In 2017, a one-bedroom in Toronto rents out at $1194 – 41 percent more than Sudbury and 53 percent more than Thunder Bay.  A two-bedroom in Toronto in 2017 rents out at $1403 – 33 percent more than Sudbury and 47 percent more than Thunder Bay.  According to the Winter 2018 Conference Board CMA reports, in 2017, household income per capita in Toronto $47,548 compared to $48,742 in Greater Sudbury and $47,287 in Thunder Bay.  Given that average incomes in Toronto are not really that much higher than either Thunder Bay or Sudbury it stands to reason that after paying your rent you will  have a lot more disposable income left over in Thunder Bay and Sudbury relative to Toronto. This really should be getting greater play in the economic marketing of these two cities.

Thursday, 15 February 2018

Population Growth Results: Thunder Bay and Sudbury at the Bottom


Statistics Canada has released its recent sub-provincial population estimates for 2016/17 and the results find that population is still growing faster in the Prairies well as parts of Ontario but the two major northern Ontario CMAs are not in the pack.   According the Statistics Canada, the 10 CMAs with the highest population growth in 2016/2017 were in either the Prairies or Ontario. In 2016/2017, the population growth rate was 2.0% or higher in four CMAs: Saskatoon (+2.8%), Regina (+2.4%), Guelph (+2.2%) and Ottawa–Gatineau (Ontario part) (+2.2 and were followed by Toronto (+1.9%), Oshawa, Winnipeg, Edmonton and Calgary (+1.8% each), and Kitchener–Cambridge–Waterloo (+1.7%).  The figure below shows the picture pretty clearly.


At the bottom of the rankings are Sudbury, Thunder Bay and Saguenay.  Sudbury is third from the bottom with a population increase of only 0.1 percent.  The population decreased in the Saguenay (-0.2%) and Thunder Bay (-0.1%) CMAs for the fourth consecutive year with Saguenay’s population decrease partly attributable to out-migration of young adults aged 18 to live elsewhere in Quebec. In Thunder Bay, the number of deaths surpassed the number of births, and has done so since 2006/2007, contributing to its population decline. 


Thursday, 25 January 2018

Economics News Around the North: January 25th Edition

Here are the economic news stories that have caught my interest over the last little while in northern Ontario.  The start of the new year has been a bit slow when it comes to economic news in the region but then there is so much else going one politically, economically and otherwise in Ontario, Canada and the world especially as we move into a critical phase with the NAFTA negotiations and the start of election campaigning in Ontario in the run up to the June election.

Here goes....

Architect envisions creative solutions to re imagine existing buildings. TBNewwatch, January 24th.

Well, this looks like a creative way to try and create some type of downtown event centre/conference facility in Thunder Bay.  Of course, you can add Victoriaville as well as the empty Sears store at intercity to the list of underutilized space in Thunder Bay.  Personally, it would be nice to see the Sears store retooled in a circular two level galleria space of small stores around a public space that could be used to house the farmers market.  The only problem would be to find tenants for the small retail spaces given that rents at the ISC are apparently pretty steep.

Record year for airport. The Chronicle Journal, January 25th

The airport's economic role in the city of Thunder Bay and region continues to grow.  Passenger volumes in 2017 were 844,627 which represents an increase of 4.6 percent from 2016.  Since 1997, this represents an increase of over 60 percent.

In not so positive transportation news, cab fares in Thunder Bay are going up by 15 percent. They were already quite high.  And if that is not enough, it looks like the increase in Thunder Bay's tax levy is going to stay at around 3.6 percent as the budget remains pretty much unchanged.  Living in Thunder Bay does sometimes seem like a sort of reverse Walmart marketing jingle - pay more, get less.

On the bright side:

Getting more out of wood. The Chronicle Journal, January 23rd.

More federal funding to support initiatives in the bio-economy.

Conference explores growing economy. Sudburystar.com. January 7th, 2018.

On Feb. 6-7, the Greater Sudbury Chamber of Commerce will host its inaugural PEP (Procurement, Employment and Partnerships) conference and trade show presented by SNC Lavalin in partnership with the Canadian council for Aboriginal Business.

And of interest if you are planning to pursue resource development activities in the region North of 50....

Northern communities face threat of climate change. TimminsPress.com, January 24th.

Meanwhile, in the Sault....

New Sault company aims to create jobs, produce gadgets for all ages at soon-to-open shop. SooToday.com, January 23rd.

Of course, Sault Ste. Marie is disappointed that they did not make the 20 city short list for Amazon's second corporate campus and joins other disappointed Canadian cities, but not Toronto which remains under consideration. 

In North Bay, they are hoping home construction is going to jump start their economy.  Not sure where the housing demand is expected to come from but it is important to be hopeful.  Perhaps if Toronto gets the Amazon campus, given the cost of housing, Amazon workers will live in North Bay and commute to Toronto.

North Bay community is up to housing-construction challenge. North Bay Business Journal. Jan 2nd.

So that is what has caught my eye across this vast expanse at least economically.  One other bright item of news involves this morning's decision in a Thunder Bay courtroom exonerating the Chief of Police. Great to hear. All the best.

Sunday, 14 January 2018

Policing Resources and Costs in Northern Ontario: A Brief Municipal Comparison


Municipal budget season is upon us and expenditures on protection – police and fire – are some of the most important areas in which municipal tax dollars are spent. Municipal police services have the responsibility of ensuring the security of residents, businesses and visitors to their communities and the basic activities are crime prevention, enforcement of laws, maintaining public order,  assisting the victims of crime as well as emergency services.  Over the years, policing has become more complex dealing with new types of criminal activity in the cyber age as well as devoting more resources to social concerns.

One interesting point of comparison for the five major northern Ontario cities is the number of police officers per 100,000 of population and the trend in this number over time.  Figure 1 plots Statistics Canada data on police officers per 100,000 for the period 2000 to 2016.  In 2000, the largest number of police offers adjusted for population was in Thunder Bay at 171.6, followed by Sault Ste Marie at 156, Timmins at 153.1, North Bay at 147.6 and finally Greater Sudbury at 143.1.  By 2016, Thunder Bay was still first at 199.5 officers per 100,000 of population.  It was followed by Timmins at 196.2, Sault Ste Marie at 176.7, Greater Sudbury at 160.7 and then North Bay at 152.6.   

 
As Figure 2 illustrates, growth in per capita policing numbers was greatest in Timmins at 28 percent, followed by Thunder Bay which saw a 16 percent increases.  Next highest growth was Sault Ste Marie at 13 percent, followed by Greater Sudbury and North Bay at 12 and 3 percent respectively.


Another point of comparison is spending. The BMA Municipal Reports provide some data on the costs of providing policing services. The rankings for costs generally parallel those for police numbers. When the net costs per 100,000 dollars of assessment are compared (including amortization), in 2016 the highest cost was in Timmins at $441 per $100,000 of tax assessment followed by Thunder Bay at $434. Next was Sault Ste Marie at $402, then North Bay at $317 and finally Greater Sudbury at $299.  Naturally, this ranking is influenced by the richness of the tax base and all other things given cities with a weaker total tax base can expect costs of policing per $100,000 of assessment to be higher.  At the same time, over the last decade, all five cities have seen a reduction in the net costs pf policing per 100,000 dollars of assessment.  This could be a function of growth in tax bases as well as other efficiencies and economies.