Northern Economist 2.0

Tuesday, 15 October 2024

Inflation, Productivity and Real Wage Stagnation: Canada 1960 to 2023


Today’s CPI inflation numbers have many breathing a sigh of relief with the expectation that with inflation below 2 percent, more interest rate relief is on the way and Canadians can resume their high personal borrowing lifestyle.   Lost in the short-term euphoria and celebration of expected lower borrowing costs is the long term cost that inflation has had on our standard of living given the low productivity gains of the last five decades.  Nowhere is this more evident than when one takes a look at how real wages have performed over time.


Figure 1 plots the average annual monthly hourly Canadian manufacturing wage – nominal and real – for the period from 1960 to 2023.  The nominal hourly manufacturing wage data and the All-City CPI data are both from the US Federal Reserve of St. Louis data sets [CPALCY01CAA661N; LCEAMN01CAM189S] with the real hourly wage data in $2015.   Why manufacturing wages?  Well, the manufacturing sector has generally been held up as the beacon for good quality and high paying jobs with a lot of hand wringing as manufacturing jobs have declined as a share of employment.  It sounds old fashioned but many still regard manufacturing jobs as the “high ground” of an economy in terms of value added to which I would also add the resource sector (including agriculture).


When nominal hourly wages are examined, their performance looks impressive.  The monthly nominal manufacturing wage in Canada in 1960 averaged $1.78/hr. By 2023, it was $30.66/hr and the average annual growth rate of real nominal hourly wages in manufacturing was 4.7 percent.  However, when adjusted for inflation using the All-City CPI for Canada with 2015 as the base year, real nominal wages barely double over the period going from $13.64/hr to $24.91/hr.  The average annual growth rate of real hourly manufacturing wages over this entire period was only 1 percent annually.  Given that at 1 percent annual growth it would take approximately 72 years for a quantity to double, we can expect real hourly wages in manufacturing to be double those in 1960 by 2032.


Figure 2 plots the annual average growth rate of real hourly manufacturing wages and adds a 5th order polynomial smoothing plot.  When one examines both Figure 1 and 2, it becomes apparent that the stagnation in real wage growth really sets in during the 1970s.  There was a brief uptick in real wage growth in the wake of the FTA and NAFTA (in 1988 and 1994 respectively) but decline sets in again after the 2008-09 financial crisis.  When one combines the productivity decline that starts in the 1970s following the first oil price shock with the effects of inflation, the erosion of the standard of living – as captured by real wages – is dramatically illustrated.  It makes the case for why bringing inflation under control is so important and also why we need a productivity agenda to drive Canadian policy going into the next election.

Friday, 3 November 2023

Ontario’s 2023 Fall Economic and Fiscal Statement: Some Thoughts


Finance Minister Bethlenfalvy released Ontario’s fall 2023 fiscal and economic update and a perusal of the numbers tells a number of stories.  First, the province is expecting the economy to slow down with consequent effects on its revenues though the current outlook for the current fiscal year 2023-24 shows tax revenues up just over 3 percent while 2024-25 and 2025-26 are currently projected at growth of 3.3 and 6.1 percent respectively.  Indeed, the period from 2022-23 to 2024-26 is expecting to see total revenues up 14 percent.  Over the same period total program spending is expected to rise  by 8.5 percent, debt interest by 22.6 percent and total expenditure will be up by 9.4 percent. 


Thus, revenues are projected to grow faster than expenditures but the gap between revenues and expenditures will persist until 2025-26 when a small surplus of 500 million dollars is forecast.  However, given spending that year includes a reserve of $2 billion set aside, it is likely the surplus that year will be much bigger. An economic slowdown notwithstanding, the province appears to want to keep a deficit on the books for as long as possible no doubt in part as a cautionary measure given economic uncertainty but also to quell demands for more public spending.  And as for economic uncertainty, employment is expected to grow each year until 2026 and the unemployment rate at its highest will reach 6.6 percent before declining to 5.8 percent by 2026. Hardly the recessions and downturns of yesteryear.


However, two items did catch my eye.  First, for 2023-24, the net public debt is expected to take a bit of a leap to $416 billion.  From 2018-19 to 2023-24, the net debt will have grown from $338 billion to $416 billion, an increase of 78 billion dollars or 23 percent.  However, deficits over that same period only sum to $42 billion.  In other words, an amount over and above the sum of accumulated deficits of $36 billion has been added to the net debt.  While this is of course likely the result of current government accounting practices that book capital and infrastructure expenditures separately from the operating expenditures, it is nevertheless a sizeable increase to see. 


More seriously, is the following.  If one takes past, current, and projected nominal GDP for Ontario, factors in inflation using the CPI as well as assumes population growth going forward at the medium Finance Ministry scenario of 250,000 people a year (about 1.7 percent), one gets a picture of real per capita GDP in Ontario that suggests that by 2025, real per capita GDP will be no higher than it was in 2017.  If one looks at the accompanying figure, despite ebbs and flows (with a particularly large ones circa the pandemic) as well as the early 1990s) real per capita GDP growth has been noticeably slower since about 2000.  The average annual growth rate in real per capita GDP from 1960 to 1999 averaged 2.1 percent while from 2000 to what is projected by 2025 the growth rate is 0.5 percent. 


You can blame some of this on population growing more quickly over the last few years, but the real culprit is that productivity growth in Ontario is lack lustre.  The long-term effects of productivity decline have begun to manifest themselves in our standard of living.  Real per capita GDP in 2022 in $2020 is $64,170.  If since 2000, real per capita GDP had grown at the average annual rate from 1960 to 1999, in 2022 it would be about $86,000 – that is a difference in output of nearly $22,000 per Ontarian.  It is not apparent that this stark difference has sunk in yet across political and policy circles in Ontario.  We have foregone a lot of output given our productivity decline and in the absence of a shift, that amount will only continue to grow.


Wednesday, 1 March 2023

Is Canada’s Labour Shortage Actually a Productivity Slump?


Despite what seems to be supply side issues of staff shortages, rising demand and inflation in the wake of the pandemic, at least one contrarian view is that Canada’s labour shortage is an illusion. University of Waterloo economist Mikal Skuterud in a recent Globe Oped noted that despite perceptions of a labour shortage, Canadian labour force participation was identical to what it was in October 2018 at 65.7 percent and the absolute size of the labour force at 20.8 million is the largest it has ever been.  The “shortage” may indeed also be a result of the demand for workers in the post pandemic surge growing faster than their numbers.  Indeed, if one looks at the health sector, the supply of physicians and nurses per capita is the largest it has ever been but the post pandemic surge in dealing with postponed surgeries and procedures has been overwhelming.


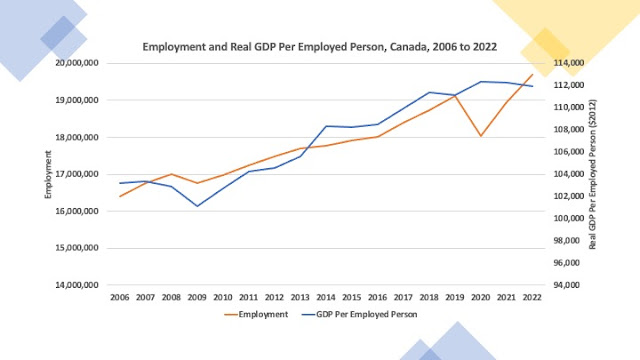
However, the problem may be worse than you might think.  Not only is the size of the labour force the largest is has ever been but so is total employment.  If you look at the number of people employed – producing labour units so to speak - it is three percent higher than it was in 2019.  Employment did plunge in 2020 as a result of the pandemic shutdowns but it has since rebounded dramatically – by over 9 percent since 2020.  As the accompanying figure illustrates, employment is indeed the highest it has ever been.  [Data Sources: Statistics Canada, Table 14100393 Labour force characteristics, annual and 

V62471340 Canada [11124]; Gross domestic product at market prices]


However, despite more people working than ever before, the output response has been shall we say a bit sluggish?  While employment grew by over 9 percent from 2020 to 2022 as pandemic recovery set in, real GDP (in $2012 constant dollars) grew by less than 9 percent.  As a result, output per employed person has actually declined since 2020.  From 2020 to 2022 real GDP per employed person actually fell by just over one third of one percent.


Something has happened over the course of the pandemic that seems to have affected the productivity of Canadian workers.  Perhaps the long shutdown resulted in a deterioration of human capital and skills?  Perhaps the retirement of so many experienced workers and their replacement by less experienced entry level workers has led to output disruptions as new workers learn by doing?  Or, after the trauma of the pandemic, everyone wants more work life balance and as a result we are simply not working as hard as we used to?  Is this simply the aggregate effects of “quiet quitting?”


Such slowdowns in output per employed person are not unique to the pandemic era and based on the chart have occurred before – for example during the Great Recession and also between 2014 and 2016.  History suggests that we do recover from these “productivity” slumps and based on past performance one would expect the same over the next couple of years.  The disruption of the pandemic will take a number of years to fully work its way through the economy and the social fabric of the country.  The bigger problem in terms of productivity is if this time things are going to be different, and the productivity slowdown becomes a permanent feature.  Given that Canada has had economic productivity issues for decades, this latest iteration of an old issue is disconcerting to say the least.