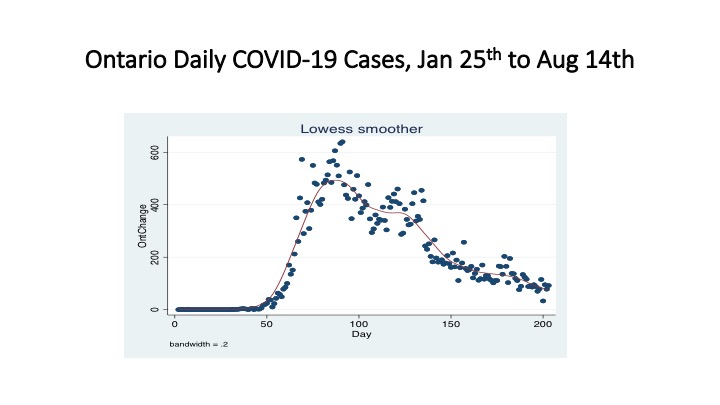
Ontario's COVID-19 daily case numbers have now been trending up since August and the most recent plot and LOWESS smooth I have put together shows an upward trajectory as steep as the first wave. Moreover, it is a pretty tight fit around the trend line - little dispersion. That could be the result of more substantial and consistent testing as opposed to the first wave, or it could mean a more persistent and ingrained wave is underway. The only silver lining to date is that deaths have not taken a similar upward spike.
It is said that economists know the price of everything but
the value of nothing.Nevertheless, such
sentiment like this does not stop economists from looking at costs and as Ontario’s
COVID-19 pandemic declines and enters a lull, it is worth assessing what the
cost of the pandemic to date has been.As the accompanying figure illustrates, after just over 200 days since
the first case in Ontario, we appear to be on a downward trend in terms of new
daily cases.Indeed, the daily growth
rate is currently at 1/10 of one percent but relapses
are likely.As of August 14th,
we are at a total of 40,459 cases with 2,788 deaths - with over 80 percent of
them early on in the province’s long-term care homes.
Everyone is pretty much aware of the economic and fiscal
impact of COVID-19 on the country given the estimates of the annualized drop
in Canadian GDP this year ranging from 6 to 8 percent, the 13 percent
unemployment rate and the $343 billion dollar federal deficit.Ontario this week released its first quarter
finances and the picture was grim with a projected deficit for 2020-21 of $38.5
billion and a drop in real GDP of 6.6 percent this year.
The provincial government’s revenue is actually only
projected to be $5.7 billion lower from the March update at $150.6 billion (though
it was at $156.7 billion in 2019-20) but program expenses, COVID-19 assistance
and contingency funds are up dramatically – reaching a total of $186.7 billion to
deal with the pandemic.From total
spending of $161.1 billion in 2018-19 with a deficit of $7.4 billion, to total
spending of $165.7 billion in 2019-20 and a deficit of $9.2 billion, there has
been a large provincial fiscal cost.Ontario’s
nominal GDP was expected to be $909 billion in 2020-21 but is now expected to
be $844 billion.
Here is an interesting way to look at the cost to date of
this pandemic in Ontario.For the period
2019-20 to 2020-21, GDP is projected to be lower by $65 billion dollars while
government spending will be up.Total
spending is up $30 billion - from $156.7 billion to $186.7 billion.So, one measure of the direct fiscal and economic
cost in Ontario of the pandemic to date given the anticipated loss in GDP and
the projected spending increase is to combine the two for a total of $95
billion.If you take Ontario’s population
in 2020-21 (14.831 million) and divide, the per capita cost in Ontario this
year is expected to be $6,406.
While that sounds like a lot – and it is - there is another
way to look at the numbers.With total
cases at 40,459, the cost per case to date in terms of additional spending and output
loss is $2,348,056.And if you want a quick
back of the envelope calculation of the value of a life – yes, economists (and governments) do
that too – then given the number of deaths to date at 2,788 – we get a cost of
$34,074,605.A per capita cost of $6,496
dollars, a per case cost of $2.3 million and a per life lost cost of $34.1
million – anyway you look at it, this has been expensive.
Well, as of tomorrow, pretty much all of Ontario moves into Stage 2 of the post-COVID lockdown reopening and this has been fueled by the continued decline in daily cases in Ontario. As the accompany figure below shows, after the mid May plateau around 400 cases, decline appears to have resumed and yesterday June 22nd was one of the lowest case days since late March coming at 161 new cases. However, I would venture that the decline is about to slow again again and we are about to have a second plateau at around 200 cases per day. Indeed, today's numbers show a rebound to 216 and if you look carefully at the LOWESS curve, it has slightly flattened out about the same way as I noted before the last plateau in a post in mid-May.
If this turns out to be the case, then Ontario's daily COVID profile will soon come to resemble a series of downward steps rather than a steady decline. If we plateaued at 400 in mid May and then at half the numbers in mid to late June, by the end of July if we half yet again we will still be getting 100 cases daily. Ideally, the goal is to enter a "plateau" where the daily case growth is actually 0, but that is unlikely given that so many people have really already relaxed their attitudes. Baring zero new cases as a goal, Ontario needs to see daily case growth of 0.1 percent or lower by the end of July. If that were the case today and the growth rate of cases was 1/10 of one percent, then there would be only about 34 new cases today. We have a ways to go.
As Canada
begins to make significant inroads in driving down the daily new cases of
COVID-19 and the number of recoveries rises further, the path forward is
two-fold.First, we need to make
sure that we continue to monitor the infection rate and take steps to ensure
that there is not a re-ignition of the pandemic and a second wave.Second, after three months of lockdown and reduced economic activity, we need to get the economy moving again – albeit
carefully, with new rules and procedures for reopening to comply with the first
step above.Nevertheless, the challenge
is daunting given a national unemployment rate that has soared to over 13 percent
with 3 million unemployed and nearly as many underemployed with fewer hours of
work.
We cannot
afford a second wave given the economic damage that has already been done to
the economy.Many businesses may indeed
never reopen and of those that remain, if they do not reopen this summer, there
will be even more attrition going into the fall.Part of the issue is the fall in demand but
part of the issue is also the ability to find workers to start doing things
again given the incentive effects that rapidly designed assistance packages
appear to have created.There is
anecdotal evidence and public commentary that the CERB is paying many people to
stay at home and that some people getting the CERB may not be entitled
to it.Naturally, the numbers alone raise eyebrows
given that up to 6 million Canadians are either unemployed or working fewer
hours but over 8
million are apparently receiving CERB benefits.The stories range from PEI
to Ontario
and have prompted proposals of a
crackdown.
This makes
today’s announcement about the
two-month extension to the CERB particularly concerning.While the government tried to place
conditions on receiving the extension – such as "actively looking" for work though how that could even be monitored is a good question –
these apparently did not pass so we are stuck with two more months of a program that may cause some disincentive effects when it comes to
re-starting the economy this summer.Now
it stands to reason that support like the CERB was needed to deal with the
onset of the pandemic and making sure that people did stay home during the lockdown.However, the numbers suggest that many more
are collecting the CERB than the employment impact numbers suggest have been
impacted.
For the upwards of two million Canadians collecting the CERB that
appears in excess of the sum of those unemployed or with reduced employment, the last three months
have seen the start of an early summer. With today's extension of 8 weeks,
Canada has now embarked on providing a relatively generous long summer to
several million people rivaling all that time off of school for the kids. There may indeed
be some very nice social benefits to all of this as people have more time to
enjoy their families and do the things they have always wanted but ultimately
the CERB is costing about $17 billon a month which means by early September it
will have cost nearly $90 billion.And,
if more businesses shut down during the summer because they cannot restart due
to labour shortages, then there will be even fewer businesses open to hire
people come September and we end up with a self-reinforcing circle and a call to extend the CERB yet again.
Without a vaccine or effective treatment to COVID-19, there may indeed be many arguing its not safe to ask people to go back and that the CERB be extended. At the same time, given the traffic I have seen in Thunder Bay this last week, I imagine the fear of COVID-19 may apply to returning to work, but little else. If the CERB
is to be re-extended, then perhaps a declining benefit designed to
ease people off the support and back into the labour market makes sense. If the first three
months are $2000 per month, perhaps the extension should come in at perhaps $1500
if only to set a precedent when the inevitable calls come in August to extend
the benefit yet again.Canada’s support to those hit by COVID-19 has been considerate and appropriate
but it needs to have a long-term purpose.It needs to help facilitate a transition back
to economic re-engagement and not become a permanent fixture given the haste with which it was cobbled together. If this is the start of a basic income program, it needs to be better designed. On the other hand, maybe this all just a lead up to calling a fall federal election.
After over
two months of “lockdown” in Ontario, our progress with respect to COVID-19 appears
to have reached what can only be termed a plateau.We have avoided worst case scenarios like
Spain and Italy and not overwhelmed our hospitals but we are not seeing our
numbers of new cases consistently go down as in some other provinces across the
country such as Manitoba or B.C.To be
fair, Ontario does have some of the most densely populated parts of the country
– namely the GTA – and the combination of dense populations and an
international airport are factors which made the COVID-19 situation worse.Ontario is not PEI or Manitoba.
At the same
time, our response to the onset of COVID-19 could have been quicker – here
Ontario was not alone given the federal response – and the resulting “lockdown”
was not really a lockdown in the sense of some of the European countries such
as Italy or Spain.While those countries
were hit harder, they were at the front end of the pandemic and responded more
firmly with their lockdowns.In Italy,
the “lockdown” was a complete shutdown where you could not go out unless it was
to the grocery store or pharmacy and if stopped while out you needed to justify
where you were going to police.As a
result, despite a more severe outbreak and having four times Ontario’s
population, Italy is now registering fewer daily new cases than Ontario.
Ontario’s
approach to COVID-19 in the end is a sort of Swedish approach with a fuller
shutdown, less public compliance and a bigger economic cost in terms of
shutdown.Sweden’s population at just
over 10 million people is close to Ontario’s 14 million.Its approach in the end has been less
successful in that it currently has a total of about 41,000 cases and 4,542
deaths compared to Ontario’s 29,047 cases and 2,312 deaths.The Swedish approach has been less damaging
to its economy - even schools and restaurants remained open – but its daily
case numbers have not gone down settling into an equilibrium between 500 and
1000 new cases a day. The problem with the Swedish approach is not only the
higher death rate but of course the greater risk of the pandemic re-igniting
given the larger number of embers.
Ontario’s
approach in the end has parallels to the family of five squirrels nesting in my
rear yard’s pine tree.Obviously, they
are sensitive to COVID-19 given that they are sticking to gatherings of five. However, they are a bit of a nuisance.Despite
my obvious attempts to discourage them, they do pretty much as they please as
they gallivant from tree to tree.However, they are very skittish and if I play hawk calls from my phone,
they scamper away and lay low.That
seems to be the case in Ontario where despite a pandemic emergency and rules on
social gatherings, people still pretty much go about their daily business including
gathering in public parks and even participating in demonstrations in large
densely populated cities.And, the relaxed
approach and lack of attention to details is even in some of those institutions
that we were all most afraid of being overwhelmed – our hospitals. And then, as soon as something goes wrong, we act. Its not a consistent strategy.
This story
on Thunder Bay’s CBC web site regarding a commuting physician
with COVID-19 symptoms working at Thunder Bay Regional for days is an
unfortunate case in point.While I am
certain that this is a complex story with many dimensions, the essence to me is
that the hospital was not consistently following its own protocols – whatever
they happen to be – and once a problem emerged, the response was the squirrel
thing – a rapid shutdown again of all its “non-essential” surgical and
outpatient procedures.I suspect that in
the end, the mortality rate is going to rise in the coming year in Ontario but
more of the rise will be attributable to delayed diagnostics and medical procedures
than from COVID-19 itself.
In the case
of Thunder Bay Regional, the interesting part of the story is that there will
now be an investigation but that “the full report may be kept under
wraps.”Really? Are we implementing
Chinese Communist Party management principles in Ontario health care?I would be interested in knowing why during a
pandemic an incoming commuting physician was not tested for COVID-19 as a
matter of course especially given that the physician was exhibiting symptoms.
True, they could be seasonal allergies, but given the difficulty of separating
COVID symptoms from allergies, should not the medical staff worker have been
tested as a precaution?Is there not a supervisor this
physician reports to who could have compelled testing on first mention of
“allergy symptoms” to remove doubt? As an aside, was this physician flying back
and forth to their other abode or driving?
In the end, what do I really know?I am a simple country economist observing the
world from my home – be it presidents and prime ministers trying to make
decisions affecting the welfare of their populations, hospital administrations
and public health units dealing with health care, or squirrels foraging about
their daily business.To date, the motivation
and behaviour of the squirrels has been the easiest to understand.
Well, it is
June 1 and after several months of dealing with the pandemic, Ontario’s daily number
of new cases was 404.Oddly enough, the
internet “error” signal as your case number is probably divine commentary on
the state of Ontario’s efforts to date on dealing with the corona virus.It does appear that Ontario has stalled when
it comes to reducing the daily number of new cases and after last week’s large
gatherings at Trinity-Bellwoods Park and now the demonstrations in Toronto over
the weekend, there will likely be another spike in cases about two weeks down
the road.Toronto has already been responsible
for a disproportionate number of new cases in Ontario and this will likely get
worse.
Of the 3,409 cases added to the Ontario
total between May 16 and May 23, the Toronto Public Health Unit area added 1,955
of them – nearly 60 percent of the total.The population of this area in 2016 was 2.7 million out of 13.5 million
for Ontario as a whole – a 20 percent share.So, it appears that COVID-19 in Toronto is occurring at about three
times the provincial rate and it does not look like it is going to improve
anytime soon.
The crux of
the matter is illustrated in Figure 1 which shows the number of daily new
COVID-19 cases from January 25th to June 1st with a 0.5
bandwidth LOWESS smooth.The results do
not require a degree in statistics or epidemiology to interpret.We appear to have a reached a daily plateau
in terms of the number of new cases.In
terms of the growth rate of total cases, we have not cracked the 1 percent
daily growth rate barrier.Indeed, the
best we ever did was May 26th and 27th when we got down
to 1.1 percent, but the growth rate has inched up since and today was 1.5
percent. By way of comparison, Italy is now down to a 0.1 percent growth rate
in total cases.
And speaking of Italy,
here is another interesting comparison.In Figure 2, Ontario and Italy daily cases are plotted since January 25th
and guess what – despite having about 4 times our population and one of the worst outbreaks of Covid-19 in the world, Italy is now at about
the same number of daily new cases as Ontario.
So, we do
have a problem and the problem is Ontario’s disjointed attempts at dealing with
the pandemic.Like much of the country,
we moved slowly at the outset in dealing with the pandemic and this still seems
to be the hallmark of the Ontario response. Case in point.Pearson airport today announced new
strict health measures for dealing with COVID-19-effective June 1st
including the compulsory
wearing of face masks everywhere in the terminal.Interestingly, these were not announced April
1st or even May 1st but June 1st.Seriously?Airports are under federal jurisdiction, why so long in finally announcing
and implementing these types of measures?The federal government is probably too busy rushing funding to one group
after another – today it was $2.2 billion for municipalities - as a sort of
fiscal atonement for the sin of not being ready for the pandemic and then reacting
too slowly when it began.
I think a glimmer
of hope is from the news
reported in Italy that Dr. Alberto Zangrillo, the head of the San
Raffaele hospital in Milan apparently has claimed that ““the virus clinically no longer exists in Italy”, provoking a furore in
Italy. “The swabs performed over the past 10 days have showed a viral load that
is absolutely infinitesimal in quantitative terms compared to those carried out
a month or two months ago.”Essentially,
the virus has begun to mutate and has become less lethal.As for Dr. Zangrillo – he looks like a pretty
solid researcher type to me given his
Google Scholar page.Of course, this
has been challenged by health experts and I certainly would not rush out into
the street to demonstrate in public celebration. Nevertheless, Italy has been
ahead of the curve with respect to the severity of the illness and if this is
true, then it is a glimmer of hope. We could use a lucky break from the lack of
initial awareness and plodding approaches of both the Ontario and Federal governments.
As of May 16th, 2020 Ontario is reporting 22,313 confirmed cases of Covid-19 and 1,858 deaths. The good news is that 75 percent of cases are resolved and the active number of cases is trending down. There have been some data glitches in reporting the last few days and while the number of new cases is trending down, it remains that the number of new cases is still what I would term a smouldering burn with the potential for re-ignition. This is of course a concern given that Ontario is beginning to resume activity with an acceleration of openings on Tuesday.
To be fair, this is a disease whose transmission can be prevented by avoiding crowds and long-term presence in confined spaces, spending more time in outdoor well ventilated areas, practicing social distancing and practicing good hand hygiene. At the same time, this requires a fair amount of self-discipline and given that our daily case numbers are still bouncing between 300 and 400 for a week now, it means a chunk of the population still believes the rules do not apply to them and do not understand the concept of negative externalities. These are probably the same types of people who let their barking dogs out in the middle of the night or throw cigarette butts and fast food wrappers out the window as they drive.
The figure below shows the number of daily cases with a LOWESS smoothing trend fitted for the period January 25th to May 16th. The trend shows the number of daily cases peaked on Day 92 - circa April 25th - have have been trending downward since but the decline has been slowing and there may even be a slight upward tick.
Of course, it is not the number of new cases per day but the growth rate
of total cases that is even more important and the goal should be to
get it below 1 percent (and ultimately zero). Italy, for example, is now seeing the growth
rate of its total Covid-19 confirmed cases at about 0.4 percent. But
then despite initial stumbles, it has been following a stricter lock-down because it was hit much
harder than other places. Why is 1 percent important? Well, at one
percent growth it would take 72 days for the total number of cases to
double. At 20 percent daily growth - which was where Ontario was in late
March - the total number of cases would double in just over three days.
If you want to get the pandemic under full control and have new cases
not reignite a major spike that overwhelms the health care system, then
you need that growth rate below 1 percent. Ontario at present has seen
the growth rate fall below 2 percent but the last few days have not seen
it below 1.5 percent. That is not good enough.
Ontario also appears to have a number of distinct regional pandemics under way as the next figure illustrates. When the cases are sorted by public health units in terms of total confirmed cases per million and a two-unit moving average applied, here is what the picture looks like.
The highest rates of infection have been in Toronto and Peel at 3,023 and 2,466 cases per million respectively. There is then a drop off to a second tier in terms of severity and these health unit areas are Leeds-Grenville & Lanark (Eastern Ontario), Windsor-Essex, Durham. Ottawa, Haldimand-Norfolk, Waterloo, York and Lambton and they range from a high of 1,932 to a low of 1,713. There is then another drop-off to a third tier consisting of the remainder going from a high of 1,291 cases per million in Niagara Region to a low of 150 cases per million in Algoma. Note, that some of these regions are nowhere near 1 million people in population. Thunder Bay District, for example, clocks in at 520 cases per million population but there are only about 140,000 people in the District so do the math and you can see the absolute numbers are quite small.
So, what is the long and short of this? To date, the province has been pursuing a one-size fits all policy in dealing with the epidemic which was fine in dealing with the start of the first phases of the pandemic. However, a one size fits all policy for re-opening given that some people are already slacking off on precautions is a bit of a concern especially in the parts of the province with higher case densities. So, if we are going to open things up up at the same rate everywhere, everyone everywhere needs to continue exhibiting common sense and exercising personal caution and distancing measures.
The April 2020 labour force numbers are out from Statistics Canada and the numbers are indeed grim. Employment dropped by one million in March, and fell by
nearly two million in April, bringing the total employment decline since
the beginning of the COVID-19 economic shutdown to over three million. In addition, the number of people who were employed but worked less than half of their usual hours for reasons related to COVID-19 increased by 2.5 million from February to April.
Statistics Canada noted - and this was picked by by the media - that the size of the decline in employment since February (-15.7%)
far exceeds declines observed in the 1981-1982 recession which resulted in a total employment decline
of 612,000 (-5.4%) over approximately 17 months. However, the national unemployment rate in April 2020 is what the unemployment was like at the peak of the 1981-82 recession - at 13 percent. Employment and the labour force have grown substantially over the last 40 years making such comparisons of absolute numbers problematic. Nevertheless, the increase in unemployment rates and the percentage declines in employment are dramatic given that declines in previous recession were spread out over months while this one has happened in 30 days.
A comparison across CMAs is quite interesting. All of Canada's 35 CMAs saw an increase in their unemployment rates (3 month moving average) with the highest unemployment rates currently in Saguenay(13.1 percent), Windsor and Calgary. The lowest are in Victoria, Ottawa, and Abbostford-Mission (6.2 percent). Thunder Bay clocks in the middle of all this at 9.2 percent with Sudbury much lower at 8.9 percent.
As for employment declines in percentage terms, everyone saw their total employment decline relative to April 2019 - except for Barrie of all places. Even with the March to April drop of 6400 jobs, Barrie has been growing so robustly that its April 2020 total employment is still 5 percent higher than April 2019. However, the employment drops are quite steep especially for Peterborough and Windsor which saw their employment drop 17.7 and 15.8 percent respectively. Relatively unscathed - along with Barrie - are London, the Ontario portion of Ottawa-Gatineau, Trois Rivieres and Moncton. Thunder Bay is again close to the middle in terms of employment declines at -6.3 percent while Sudbury was -8.9 percent.
So, there you have it. The numbers will probably get worse before they get better. The numbers for May - which will come out in June - will probably show an increase in the unemployment rate as well as a further decline in employment. However, the additional declines should be substantially less. One can start to expect to see improvements in the employment numbers in June which will be reflected in July's release.
Thunder Bay District's first COVID-19 case was reported about one month ago - on March 26th. Since then, the number of cases have grown but the number of daily new cases appears to have declined from the peak reached April 15th. We have however, also registered out first death as of April 23rd and given mortality rates from the illness, one can probably expect a couple more deaths based on current case load numbers. The first figure below shows the steady ascent from the first case to the current (as of yesterday) total of 63.
The ascent appears to have slowed since the 21st and the next figure plotting daily new cases does appear to show a distinct hump peaking somewhere between April 11th and April 15th. If over the next week, growth in new cases drys up completely then it may be that the pandemic has failed to take firm root in our part of Ontario. This is certainly good news, but not a cause to relax given the need to maintain physical distancing protocols and precautions in the absence of either a cure or a vaccine.
Its not over yet. Maintaining personal discipline over the next few months is crucial to arresting the progress of this virus.
Acting on the advice of the Chief Medical Officer of Health and
other health care professionals, the Ontario government has significantly
expanded hospital capacity in preparation for any COVID-19 outbreak
scenario. The province has added 1,035 acute care beds and 1,492 critical care
beds and taken steps to ensure hospitals have the staff available to care for a
sudden surge in patients. Based on Ontario’s population and 2017-18 total
hospital bed numbers from the CIHI, this should boost the total number of
hospital beds per capita in Ontario to 2.5 per 1,000 population. Moreover, there are plans to add further
capacity in terms of bed numbers.
Expansion of capacity and associated funding to staff those beds is
necessary to deal with the COVID-19 outbreak but it is also necessary to deal
with future health demand because hospitals in Ontario have seen their per
capita hospital bed numbers and real per capita hospital spending stay flat for years. Real per capita
provincial government health spending in Ontario from 2000 to 2019 grew 39
percent but growth varied across the health expenditure categories.Hospitals in Ontario over this period
only grew by 14 percent with much of it before 2010 and since 2012 has been
essentially flat.The largest
increases were in per capita public health (133 percent), other health spending
including home and community based care (101 percent) and drugs (59 percent).
Across Canada’s ten provinces, Ontario currently has the second
lowest number of total hospital beds per 1000 people after Quebec at 2.3 beds
per thousand (which will grow to 2.5 with this announcement) with Quebec coming
in at 1.9.Newfoundland comes in
the highest at 4.6 beds per thousand followed by New Brunswick at 3.8 and
Manitoba, Prince Edward Island and Nova Scotia all tied at 3.4.Ontario, like many Canadian provinces
has developed a “just in time” hospital care system with little spare capacity.In the past, winter months often saw
surges resulting in hallway medicine because of surges in demand from seasonal
flu.
Currently the reports are that hospitals in Ontario have been
coping well as the anticipated peak surge due to COVID-19 appears to have been
held back by the implementation of public health protocols such as physical
distancing and shutdowns of activity.Assuming
the additional beds and staffing can be put in place quickly, it better
positions Ontario hospitals for any surge in COVID-19 and boosts capacity for
the period afterwards.That is
good news because to date the expansion in the current ability to free up beds
has been done by rationing access to services.Essentially, beds have been freed up
by sending as many patients as possible home, delaying elective surgeries and
postponing deemed non-urgent surgeries.As well, demand for emergency services is down as people delay going to
seek treatment which has ramifications for future need as people put off
seeking medical care.
Given that we may be nearing a
slowing down in the growth rate of total confirmed cases in Ontario
Covid-19 cases, I think the ability of the health care system to deal with
Covid-19 will be even more secure especially as more beds come on stream and
supplies of critical materials and PPEs increase.This will hopefully result in
hospitals starting to resume dealing with elective and non-urgent surgeries and
their usual diagnostic testing services given that almost all of this has been
put on hold.The postponing of
other health procedures is detrimental to the long-term health of many
Ontarians and is an additional cost of the Covid-19 pandemic in terms of both
its potential effects on general future mortality and morbidity as well as
future health care costs.
Running a “just in time” public health care system at capacity with most
activity – diagnostic, acute care, surgeries and emergency services - mainly
concentrated at large centralized hospitals will need to be revisited.We need a more resilient health care
sector that able to cope with surges in demand in crisis situations as well as
continue to provide other needed health services.One can hope that in future, along
with a reinvestment in hospital capacity and proper maintenance of public
health equipment stockpiles, one will see an expansion of broader function
“Urgent Care Centers” across the province that will provide a range of
emergency type services outside of hospital settings as well as more
decentralized diagnostic clinical centers that are able to do minor elective
procedures outside of a major hospital setting.The current approach to the health
care system in Ontario is essentially akin to putting all your eggs in a very
small and fragile basket.
It is now Day 85 of the start of the Covid-19 pandemic in Ontario as dated from the first case on January 25th of 2020. There are signs of the epidemic peaking in parts of Canada like British Columbia and Saskatchewan along with discussion of the gradual reopening of activity in measured and methodical ways. In Ontario, as of Saturday morning the 18th of April, there have been 10,010 confirmed cases of COVID-19 and a total of 514 deaths. The number of new cases reported today was 485, down from 564 the previous day and 514 the day before that. There has been some talk in Ontario also that the pandemic may be slowing and that there is some cause for cautious optimism. Indeed, the province is expected to release new modelling numbers on Monday that some have hinted may show some support for optimism.
Well, in anticipation of that, here is my go at the numbers to date using STATA and a simple data smoothing regression technique known as LOWESS. Figure 1 plots the total number of cases since Day 1(January 25th) when there was the first case to the present with the red line as the smoothed curve. Needless to say, this figure does not look particularly reassuring but it is the total cumulative number of confirmed cases and the more appropriate graph in order to judge growth rates in the total case figure is Figure 2 which presents the log of total confirmed cases. Here the evidence still shows an increase but somewhere around Day 70 - that is around April 3rd - there does seem to be a change in the growth rate and the curve trends upwards less steeply. This is a bit of good news.
Figure 3 is yet another go at the numbers, this time a plot of the number of new confirmed cases per day again with a regression smooth. The number of new cases per day begin to soar circa Day 50 which is March 14th but again note that the trend in new cases per day - as visualized by the LOWESS smooth - goes up at a lower rate again circa the April 3rd point.
However, the best news of all comes from looking at the growth of cases per day in terms of daily percentage growth rates in total confirmed cases. Figure 4 presents this data with the accompanying LOWESS smooth. One can discount the far left of the diagram as this is the start of the pandemic with few cases and therefore some very large growth rates when the number of cases double. The data smooth line basically shows the increase in growth rates picking up steam after Day 20 - which would be the 13th of February though the actual data starts picking that up closer to Day 30 which is February 23rd. The daily percent growth peaks a bit before Day 60 - March 24th - and then starts to slowly come down. Growth has been under 8 percent since April 11th and just fell below 6 percent in today's release coming in at 5.1 percent.
So, despite my limited knowledge (borrowing from Star Trek, "I'm an economist Jim, not an epidemiologist!"), I would hazard to guess that the infection numbers today reflect what was going on about ten days ago. This gets further complicated by the fact that we are running more tests today than we were ten days ago and indeed a month ago. Nevertheless, if we are testing more and the total number of new cases is stable but not soaring and the percentage growth rates seem to coming down, then yes we may be on the verge of bending the curve downwards and getting the pandemic under control in this province. Assuming over the last 10 days, we have all continued physical
distancing and taking precautions and the number of tests is maintained at current levels or increased, then the growth rates this week should
come in about 5 percent at the start of the week and then head down towards 4 percent by Friday. Let us hope.
The Covid-19 pandemic is now well underway in Ontario. Between March 1st and March 31st, the total number of confirmed cases rose from 15 to 1,966. From the first death on March 17th, the number of deaths grew to 33 by March 31st. Since March 31st, total confirmed cases have grown to reach 4,726 (as of April 7th noon-time) and the total number of deaths have climbed further to reach 153. What is quite interesting is plotting the numbers as the public health sites present case totals but plots to help assess trends are not readily in evidence.
Figure 1 plots the total confirmed cases in Ontario announced to today and they reveal a very steep curve of ascent. What is also interesting is looking at the change in cases per day which is plotted in Figure 2. The number of new cases was the highest on April 2nd at 573 and since then have essentially bounced up and down in a band from 290 to 408. If this latter trend is maintained and then starts to show decline, we may be indeed be at a turning point in the war against COVID-19 but it is still too early to tell.
What is also of interest is what the figures look like here in the Thunder Bay District. It is early days yet in the Thunder Bay District with the first case being reported March 27th. However, as of April 6th, Figure 3 shows what the total cases and the new cases per day looks like. There of course have yet to be any reported deaths in the Thunder Bay District
It is still what looks like a fairly leisurely ascent - somewhat similar to Ontario as a whole in early to mid-March but we are now in early April. The March breakers have been back for about two weeks and hundreds of our local snow birds have also been returning. If we have taken the self-isolation an distancing protocols to heart, then hopefully this will not rise too steeply and also begin to flatten out. We certainly have had plenty of notice and warning given what has happened around the world and in the rest of the country. The next week will be crucial in both Ontario and Thunder Bay District.
I'm not an epidemiologist by any stretch of the imagination but economists have data analysis skills that are relevant here. Here are some pretty stark charts of the current Covid-19 crisis in Ontario. Covid-19 in Ontario actually dates from a first confirmed case on January 25th with a first death on March 17th. The figure below plots confirmed cases and the daily change in cases and show a more rapidly escalating curve for total confirmed cases starting around March 11th. The change in the number of cases picks up quite dramatically after about March 27th - not that long ago. From one case on January 25th, Ontario has ramped up gradually with an acceleration over the last week and as of April 2nd, has 2,965 cases. At the time of posting, Ontario had added 573 cases today - the biggest daily increase yet.
If the rates of change are not arrested - that is, the orange line in the above figure first flattens and then declines - one is headed towards a catastrophe. Take the example of Italy. Believe it or not, on January 25th, Ontario had one confirmed Covid-19 case while Italy had zero. Italy acquires two cases on January 31st. From two cases on January31st, the Italian pandemic exploded and as of April 1, stands at 110,574 confirmed cases.
Italy is of course much larger than Ontario in terms of population with about 60 million people compared to Ontario's 14 million so a comparison of cases per million population is useful. As illustrated below, Ontario to date has had a more gradual spread. While Italy is currently at just over 1800 cases per million population, Ontario is at 205 cases. Despite almost identical starting points, Ontario appears to date to have been spared the more rapid increase that occurred in Italy with a key divergence point between the two countries being the first week of March. However, we are at a crucial point given that in Ontario as in Canada as a whole, the tepid rates of increase prior to mid-March lulled us into a false sense of security. Tens of thousands in Ontario and Canada embarked on their March breaks and have since returned. As well, snowbirds and other international travelers have come home. Travel is the key factor in the initial ignition of Covid-19 and its contribution in the post March break period can only be halted by rigid adherence to physical distancing.
If Ontario's infection rates per million and resulting total confirmed cases had behaved like those of Italy, at this point we would - based on Italy's case numbers per million - be at over 26,000 Covid-19 cases in Ontario and with a much larger death toll. As the figure below illustrates when comparing Ontario's actual Covid-19 numbers with a simulated amount using Italian infection spread rates in terms of cases per million, the difference is stark. At Italian rates of spread and infection, Ontario would have reached 400 total cases by March 4 and would now be at just over 26,000.
Such a counterfactual exercise is extremely revealing as to how bad this could have been to date - and how bad it could still get. We cannot afford to be complacent or not take this seriously. Ontario - and Canada - still have the ability to halt this pandemic in its tracks but it requires discipline and adherence to social and physical distancing rules on all our parts before it is too late.
The international statistics of the COVID-19 outbreak generally show the total number of cases by country and the source of the outbreak - China - has to date the largest total number of cases at 81,218 (as of 12 Noon today from the Worldmeters web site ). Catching up is Italy with 69,176 cases and in third place is the United States at 59,966 followed by Spain at 47,610. However, these numbers do not adjust for the vastly different population sizes of these countries which provides a more accurate assessment of the relative impact relative to population size. China after all has over 1 billion people whereas Luxembourg is under 1 million.
Figure 1 plots the top 30 countries in terms of total case numbers by total cases per 1 million population. The most affected country in terms of cases per 1 million of population is actually Luxembourg at 2,129 cases per 1 million(M) people. Next, comes Switzerland at 1,217 cases per 1M followed by Italy at 1,144 per 1M, then Spain at 1,018 and then Austria at 620. The United States comes in 17th place in this ranking at 77 per 1M and Canada 22nd at 77 total cases per 1M. Where is China? It currently is in 25th place at 56 cases per 1M people.
Figure 2 plots the top 30 countries in terms of total case numbers by total deaths per 1M population. The most deaths per 1M population have occurred in Italy at 113 followed by Spain at 73 and then Iran at 25. The United States currently stands at 2 deaths per 1M people while Canada comes in at 0.7 deaths per 1M. As for China? It ranks 15th virtually tied with the United States at 2 per 1M people.
The failure of the Chinese government to properly take initial steps to contain the spread of the virus enabled it to become a very successful export particularly to those countries with very open economies in terms of trade and travel. That the Chinese government appears to have finally contained the virus within its border is reassuring but the corona virus cat so to speak is now out of the bag. Europe has borne the brunt of the spread. As for deaths, Italy and Spain have truly been outliers with very high death rates and why that is the case is indeed an important question as the rest of the world deals with this situation.
By now, we are quite used to seeing the daily numbers by province splashed across computer and television screens as the number of Covid-19 cases grows. As of 6pm on March 22nd, there were a total of 1430 confirmed cases in Canada. If we plot those ranked by province as in Figure 1 below, we see that the total number of cases is largest in Ontario at 425, followed by British Columbia at 424. However, what is interesting is that this does not convey the full impact of severity across provinces because this is not adjusted for population. Ontario, for example has approximately two and a half times the population of British Columbia which means on a per capita basis, British Columbia has more cases.
Figure 2 provides these same numbers in terms of cases per 100,000 population. It becomes quite apparent when the provinces are ranked in terms of cases per 100,00 population, that western Canada - particularly British Columbia and Alberta are the hardest hit in terms of cases at 8.3 and 5.9 cases per 100,000 of population. They are then followed by Ontario and Nova Scotia at 2.9 cases per 100,000 each. Saskatchewan clocks in next at 2.8, Quebec at 2.6, the Northwest Territories at 2.2, PEI at 1.9 and New Brunswick at 1.2. The remaining provinces and territories currently have less than 1 per 100,000 of population.
In his address to the nation earlier today, Prime Minister Justin Trudeau stated that he was not ready to declare a national emergency in regards to Covid-19 but that the federal government was studying the data and all options were still on the table. The number of cases in Canada today has reached over 1300 and there are now 20 deaths. If we are going to get this crisis under control, we need to completely shut the country down for two weeks - that is, there must be a lock-down in which everyone except essential workers in health, public security, and food and medical supply is restricted to their home and can only emerge either to shop for groceries, fill prescriptions at pharmacies, or obtain emergency medical care. Moreover, this needs to be enforced by public authorities with the power to stop individuals and ask why they are out and about or why they are in a group and not maintaining social distance.
This must be done sooner rather than later. This may seem to be an overreaction but in this type of situation it is better to overreact rather than under react if we want to have any hope of getting this under control and avoid what is happening in Spain or Italy. We have had more lead time than those countries did and yet the federal government appears timid in its response. The decision lag continues. It is individual businesses and respective provincial governments that are taking action by declaring emergencies and implementing changes in how things are done.
The emergency economic action taken by the federal government is important but will not be effective if people are afraid. The best way to protect the economy is to protect the health of Canadians and give then the confidence that comes with knowing the health effects of COVID-19 are being contained. Perhaps, the federal government may feel that health is a provincial responsibility but under our constitution, the federal government has the overarching responsibility for peace, order and good government, the spending power and even the power of quarantine. Is the government waiting to repatriate everyone from abroad trying to get back? But how can they all come back if other countries are shutting their borders and airlines are stopping flights?
Who really knows what is driving the current federal response. One imagines if the elder Trudeau was currently Prime Minister, one would have seen the imposition of the War Measures Act to deal with this crisis. As draconian as that sounds, what other options are there to get people to stay home, comply with social distancing and stop the spread of the virus?
In
consultation with health officials here in Thunder Bay and in an attempt to
curb the spread of this virus in northwestern Ontario and to safeguard the
health of everyone, especially of the elderly and most vulnerable, I am
regretfully making the decision to CANCEL ALL SUNDAY MASSES IN ALL
PARISHES OF THE DIOCESE (Saturday night and Sunday) for the next TWO
WEEKENDS: March 21-22, and March 28-29.
We will
assess the situation for coming together for Masses again on Palm Sunday, April
4-5, 2020 and for Holy Week.
Weekday
Masses can continue in the parishes since crowds are usually much
smaller for these Masses. People using their discretion attending should
practice “social-distancing”, that is keeping one
meter away from each other at the Mass.
No
shaking of hands and Communion is to be received only in the hand.
Funerals are
to be celebrated when necessary and again “social-distancing” should be
encouraged for those attending.
Parishes should provide tissues and hand sanitizers where possible, in
appropriate places in the church or foyers. Washrooms should be kept
clean and sanitized if possible. People should be encouraged to wash
their hands regularly.
People who are feeling even slightly ill, with colds are asked to NOT come
to church until they are better, for the safety of all.
Please encourage your people to view Mass on Television on Vision TV or on the
internet and to pray at home, the rosary or study scriptures on the Sundays
there is no Mass.
Priests may celebrate a ‘private Mass’ on Sunday but without a congregation,
for their own spiritual life. All Catholics are dispensed from the
requirement to attend Mass, on weekends when the Masses are cancelled.
Parishes should put a sign on their doors on the weekends indicating the
situation.
Future
information will be coming for the Mass of Chrism and Holy Week Celebrations,
please stay tuned.