Northern Economist 2.0

Friday 16 June 2023

Recession? What Recession?


With the Bank of Canada’s recent rate hike and the expectation that there may be another hike in July, the talk of an economic slowdown and a recession has ramped up.  There is talk and rumor of looming  recession and that has been underway for some time.  At the same time, another view is that we risk moving into a 1970s style economic environment if inflation is not soon brought to heel. Given the lag between tighter monetary policy and the economic slowdown that would bring inflation down, it is possible that any downturn is still up ahead.  At the same time, the evidence to date suggests the economy is not yet slowing down.  Despite higher interest rates, demand is still being fueled by pent up consumer revenge spending, robust population growth – more people means more consumption spending - and residual post-pandemic savings. 


Figures 1 to 3 show that key economic indicators after post-pandemic re-bound and adjustment remain robust.  Figure 1 presents the Canadian City CPI total inflation rate (from FRED) and while it has been coming down it is still over five percent and high by the standards of recent history.  Figure 2 shows quarterly real GDP growth and while recent growth at about 2 percent is down substantially from the pandemic rebound, it is akin to pre-pandemic growth.  There have been no two consecutive quarters of negative real GDP growth – a traditional hallmark of a recession.  And while 2 percent growth is not great, that is more a long-term productivity growth problem than anything to do with rising interest rates and recessions.  And then there is Figure 3 which shows we are currently at the lowest unemployment rate in over a decade – again more a sign of an overheating economy rather than a harbinger of recession.  


So, it would appear that until there is evidence to the contrary, at least another interest rate increase by the Bank of Canada is in the offing.  The economy is still growing, labor markets are tight, and inflation remains high by historical standards.  The current level of interest rates seems to be compatible with ongoing inflation in the 4 to 5 percent range and is unlikely to bring us to the target 1 to 3 percent range of days of yore.  Keeping inflation at the 4 to 5 percent range is dangerous given that any demand or supply side shock when inflation is already in the 4 to 5 percent range could bring us to double digit inflation – a 1970s style scenario.

Thursday 11 May 2023

Global Aftermath: The Economic and Fiscal Effects of COVID in Canada and the World


The write-up accompanying my report on COVID in Canada and the world released today by the Fraser Institute.  The full report is available here.

Global Aftermath: The Economic and Fiscal Effects of COVID in Canada and the World

The economic and fiscal disruption and associated effects of the pandemic in Canada and around the world were severe and unprecedented. The general effects of the pandemic were to disrupt health, social, governmental, and economic systems. While the impact of the pandemic on Canada and the world was similar, variations in demographics, timing of the spread and response, and other characteristics have meant that the effects on health, the response, and the economic and fiscal impacts have varied across countries.

At 103,874 total cases per million population by June 2022, Canada performed remarkably well: incidence was the fourth lowest among the IMF Advanced Economies. Moreover, of the IMF Advanced Economies, Canada was 27th out of 38 at 1,103 deaths per million population; Japan was the lowest at 248 total COVID-19 deaths per million population. Canada did not fare as well for crude COVID mortality: its rate of 1.1% is the second highest of the IMF Advanced Economies. As for responses to the pandemic, at 227 vaccinations per 100 population, Canada had the 7th highest vaccine uptake rate of the IMF Advanced Economies and the 3rd highest level of stringency in its responses to the pandemic as measured by the Oxford University’s COVID19 Government Response Tracker.

Impact on the economy

Canada’s estimated real per-capita GDP growth was negative and the country ranked 29th out of 40 IMF Advanced Economies and had the second-worst performance of the G7 countries over the period from 2019 to 2022. Canada, during the first pandemic year, had the second worst employment drop of the IMF Advanced Economies at 5.1%, coming in just ahead of the United States. However, during the rebound in 2021, Canada had the second highest employment growth of the IMF Advanced Economies. Canada’s unemployment rate in 2020 of 9.6% was higher than the world average (9.2%), the G7 average (6.6%), and the average for the IMF Advanced Economies (6.3%). According to the International Monetary Fund’s inflation estimates for 2021, Canada was mid-ranked (19th highest) amongst the IMF advanced economies. However, a particularly high proportion of Canada’s inflation appears to be linked to demand-side rather than supply-side factors. As well, Canada ranked 9th out of 30 OECD comparator countries for the size of the increase in housing prices.

Overall, Canada’s performance in controlling COVID-19 incidence and vaccine uptake was good but this was accompanied by lower testing rates for COVID as well as higher crude mortality rates. In terms of economic performance, Canada did not fare well in per-capita GDP growth during the pandemic; employment growth was also low, though this did improve in 2021. Canada was also generally mid-ranked for inflation compared to the IMF Advanced Economies, though it appears to have had a higher proportion of its inflation driven by demand-side factors. Canada’s success in some aspects of dealing with COVID appears to have come at an exceptionally high price, particularly from negative short-term employment effects and weaker per-capita GDP growth.

Impact on the fiscal situation

In 2020, of 194 IMF countries, at an increase of government expenditure of 19.7%, Canada ranked 25th highest in the world for spending. This increase of nearly 20% was well above the world average of approximately 9%, the G7 average of 13%, and the average of the IMF Advanced Economies of nearly 11%. Canada also averaged a 2.2% drop in general government revenue in 2020 according to the IMF, not as severe as the average drops for either the IMF Advanced Economies or the G7.

The world saw its negative fiscal balance widen from 3.6% in 2019 to over 10% in 2020 before starting to decline to under 8% in 2021 and to just over 5% in 2022. According to the IMF, Canada initially saw a negative fiscal balance of about 11% in 2020 from a balance of close to zero in 2019. The fiscal balance for 2020 was later revised to 11.4%, with a revised forecast of 4.7% in 2021 and 2.1% in 2022.

Globally, from 2019 to 2021, the average gross debt-to-GDP ratio rose from 57% to 67%. All together 161 out of 196 countries—nearly 80%—saw an increase in their gross debt-to-GDP ratios from 2019 to 2021. Canada saw its gross debt-to-GDP ratio increase by nearly 25 percentage points from 2019 to 2021, the 15th largest increase in the world. It is worth noting that, of the increased government debt accumulated in Canada during the pandemic, much was incurred by the federal government rather than the provincial governments.

Canada’s fiscal response was especially large and driven mostly by the federal response. In some respects, the ability of Canada to ramp up its fiscal response in time of need reflects its long-term prudent fiscal management and resulting low debt-to-GDP ratio achieved in the decades after the federal fiscal crisis of the 1990s. At the same time, the size of the deficit and fiscal response during the pandemic should not be allowed to become a long-term feature of the public finances given the recent rise in interest rates, especially as it limits the ability and fiscal flexibility for responses to future events.

Friday 5 May 2023

The Rise and Fall of Ontario's Relative Income


As part of my work on Ontario’s fiscal history since Confederation, I have also been putting together long-term series on Ontario output and population.  Such information is useful given Ontario’s historic role as Canada’s largest economy and key industrial powerhouse.  Much of this data is now available at Finances of the Nation which has Ontario nominal GDP back to 1926 as well as population back to 1867 and CPI (for Canada back to 1867).


The larger issue is how to estimate GDP for Ontario prior to 1926.   However, given that Canadian GDP is available back to 1867, using Ontario’s average share of Canadian GDP from 1926 to 1950, one can apply that estimate (0.445) to Canada’s GDP from 1867 to 1925 (also available at FON) and obtain an estimate.  This is not that unreasonable an approach given that past studies have suggested that at the dawn of Confederation, Ontario’s per capita incomes were already nearly 60 percent above Nova Scotia and New Brunswick and 25 percent higher than Quebec.


In terms of Gross Value Added as estimated by Alan Green (Regional Inequality, Structural Change, and Economic Growth in Canada. 1890-1956, Econ. Dev & Cult. Change, 1969) in 1890 Ontario’s economy was 49 percent of the Canadian economy while by 1910 it was at 41 percent and by 1929 it was 39 percent which averages out to 43 percent.  So, the Alan Green numbers are used to estimate Ontario’s GDP for the 1867 to 1925 period using 49 percent to 1890 and 43 percent to 1925. It is important to note that these are estimates and far from perfect, but they nevertheless tell a long-term story.


Ontario’s per capita GDP is plotted alongside the rest of Canada’s (ROC) real per capita GDP in Figure 1.  In 1867, Ontario’s real per capita GDP in $2020 was $3,428 compared to $2,768 for the rest of Canada – a 24 percent difference.  By 2022, Ontario’s real per capita GDP has grown to $66,600 and the ROC’s to $67,258 – practically the same.  What happens in between is a period of per capita income divergence till approximately the eve of the Second World War and then a period of convergence – with a fair amount of fluctuation.  


Figure 2 plots the ratio of Ontario’s real per capita GDP to the ROC’s.  There is a brief period during the wheat boom Prairie settlement era from about the early 1890s to about 1902 when Ontario per capita incomes fall relative to the rest of Canada, but this coincides with both the recession of the early 1890s and the scaling down of the Green Adjustment factor from 0.49 to 0.43 and may be a statistical artifact.  The Ontario per capita income advantage generally rises during the leadup to World War I and continues to rise afterwards peaking in the 1930s.  It then falls as the rest of the country economically develops and grows and by the first decade of the 21st century, Ontario real per capita GDP is pretty close to the average of the rest of the country.  On average, for the entire period 1867 to 2022, Ontario's real per capita GDP has been about 30 percent higher than the rest of Canada. The average since 2000 has only been 7 percent.


Ontario’s early economic advantage and dominance fueled by the economic protectionism of the national policies enabled it to grow its per capita income relative to the rest of the country.  With the economic development and diversification of the post-World War II period and the growth of western resource-based economies, the per capita income difference has fallen.  In many respects, this process of long-term convergence can be viewed as a long-term Canadian economic success story that has seen a muting of regional economic differences  There are of course still regional economic differences in terms of per capita incomes across Canada’s provinces and Ontario is still Canada’s largest economy and one of its wealthiest provinces, but it is not the cash cow you might think it is when it comes to per capita incomes at the moment. 


Thursday 13 April 2023

Revisiting the Federal Finances


In the wake of the Federal 2023 spring budget, it is useful to take a look at the historical picture to see how the present and the immediate projected future fits into the long-term pattern of federal spending.  The key defining issue of recent public finance and government spending was of course the pandemic and the enormous amount of federal fiscal stimulus that was injected into Canada’s economy.  Federal spending rose from $363 billion in fiscal 2019-20 to reach $639 billion in 2020-21 – an increase of 73 percent.  It then declined reaching $480 billion as reported in Budget 2023 but is set to resume an upward trend and is expected to reach $556 billion by 2027-28.  As of the 2022-23 fiscal year, federal spending is 37 percent higher than going into the pandemic meaning an average annual increase in spending of about 12 percent.  This has been funded by deficits which in turn have increased the federal net debt dramatically going from $813 billion in 2019-20 to $1.3 trillion by 2022-23 and expected to reach just over $1.4 trillion by 2027-28.


A key feature of the pandemic is what appears to be a dramatic reversal of the decline in federal program spending as a share of Canada’s GDP – the so-called “federal fiscal footprint”.  Figure 1 uses data I compiled for my 2017 federal fiscal history with updates from the federal Fiscal Reference Tables and Budget 2023 to look at the program expenditure to GDP ratio for Canada from 1867 to 2022 and then projected forward to 2028. Fitting a simple linear trend shows that over time, there has been an expansion of federal program expenditures relative to GDP rising from about 5 percent in the 1870s to about 15 percent by the 1980s and with the COVID expenditure bump approaching 17 percent. 


Of course, there have been ebbs and flows around this linear trend with notable spikes during WWI and WWII.  It is noteworthy that the COVID spending spike represents the second highest federal program expenditure to GDP share with World War II as the highest.  After the spike and drop of the war era, the post WWII period saw a gradual rise in the federal fiscal footprint that saw it rise from about 10 percent in 1948 to peak at nearly 19 percent in 1982 and then decline, reaching 11 percent by 2000.  Since 2000, it has risen with a spike in 2021 at the height of the pandemic that brought the program expenditure share of GDP to 23 percent.  It has since declined to about 15 percent.  However, going into the pandemic it was just under 14 percent, up 1 percentage point since 2014 and the forecast of 15 percent means the federal footprint has returned to the size it had in the late 1970s to mid 1980s. 


Of course, we all know what happened after that.  There was a rise in the federal debt as a result of accumulated deficits and high interest rates that at first squeezed out program spending – note the decline into the 1990s even before the federal fiscal crisis – and then of course the transfer cuts and program expenditure reductions of the federal fiscal crisis. This of course makes the role of debt charges and interest rates of particular interest and Figure 2 plots two series: federal government debt charges as a share of total federal government expenditures and the effective interest rate on the federal net debt (defined as debt charges divided by net debt).  


The period from 1870 to WWI saw a decline in interest rates and not surprisingly a decline in the debt charge share of federal spending.  What surprises most people is that as a result of all the provincial debt the federal government took on at the dawn of Confederation, about 30 cents of every federal dollar of expenditure was going to service the debt in 1867.  Spending on nation building infrastructure such as railways saw debt levels and debt charges accumulate in the 1870s and 1880s but then came the great boom of prairie settlement after 1896 .  World War I saw an accumulation of debt and a rise in interest rates and with the budgetary and economic shocks of the Great Depression, debt charges as a share of total federal spending remained at over 25 percent.  Indeed, there is probably an interesting economic history thesis in explaining why there was a federal fiscal crisis in the 1990s but not the 1920s. 


The post WWII era saw a rise in interest rates that surpassed even the rise of the pre-WWI era and as significant budget deficits and debt began to accumulate after the mid-1970s, debt charges as a share of total spending began to rise.  However, with the positive budgetary balances of the post fiscal crisis era as well as the decline in interest rates, both interest rates and federal debt charges as a share of total spending hit historic lows.  In 2021, federal debt charges as a share of total federal spending was just below 5 percent and the effect interest rate on the net debt was about 1.8 percent.  Those numbers will be ones for the economic history books in the years to come as the debt service share of federal spending approaches 10 percent and the effective interest rate is just under 4 percent.  At least, that is what is currently forecast.

Wednesday 1 March 2023

Is Canada’s Labour Shortage Actually a Productivity Slump?


Despite what seems to be supply side issues of staff shortages, rising demand and inflation in the wake of the pandemic, at least one contrarian view is that Canada’s labour shortage is an illusion. University of Waterloo economist Mikal Skuterud in a recent Globe Oped noted that despite perceptions of a labour shortage, Canadian labour force participation was identical to what it was in October 2018 at 65.7 percent and the absolute size of the labour force at 20.8 million is the largest it has ever been.  The “shortage” may indeed also be a result of the demand for workers in the post pandemic surge growing faster than their numbers.  Indeed, if one looks at the health sector, the supply of physicians and nurses per capita is the largest it has ever been but the post pandemic surge in dealing with postponed surgeries and procedures has been overwhelming.


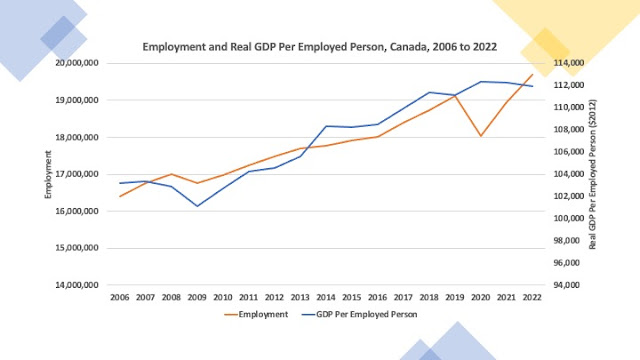
However, the problem may be worse than you might think.  Not only is the size of the labour force the largest is has ever been but so is total employment.  If you look at the number of people employed – producing labour units so to speak - it is three percent higher than it was in 2019.  Employment did plunge in 2020 as a result of the pandemic shutdowns but it has since rebounded dramatically – by over 9 percent since 2020.  As the accompanying figure illustrates, employment is indeed the highest it has ever been.  [Data Sources: Statistics Canada, Table 14100393 Labour force characteristics, annual and 

V62471340 Canada [11124]; Gross domestic product at market prices]


However, despite more people working than ever before, the output response has been shall we say a bit sluggish?  While employment grew by over 9 percent from 2020 to 2022 as pandemic recovery set in, real GDP (in $2012 constant dollars) grew by less than 9 percent.  As a result, output per employed person has actually declined since 2020.  From 2020 to 2022 real GDP per employed person actually fell by just over one third of one percent.


Something has happened over the course of the pandemic that seems to have affected the productivity of Canadian workers.  Perhaps the long shutdown resulted in a deterioration of human capital and skills?  Perhaps the retirement of so many experienced workers and their replacement by less experienced entry level workers has led to output disruptions as new workers learn by doing?  Or, after the trauma of the pandemic, everyone wants more work life balance and as a result we are simply not working as hard as we used to?  Is this simply the aggregate effects of “quiet quitting?”


Such slowdowns in output per employed person are not unique to the pandemic era and based on the chart have occurred before – for example during the Great Recession and also between 2014 and 2016.  History suggests that we do recover from these “productivity” slumps and based on past performance one would expect the same over the next couple of years.  The disruption of the pandemic will take a number of years to fully work its way through the economy and the social fabric of the country.  The bigger problem in terms of productivity is if this time things are going to be different, and the productivity slowdown becomes a permanent feature.  Given that Canada has had economic productivity issues for decades, this latest iteration of an old issue is disconcerting to say the least. 

Tuesday 15 November 2022

The Provinces and Federal Health Transfers


The federal and provincial health ministers meeting in Vancouver last week ended somewhat abruptly without an outcome regarding an increase in transfers. The provinces have been asking for increases to the Canada Health Transfer that would raise the federal share of provincial health spending from 22 percent to 35 percent.  Given that for 2022-23 the Canada Health Transfer to the provinces is expected to be 45.2 billion dollars, such an increase would amount to an additional cash transfer of well over 25 billion dollars.


The provinces maintain that they need the money to deal with an increasingly strained and stressed system beset by labour shortages and the aftermath of the pandemic.  The federal government is leery of simply handing over the money without conditions because of the concern that more money without structural reforms to the health system or some conditions is simply business as usual.  After all, the enhanced transfers of the 2004 Health Accord with its 6 percent annual increase escalator that lasted until 2017 was supposed to buy fundamental reforms and transformative change and yet the same problems persist pandemic notwithstanding.


The solutions here are problematic.  The federal government could simply hand over more money given that health is a provincial responsibility and wash their hands of the matter.  However, given their concerns that the provinces may not necessarily spend the money on health given they are almost as busy as the federal government in handing over rebates and assistance to deal with inflation, they are unlikely to do so.  They could proceed unilaterally and create a grant with conditions that provinces could accept if they wished or otherwise deal with the matter on their own – probably by increasing their own source revenues (i.e., raise their own taxes) . Or they could simply do nothing and wait for the provinces to come around.  After all, health is a provincial responsibility and the blame for a lack of family physicians or crowded ERs ultimately lands at the feet of provincial governments.


Of course, in dealing with the issue it is perhaps useful to look at some indicators to see what the dimensions of the problem might be.  The accompanying figure plots the average annual growth rates from 2008 to 2022 for an assortment of health spending, fiscal and economic indicators. This period includes both the pandemic as well as the 2008-09 Great Recession - both periods that saw surges in federal spending including transfers.  This period also coincides with the 2004 Health Accord and its immediate aftermath.  The results are intriguing given that they provide some support to both sides in this debate.


The average annual growth rate (all growth rates here are nominal) for total federal transfers was 5.6 percent with the component Canada Health Transfer and Equalization growing at 5.2 and 4.1 percent respectively.  Provincial-Territorial government health spending over the same period grew at an annual average of 5 percent – slightly below the rate of growth of the Health Transfer.  Needless to say, score one for the federal side.  Moreover, total provincial-territorial program spending (including Health) grew at 4.8 percent which means that program spending net of health was also growing slower than health. Score one for the provincial side – the money is not necessarily going to other programs.  P-T health spending is growing faster than either nominal GDP or population (though once inflation and population growth are factored in it means that per capita spending growth has been rather anemic). 


Nevertheless, total P-T health spending has grown faster than GDP, but provincial-territorial own source revenues have grown slower than GDP while the value of the much-vaunted federal tax points have grown at nearly the rate of GDP.  Here, the federal government can claim that there is indeed own source revenue capability on the part of the provinces that remains untapped.  On the other hand, the provinces can claim that they are caught in a bind – on the one hand they are trying to bend the cost curve to address sustainability issues (hence the anemic per capita growth rate) while on the other hand the high growth rate of total population plus the aging of the population is adding to total health spending at a rate they are having difficulty coping with.


Is there a solution here?  In the absence of a unilateral federal move of transfers with conditions (which is not going to work for everyone) the only solution here is a political one and if the two sides are not talking it is a long way off.

Thursday 20 October 2022

Ontario Housing Prices Coming Down

The pandemic era in Canada saw a thirty percent increase in housing prices that were already high as a result of a decade of low interest rates and rising demand due to population growth.  However, a combination of rising interest rates led by the Bank of Canada in an effort to curb inflation, the inevitable subsequent slowdown in the economy, as well as inflation reducing the household resources available for home purchases has meant that home prices in Canada have finally reached their peak and are on the way down.  The latest Teranet-National Bank Housing Price Index Release shows that the National Composite House Price Index fell 3.1% from August to September, the largest monthly decline on record since the index began in 1999 and exceeded the previous month’s record decline of 2.4%. Needless to say, Ontario did not escape this trend but despite the drop, prices are still higher than they were a year ago.


 Figure 1 shows that year over year (September to September), prices were up in 15 out of 16 major Ontario cities with the exception being Peterborough.  The largest percentage increases year over year have been in Greater Sudbury, Kingston and Kitchener-Cambridge-Waterloo.  Thunder Bay's increase over the last twelve months was just under 4 percent.  However, prices are down from their peak in all of these cities as illustrated in Figure 2.  Most of these cities saw their prices peak in May of 2022 with the exceptions being Belleville, Kitchener-Cambridge-Waterloo and London  (peak in April 2022), Ottawa-Gatineau (peak in June 2022) and Thunder Bay (peak in July 2022).  


The largest declines since peak price have been in Windsor (16.2 percent), Oshawa (16.4 percent) and Peterborough (23.2 percent).  Meanwhile, the smallest declines since peak price were in Thunder Bay (5.7 percent), Greater Sudbury (6.1 percent) and Ottawa-Gatineau (8 percent).  Northern Ontario cities like Thunder Bay and sudbiury are not immune from national or provincial trends but they have historically not been as subject to the same fluctuations as other cities.  In Thunder Bay for example , the housing price boom while substantial relative to its historic prices was nevertheless more muted than the GTA.  The downturn will likely be similar.  It is probably no coincidence that to date the price drop in Thunder Bay, Sudbury and Ottawa-Gatineau has been the least of these 16 major cities as all three of these cities have an economic base of broader public sector employment at 30 percent of jobs or more (in the case of Ottawa- Gatineau) which provides a substantial economic stabilizer when the national average in closer to 20 percent.

Given that interest rates are expected to rise substantially next week as  inflation really shows no signs of abating in Statistics Canada's latest release, one should see the price decline continue into the fall.


Sunday 2 October 2022

Saving Data: The Canadian Regional Historical Wealth Microdata Collection


As an economic historian, much of my work involved the collection and analysis of individual level and regional wealth data from late 19th and early 20th century central Canada.  This work began in the 1980s with my thesis on wealth in Wentworth County under Peter George at McMaster and became a long term career project that used probate and census data to look at the determinants of Canadian wealth holding as well as its distribution.  After 30 years, the responsible thing to do was to try and find a home for the data and in this regard I am delighted to announce that after conversations with Sara Janes at the Lakehead University Library Archives, a home has been found for the data collection and it has migrated so to speak.  While the full electronic access to the data files is still in progress, the collection now has an entry point.  A fuller description of the data set is available at the Archives site.


The data in the Canadian Regional Historical Micro Data Collection consists of over 12,000 probated decedents in Ontario and Manitoba for the period spanning approximately 1870 to 1930.  In terms of the components housed at the Lakehead University Library and Archives, there are:


1)    Canadian Historical Regional Micro-Data Collection: Survey Sheets: Approximately 12,000 estate files recorded on 3 to 5-page survey sheets (8” by 11”) comprising approximately 25 linear feet of material.

2)    Canadian Historical Regional Micro-Data Collection: E-Files: 11 sets of e-files in excel format with accompanying coding information, approximately 30 MB of data.

3)    Canadian Historical Regional Micro-Data Collection: Microfilm Resources: Several boxes of microfilm of estate files for Ontario in 1892 and 1902 and the Thunder Bay District, 1885 to 1930. Note that these will become part of the Northern Studies Resource Centre collection of the Paterson Library.


The work involving data collection and research has occurred over more than 30 years starting in the late 1980s with thesis research for a PhD in Economics at McMaster University, Hamilton and then occupying the bulk of an academic career at Lakehead University.  Along with the SSHRC Doctoral Fellowship that funded the PhD (1986-1990) and the collection of the original Wentworth County estate files, there were three additional SSHRC Standard Research Grants (1991-94; 1999-02 and 2007-10) which helped put together the rest of the data. 


The historical probate wealth micro data was collected for four regional areas: they are Wentworth County, Ontario (1872-1927), Thunder Bay District, Ontario (1885-1927), Ontario (1892, 1902) and Manitoba (1873-1927).  Along with over 12,000 estate files collected in hard copy survey sheets which are now housed in the Lakehead University Archives, there are electronic data sets that have been generated that will eventually be available through hyperlinks through the provincial Permafrost digital data preservation system.  Much of the wealth and asset information as well as personal information on the survey sheets has been placed in Excel spread sheets.  Variables include gender, occupation age at death, wealth, portfolio composition, religious affiliation, birthplace, etc…However, there was substantial anecdotal and personal information taken down as well as details on bequests and estate division that was never coded and inputted and is still available in the paper-based survey forms.  There is still research that can be done by coding and inputting the estate division details and subsequently analyzing it.  While some preliminary work was done with Wentworth County in this regard and available for Wentworth County 1872 to 1892, funding for this last stage never materialized and remains undiscovered country. These decedents are also a potential resource for anyone doing genealogical research.


So, this is a preliminary message. When the data links are fully up and running, I will do another post.  Until then, if there are questions about accessing the collection including the electronic data in advance of full hyperlink access, they can be directed to Sara Janes at the Lakehead University Archives [sjanes1@lakeheadu.ca (807) 343-8272].  Again, my thanks to the Lakehead University Archives for helping preserve this data for future research work.


Friday 8 July 2022

The Shape of Labour Force Things to Come


If the June 2022 Labour Force Survey is part of a trend, Canada’s labour shortage issues are going to be getting worse.  On the positive side, the unemployment rate reached a new consecutive low of 4.9 percent in June and politicians with vested interests will no doubt seize on this as good news.  On the other hand, total employment fell in June by 43,000 jobs with the employment loss almost entirely due to a decrease in workers aged 55 years and older.  As well, the number of self-employed workers fell by 59,000 (2.2 percent) while the number of employees in both the public and private sectors held steady.  Dig deeper, and the long-term trend shows self-employment declining while public sector employment has grown over the last few years – not exactly good news for the health of the business sector.  And, as final points, the size of the labour force between May and June shrank by 97,500 while the participation rate in the economy shrank from 65.3 percent to 64.9 percent.  Remember that this is the start of summer, usually when things pick up.


So, what is going on here? I like to term this the Thunder Bayization of Canada’s economy.  For quite a few years now, Thunder Bay and indeed much of northern Ontario has seen low unemployment rates.  These are usually touted by local community leaders as good economic news.  After all, if the unemployment rate is low what could be better news than that?  Except, the problem is that in the case of Thunder Bay, both the labour force and total employment shrank permanently after the forest sector crisis nearly twenty years ago and has never really recovered.  Moreover, with the aging of its labour force, the local labour force has shrunk faster than employment hence resulting in a decline in unemployment rates.  Total employment has shrunk.  This continues as even the June 2022 labour force shows that in Thunder Bay since May the labour force and total employment both fell though this time employment fell a bit more than the labour force so that the unemployment rate rose slightly to 4.3 percent.  Think about it – a chronically depressed city-region with an unemployment rate below the national average of 4.9 percent.


There is a lot going on here but basically, the two-year pandemic hiatus of less work with substantial government benefits, the continuation of extended EI benefits and accumulated savings have caused a shrinking of people ready and willing to work.  Combine that with an aging labour force – about 20 percent of the labour force and employment is people aged 55 and over – and the start of retirements which has probably also been accentuated by the pandemic.  Indeed, one suspects that for some the CERB was a nice early retirement/buyout package courtesy of the government.  Then there is the pandemic toll on small business and the resulting shrinking of self-employment also.  Put it all together, and you have the start of a growing and continuing labour shortage in Canada. 


Thunder Bay can function in an economy where the number of people shrink, and inflows of assorted government transfers keep the economy going.  However, can this be a sustainable future for an entire country where more and more people simply withdraw or retire from the labour force and the number of people available for work and employed shrinks?  Can an economy where everyone wants to enjoy the consumption of goods and services exist alongside one where there are not enough people available to work?  In the absence of immigration, this would probably be worse.  Food for thought.


Wednesday 15 December 2021

Analysis: Federal Economic and Fiscal Update Fall 2021


Yesterday’s federal economic and fiscal update has been lauded as showing an economy doing much better than expected as well as improved federal finances relative to the spring 2021 budget.  In the end, the recovery from the depths of the pandemic has been much better than was anticipated and this has resulted in federal government revenues much greater than was forecast last spring.  Figure 1 shows that revenue is expected to be billions of dollars higher in each fiscal year up to 2025-26. – as much as 20 billion dollars more in some of the years.  Indeed, over the six years from 2020-21 to 2025-26, total additional revenues are expected to total about $106 billion.


However, as Figure 2 illustrates, that is being accompanied by a parallel process on the federal expenditure side.  Aside from 2020-21 which has turned out to have about $6 billion less spending than expected, the other years will see higher additional expenditures than originally forecast ranging from $7 billion to $15 billion.  Over the entire six-year period, the federal government will be spending an additional $54 billion than was laid out in the spring budget.  So, about half of the new revenues are going into additional spending while the other half enables the government to have a smaller deficit than planned in each of the years ahead.  


Whereas the spring 2021 budget saw a deficit (including actuarial losses) in 2021-22 of $154.7 billion, it is now forecast to be $144.5 billion.  By 2025-26, the deficit (including actuarial losses) is now expected at $13.1 billion whereas before it was going to be $30.7 billion.  Naturally, smaller deficits down the road will result in a smaller net debt and smaller net debt to GDP ratios given the projected GDP growth.  So rather than a net debt of $1.529 trillion by 2025-26, it should only be $1.359 billion.  The world should last so long.


Two things have been left unsaid about the updated numbers.  First, when all is said and done and the COVID-19 spending bubble wound up circa 2022-23, spending will be about 22 percent higher than it was in 2019-20.  Put another way, COVID-19 aside, federal spending will have grown at just over 7 percent a year.  The pandemic in classic Peacock-Wiseman fashion has provided an opportunity for the federal government to expand its spending and there has been an upward shift or displacement that is going to remain permanent. 


Second and more disturbing is if one accepts the average federal government inflation forecast over the next five years of 2.6 percent and adds in population growth of just over 1 percent annually, then the average nominal GDP growth of 4 percent from 2022 to 2026 is eaten up by inflation and population growth such that real per capita GDP after the post COVID rebound is essentially going to be flat after 2022.  If inflation turns out to be higher at say in the 4 to 5 percent range, then we are looking at a decline in real per capita GDP over the same period. There is not going to be any real growth.  That is the disturbing aspect of this update.  There is going to be a permanent enrichment of federal spending but not in the actual real economic growth of the economy. 

Sunday 5 December 2021

Inflation and Unemployment

 My most recent post on the Fraser Institute Blog dealt with an international comparison of inflation and unemployment. Enjoy.


Unemployment and inflation—Canada’s worrying numbers


With the inflation debate in Canada focusing on whether this inflation is transitory or not, we’ve seen little discussion about how our inflation compares with other advanced economies.

The International Monetary Fund released its update of the World Economic Outlook Database in October and there are now updated estimates for 2021 and beyond. While monthly consumer inflation in Canada (according to Statistics Canada) is currently pushing 5 per cent, our consumer inflation for 2021—as estimated by the International Monetary Fund (IMF) using consumer prices—is expected to be closer to 4 per cent.

For the major 35 IMF advanced economies, consumer inflation in 2021 is expected to average 2.8 per cent, putting Canada well above the average. The rates are expected to range from highs of 7 per cent for Estonia and 5 per cent for the United States to lows of just under 1 per cent for Switzerland and Japan. At 3.8 per cent, Canada’s inflation rate for 2021 is expected to rank 6th highest of the 35 IMF advanced economies.

Of course, some might argue that a little inflation might be just the lubricant needed to help pandemic-stricken economies rebound given the traditional macroeconomic relationship (provided by the Phillips Curve) between inflation and unemployment, which posits an inverse relationship between the two variables. That is, high inflation rates have been associated with low unemployment rates whereas lower inflation rates have often been accompanied by higher unemployment rates.

This would suggest that across these countries, if Canada has a higher inflation rate, then it should also have a markedly lower unemployment rate.

However, that does not appear to be the case. Again, the IMF estimates for 2021 reveal an average unemployment rate for the 35 IMF advanced economies at 6.2 per cent with Canada again above the average at 7.7 per cent. The highest rates are just over 15 per cent for Greece and Spain while the lowest are expected in Japan and Singapore at just under 3 per cent. Indeed, Canada is expected to have the 8th highest unemployment rate of these advanced economies.

Higher unemployment and higher inflation—once termed “stagflation”—is a truly miserable macroeconomic outcome. Indeed, the sum of the inflation rate and the unemployment rate has been dubbed the Misery Index and a quick calculation of this index for these advanced economies puts Canada in the 6th highest spot. As the chart below illustrates, the most “miserable” advanced economies in 2021 are expected to be Spain, Greece, Estonia, Latvia, Italy and Canada with the combined sum of the inflation rate and the unemployment rate ranging from 17.9 per cent to 11.5 per cent.


At the bottom in terms of misery are Taiwan, Singapore, Switzerland and Japan ranging from 5.4 per cent to 3.5 per cent.

For Canadians, the adage that misery loves company will be cold comfort given the higher costs of food, energy and rent that have marked the last few months. While many might argue that our inflation is not as severe as that of the U.S., with our unemployment rate remaining higher than other countries (including the U.S. at 5.4 per cent), Canadians are indeed left wondering if 2022 will be better or worse.


Tuesday 21 September 2021

Sorting Out the Day After

 Well, the results are in and little has changed at the federal level at least on the surface.  What was viewed as an unnecessary election has yielded the anticipated result - a minority Liberal government with little to show for the effort aside from the expenditure of over $600 million dollars to run a pandemic election. The distribution of seats has changed little.  It may be tempting to conclude that little has changed and it is business as usual but the election does have a number of longer-term implications.  

First, it has introduced Canadians to Erin O'Toole in a major way.  He is now a more visible leader and does position him well for a second run.  He did not do better partly because of the upsurge in support for the People's Party, partly because in the GTA voters decided the Liberal child care plan was more to their liking and partly because the Ontario conservative political machine essentially stepped back.  He now has the opportunity to work at remedying that state of affairs.

Second, all of the three major parties have essentially been weakened and being weak creates insecurity and the prospect of a more fractious and unstable parliament at a time when the pandemic is still on.  The Liberals may indeed argue that we now need to work together to finish off the pandemic but the counter will be that despite a pandemic we had an election anyway so the prospects of being punished for a pandemic election grow weaker as a threat.  Pulling the trigger will be easier the next time for both the liberals as well as whatever party is propping up the government.

The Liberals wanted a majority and did not get one and the acrimony of the campaign means a less civil climate for working together with the other parties.  While the NDP party will still support them, the price for their support will inevitably move upwards but at the same time, given that they did no better than last time, the NDP will not have as much leverage as they might imagine.  And the Conservatives will have a lot of regrouping and thinking to do given their platform in the end did not make the inroads into the urban areas that they would have wanted.

Interestingly enough, in the dying days of the campaign, the Prime minister noted he was willing to consider electoral reform - again.  Of course, why he would now want to abandon a first past the post system that allows him to form a government with barely one third the popular vote is something that remains to be seen.

So, that is where we are at for the time being.


Friday 10 September 2021

Northern Economist Federal Leadership Debate Prizes

 Last evening's federal leaders debate was indeed a performance worthy of commemoration  in an epic poem.  In response to each question, each of them was able to effectively parry, dodge, thrust and spin in a flurry of verbal movement that employed words to soar into a vacuum and then return to equilibrium in exactly the same state before the exchange.  In politics, words are merely a transition from one fixed political point to the same fixed political point without losing anything in the journey.  In other words, rolling politicians gather no moss.

While no one came off particularly badly in the exchanges, no one did particularly well either.  Their deflector shields held up reasonably well in the face of repeated political phaser blasts and photon torpedos and they all managed to limp back to Starbase with their warp drives intact.  Still, each of them managed to convey a lasting impression that can be best summarized by the awarding of prizes to recognize the salient point of their performance.

The I Am the Moderator and You are Not Prize

This of course goes not to any of the leaders but to Shachi Kurl of Angus Reid who as moderator asked most of the questions and was rather zealous in asking questions and enforcing the time limits.  At times it appeared as if she was one of the debaters.

The Deer Caught in Headlights Prize

This goes to Liberal Leader Justin Trudeau for expressions that managed to convey that the debate world around him was not unfolding as it should.  All of a sudden, the idea dawned that perhaps an election in the middle of a pandemic given the government was already able to do whatever it wanted was not the best of ideas.

The Drunken Uncle at Sunday Dinner Prize

This goes to Bloc Quebecois leader Yves-Francois Blanchet for what was probably the most candid and entertaining performance of all, as he said whatever he wanted because after all, despite being at a federal leader's debate, he does not want to lead Canada. 

The Cheshire Cat Prize

Well, the winner here is Conservative leader Erin O'Toole for interspersing his delivery with a wide and constant ear to ear grin. The smile was not enigmatic at all however but an indication that he felt relieved the universe was indeed unfolding as best as it could be expected to under the circumstances.

The Enemy of Billionaires Prize

Who else can this be but NDP leader Jagmeet Singh who believes all of Canada's fiscal needs can be met by taxing billionaires.  To his credit, Mr. Singh is numerate and he knows that there are currently 44 billionaires in Canada.  I would expect the number to decline should his party form the government.

The School Teacher Prize

And finally, this prize goes to Green Party Leader Annamie Paul who in cool calm and measured terms tried to calm the room of errant school children with educating answers.  One wonders if this approach will work with the rest of the Green Party?

And there you have it.  It really is the end of civilization as we know it.


Sunday 5 September 2021

Do the Liberals Deserve a Majority?


This election is only about whether the current governing party deserves a majority.  It is not about who is the best steward of the economy, who has the best housing plan, who can manage the pandemic best or even issues like what should Canada’s foreign policy or trade policy be in the currently fractured world.  It should be about all these things, but these things are only a veil for what is the real issue.  Given a minority government that appeared to be working, was an election during a pandemic for the sake of trying to get a majority something the current governing party should be rewarded for?


That is a good question.  The answer really depends on what happens after this election.  If the Liberals get their majority – a prospect which currently appears problematic– then the federal business of government will continue pretty much as it has whether you like it or not. The rolling of the dice will have been rewarded with the anticipated prize and the universe will unfold as Liberal strategists desired. 


If there is a Liberal minority, then all was for naught, and we are back to a minority government that requires the support of at least one of the other parties - but the mandate of the Liberal minority will be weaker.  While they are still the government, they did not get their majority and the prospect for good relations with other parties after the rancor and rhetoric of an unnecessary election will shorten the life of the next parliament considerably.  It is a recipe for more unstable government, but with some continuity in dealing with the resurgent fourth COVID wave given the Liberals will still be in charge at least for a short time.


Suppose there is a Conservative or for the sake of argument an NDP minority government.  Then once again we have a prospect for unstable and short shelf-life government and probably a fair amount of chaos during the transition.  As the fourth wave grows, we will be busy watching to see who the new cabinet will be and what the policies transpire and who is going to be supporting the government and who is not.  Will the Liberals swallow their pride and support a conservative or NDP government?  Or will they simply retreat into sniping mode and leave the heavy lifting to the Bloc?  It is not a good prospect.


There is of course the possibility of a Conservative majority which solves the problem of the instability of a minority government.  However, there is still the prospect of transition. Ministers will be learning their portfolios and there is always the risk that if you change horses mid-stream, Canadians will simply fall into the creek.  In the end, one might argue it does not matter what happens.  After all, Canada’s political parties are really all middle of the road or centrist parties and all of them in the end will do pretty much the same thing but with differences in speed and intensity.  The NDP are simply Liberals in a hurry and the Conservatives are slower Liberals and Liberals are whatever they think Canadians want them to be. 


Moreover, politicians are merely actors on a stage and the real decision making and business of state is done by the civil servants, and they are not going anywhere. Still, in the end, political leadership matters.  Vision and inspiration matter.  Prime Ministers matter because even if scripted some deliver their lines better than others while others interpret the role in unique and uplifting ways. Or at least they should.


I guess, the real question is should you reward the Liberals for going to the polls during a pandemic and risking the aftermath of chaotic instability of government and transition during a rising fourth pandemic wave?  Should they be rewarded for opening such a can of worms? The answer to that is invariably complicated and can best be summarized as simultaneously both Yes and No.   Think of it as an election variant of Schrodinger's cat.