The new Thunder Bay
City Council that will be elected in October of 2018 will have a number of
economic and social challenges on its plate but there is one item that should
be a source for celebration.The year
2020 will mark the 50th year of the amalgamation of the twin cities
of Port Arthur and Fort William and the rural townships of Neebing and McIntyre
to form Thunder Bay.The urban history of
the Lakehead communities actually goes back to the late nineteenth century and both
Port Arthur and Fort William obtained city status in the first decade of the
twentieth century as the great boom drove their urban growth and
development.
I always thought it
was somewhat of a shame that not more effort was made to celebrate the
centennials of the twin cities circa 2006-07 but I suspect the history of urban
rivalry between the two cities was such that no one really wanted to deal with
it.However, we now have an opportunity
to celebrate amalgamation and I think it should go beyond simply a number of
commemorative events and the publication of self-congratulatory histories.I think an effort should be made to leave behind
something concrete that adds to the city’s environment and is a legacy for the future.
As a result of its
urban history of being two separate cities, Thunder Bay has always lacked a more
centrally located focal point that could serve as a gathering place for the
public to celebrate events.Many cities
around the world often have public squares or sites that can serve as gathering
points for celebrations and events and that act as emblems for the city.Think of Trafalgar Square in London, for example
or Washington Square or Times Square in New York or the iconic four columns in
Barcelona.
We of course cannot
reproduce these types of landmarks nor should we but I think as a city we can
take the step of creating a public space that celebrates the creation of
Thunder Bay as well as points the way to a future that includes all its
residents.Somewhere in the Intercity
area, preferably close to the banks of the McIntyre River – the old boundary
between Port Arthur and Fort William – we should consider putting into place
what I would like to call Unity Circle.It would be a celebration of amalgamation and the bringing together of
the twin cities to form Thunder Bay and would also look towards the future by
including First Nations.
Unity Circle would be
a public space in the Intercity area that would contain a number of columns - I suggest six large columns of
identical height arranged in a circle with the columns representing the original four
municipalities that came together to form Thunder Bay, the City of Thunder Bay
and Fort William First Nation. At the center of Unity Circle there would be a
flame that would burn perpetually. I
think a message of unity is very important given the many social challenges
that have faced Thunder Bay over the last decade and may help represent a way
of moving forward into the future.
So, it is just an
idea.The actual piece of land and
location is of course one of those details best left to the politicians and
administrators and community leaders who make these decisions.The design of the space and a suitable set of commemorative structures is also of course up for discussion and debate. What is most important right now is the concept. The concept of a Unity Circle is something
that celebrates our history and looks forwards by leaving the legacy of a
substantial central public space that could form the focus of future public
community events.I think it is worth
consideration.
The creative arts are a fundamental component of life and the human experience. Northern Ontario and Thunder Bay in particular are blessed with vibrant and engaged arts communities whose creative work and activity deepens the regional quality of life. In Thunder Bay, a vital component of the creative arts is the Visual Arts Department and associated programs at Lakehead University where the faculty and students have been contributing to the regional arts scene for decades. Many generations of artists have acquired and honed their skills in the facilities and programs of Lakehead's Visual Arts Department.
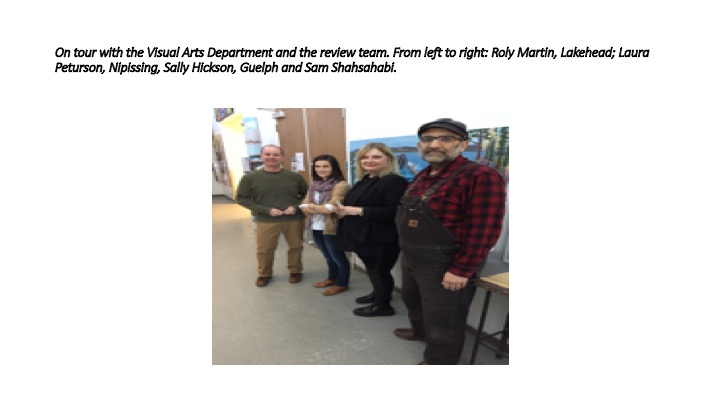
This week, I received an in depth immersion in visual arts and the creative process as a result of my role as a reviewer for the Quality Assurance review of the visual arts program at Lakehead University. I joined Sally Hickson from the University of Guelph and Laura Peturson from Nipissing University and spent two days visiting with staff and students at the Visual Arts Department at Lakehead. It was certainly an illuminating experience learning about the different streams of the program and it was an eye opener learning about the capital intensity of the program given the facilities and equipment required to mount a quality program in the arts. It was quite instructive learning about ceramics, printmaking, painting, drawing and sculpture.
The students and faculty of the Visual Arts program regularly exhibit at the Thunder Bay Art Gallery as well as with other private galleries and their work is an impressive contribution to the region's cultural assets. Much of their work is also showcased on campus and the recent opening of the Alumni Commons at Lakehead provides an attractive venue for their work. All the best to the students, faculty and staff of the Visual Arts Department at Lakehead University.
We are about six
months away from Thunder Bay’s next municipal election and the race for the
mayor’s chair and council spots represents an opportunity to examine directions
and priorities.The last election was
obsessed with the event centre and the issue was a distraction from important
issues such as the sale of municipal public assets, economic development, the
city’s economy, the sustainability of municipal finances as well as the ongoing
saga of infrastructure renewal and in particular the James Street Bridge which
has now been closed to vehicular traffic since 2013.
Sadly, with the
exception of the events centre, which has ridden off into the sunset for the
time being, all of these other issues are still ongoing.And of course, added to all of these issues
are those with respect to relations with First Nations as well as court cases
involving the city’s politicians and administration. Needless to say, Thunder
Bay has garnered an inordinate amount of negative attention on the national
stage in areas under the purview of municipal government and such attention is
certainly not a magnet for business investment.
When it comes to
economic development and the city’s economy, it remains that both population
and employment
levels in the city have been flat for the last four years.The low unemployment rate in the city results
from a labour force that has shrunk faster than employment and of itself is not
a positive harbinger for the future.Waiting
for the Ring
of Fire to kick start the economy appears to be a process akin to Waiting for Godot
and all the talk of smelter locations in the world will be of no avail given low
current chromite prices.As for the
current trappings of prosperity in the city, they are largely the result of a
large public sector and associated public spending which after the June
provincial election could very well come to a crashing halt.
Of course, even without
long term private sector wealth creation, the illusion of prosperity created by
public sector spending has helped fuel municipal
government spending and tax increases which over the last few years have
averaged above the city’s inflation and GDP growth rates.Moreover, there has been a continued shift of
the tax burden onto the residential ratepayer and they now account for about 70
percent of tax revenues.Added to this
are the continued steep increases in user fees and charges which given the talk
about “rainfall
taxes” show no sign of abating anytime soon.
Indeed, the thirst for
residential tax revenues also results in city council giving the go ahead to
new urban residential developments outside core areas that while adding to the
tax base in the short term also add to urban sprawl and require municipal servicing
whose maintenance will add to city expense in years to come.The sustainability of this type of short term
development formula should be a topic for debate and discussion but again it is
an issue the politicians are happy to ignore when it comes to an election year.
So, what is to be
done? Well, for starters Thunder Bay residents need to pay closer attention to
the fiscal, economic and social issues affecting the city and ask candidates more
pointed questions about what solutions might help address the situation.Perhaps one should ask why anyone might want to buy
a new house in Thunder Bay if the property tax bill for a new bungalow is going
to be in the range of $5000 to $7000 onto which will be added another $1000 a
year in water and sewer charges.
Given the length of
tenure that many current members of council have had, a legitimate question is
whether or not Thunder Bay might not be better off with a substantial transfusion
of new blood on City Council with new ideas and new energy to look at new ways
of doing things.After all, current
members of City Council have generally been the most comfortable with solutions
that involve raising taxes and spending more money.While the claim is often made that millions
in efficiencies and savings have been implemented, the fact is the tax levy continues
to grow which means total spending is going up and not down.
Making Thunder Bay’s
next municipal election count requires making an effort to create real change
in the way municipal issues are dealt with and that requires some new blood. It
truly is time for change.
Statistics Canada has released its recent sub-provincial population estimates for 2016/17 and the results find that
population is still growing faster in the Prairies
well as parts of Ontario but the two major northern
Ontario CMAs are not in the pack.According the Statistics Canada, the 10 CMAs with the highest population
growth in 2016/2017 were in either the Prairies or Ontario. In 2016/2017, the
population growth rate was 2.0% or higher in four CMAs: Saskatoon (+2.8%),
Regina (+2.4%), Guelph (+2.2%) and Ottawa–Gatineau (Ontario part) (+2.2 and were
followed by Toronto (+1.9%), Oshawa, Winnipeg, Edmonton and Calgary (+1.8%
each), and Kitchener–Cambridge–Waterloo (+1.7%). The figure below shows the picture pretty clearly.
At the bottom of the rankings are Sudbury,
Thunder Bay and Saguenay.Sudbury is
third from the bottom with a population increase of only 0.1 percent.The population decreased in the Saguenay
(-0.2%) and Thunder Bay (-0.1%) CMAs for the fourth consecutive year with
Saguenay’s population decrease partly attributable to out-migration of young
adults aged 18 to live elsewhere in Quebec. In Thunder Bay, the number of
deaths surpassed the number of births, and has done so since 2006/2007,
contributing to its population decline.
Thunder Bay City Council
has voted to pass the 2018 municipal budget and will formally ratify it at a
vote this evening.The Mayor and Council
have of course been patting themselves on the back about how it is a “responsible
budget” and how it keeps the tax levy increase in spending within the average
of the last two terms of council.The tax
levy increase is now coming in a 2.4 percent now – just above the rate of
inflation - which is down from the 3.03 percent increase that was originally on
the way after several weeks of deliberation and debate.This was managed by essentially taking out
about $1 million from the city reserve fund to lower the levy against the
advice of City administration it turns out who also noted that the reserves –
used to cover unexpected costs or deficits throughout the year - have been
declining since 2012
What this all really
means is that this is an election year.The average municipal tax revenue increase over the period 2011 to 2018
has averaged 3.3 percent and ranged from a high of 5.7 percent in 2015 to a low
of 2.2 percent in each of 2014 and 2016.The increase of 2.2 percent in 2014 was also during an election year and
was followed by a 5.7 percent increase in 2015.Keeping the increase low this year can be interpreted as a deliberate political strategy to not raise
the ire of ratepayers in the lead up to the October election and one can expect
a hefty increase to make up lost ground when the 2019 budget comes in.
In the end, a tax levy
increasing at just above the rate of inflation is not much of an accomplishment
given that it was done by dipping into the reserve fund.While much was said during council debate
about the hard decisions that have been made the fact remains that spending is
going to go up by the amount originally agreed upon – just over 3 percent – but
it is going to be subsidized by borrowing from the reserve fund.
But then, cost control
is hard work and in the end some of the efforts at cost control have
backfired.One need only look back at
the attempt by Thunder Bay to reduce garbage collection costs in 2017 which
were supposed to eliminate a truck and labour costs via attrition while at the
same time reducing bag pick-up to two bags from three with additional bags
requiring a tag.And what was the end
result?After a period of chaos, the truck
was reinstated but the three-bag limit was not and things have remained very quiet since.So, one has to conclude that costs have remained the same while less
garbage is being collected and revenue is probably up for the City from the bag
tags. It was certainly a win for the City of Thunder Bay but not for rate
payers who altogether have to pay more but are getting less.
We can expect more of
the same next year after the dust clears from the election.The current cast of councilors will largely
be returned to office and the cycle will start anew. We will be paying more and
getting less, and the debut will be a hefty tax levy increase to replenish the
reserve fund as well as boost spending to make up for the previous year’s
slowdown. There will be the usual
grumbling and complaints, but they will be dismissed because after all Thunder
Bay voters are the ones doing this to themselves by falling for the same thing election after election. Why would city politicians take them seriously
when they complain?
Additional Note: February 6th - Well, the budget did pass last evening. Please note that the 2.4 percent levy increase coming in is "net" or after factoring in "new growth". The gross levy increase is actually 3.13 percent. Originally, the net increase was going to be close to 3 percent and the gross increase nearly 3.6 percent. So, total spending is still going up 3 percent and the net is 2.4 because of the use of projected surplus funds from 2017 budget away from the reserve fund and towards the tax bill. However, apparently there was an effort to move even more of the projected 2017 budget surplus away from the reserve but it did not succeed. Of course the 3.13 percent does not mean that everyone's tax bill will be going up 3.13 percent or 2.4 percent if you are an "existing" ratepayer. That is the total increase in tax financed expenditure. Much of the burden of the increase will go to residential ratepayers. See my post last month here for a more detailed discussion.
Here are the economic news stories that have caught my interest over the last little while in northern Ontario. The start of the new year has been a bit slow when it comes to economic news in the region but then there is so much else going one politically, economically and otherwise in Ontario, Canada and the world especially as we move into a critical phase with the NAFTA negotiations and the start of election campaigning in Ontario in the run up to the June election.
Well, this looks like a creative way to try and create some type of downtown event centre/conference facility in Thunder Bay. Of course, you can add Victoriaville as well as the empty Sears store at intercity to the list of underutilized space in Thunder Bay. Personally, it would be nice to see the Sears store retooled in a circular two level galleria space of small stores around a public space that could be used to house the farmers market. The only problem would be to find tenants for the small retail spaces given that rents at the ISC are apparently pretty steep.
The airport's economic role in the city of Thunder Bay and region continues to grow. Passenger volumes in 2017 were 844,627 which represents an increase of 4.6 percent from 2016. Since 1997, this represents an increase of over 60 percent.
In not so positive transportation news, cab fares in Thunder Bay are going up by 15 percent. They were already quite high. And if that is not enough, it looks like the increase in Thunder Bay's tax levy is going to stay at around 3.6 percent as the budget remains pretty much unchanged. Living in Thunder Bay does sometimes seem like a sort of reverse Walmart marketing jingle - pay more, get less.
On Feb. 6-7, the Greater Sudbury Chamber of Commerce will host its
inaugural PEP (Procurement, Employment and Partnerships) conference and
trade show presented by SNC Lavalin in partnership with the Canadian council for Aboriginal Business.
And of interest if you are planning to pursue resource development activities in the region North of 50....
Of course, Sault Ste. Marie is disappointed that they did not make the 20 city short list for Amazon's second corporate campus and joins other disappointed Canadian cities, but not Toronto which remains under consideration.
In North Bay, they are hoping home construction is going to jump start their economy. Not sure where the housing demand is expected to come from but it is important to be hopeful. Perhaps if Toronto gets the Amazon campus, given the cost of housing, Amazon workers will live in North Bay and commute to Toronto.
So that is what has caught my eye across this vast expanse at least economically. One other bright item of news involves this morning's decision in a Thunder Bay courtroom exonerating the Chief of Police. Great to hear. All the best.
My last
post on policing resources in the major northern Ontario cities noted that
all five cities saw an increase in policing resources. In 2000, the largest
number of police offers adjusted for population was in Thunder Bay at 171.6
(per 100,000 of population), followed by Sault Ste Marie at 156, Timmins at
153.1, North Bay at 147.6 and finally Greater Sudbury at 143.1.By 2016, Thunder Bay was still first at 199.5
officers per 100,000 of population.It
was followed by Timmins at 196.2, Sault Ste. Marie at 176.7, Greater Sudbury at
160.7 and then North Bay at 152.6.Growth
in per capita policing resources was greatest in Timmins at 28 percent,
followed by Thunder Bay which saw a 16 percent increase.Next highest growth was Sault Ste. Marie at
13 percent, followed by Greater Sudbury and North Bay at 12 and 3 percent
respectively.
Of course,
the logical question that follows next is what was going on in crime rates over
the same period of time?It should be
noted that policing is much more complex in the early 21st century
dealing not only with traditional crimes but also with new crime areas such as
cyber and internet crime.As well,
social issues in general have been consuming more police resources as well as
new standards of accountability which entail more intensive use of policing
resources when dealing with incidents. Homicide investigation is especially resource intensive. Nonetheless,
a look at crime rates it is still a useful piece of information.
Traditional
measures of the crime rate such as criminal code incidents per 100,000 of
population or per police officer measure the volume of crime.One example is the homicide rate and past
evidence has found the homicide rate declining in northern Ontario in a
manner akin to other Canadian cities with the exception of a recent surge in
Thunder Bay.Another measure of crime is
the Crime Severity Index.The Crime
Severity Index combines both volume as well as takes into consideration the
seriousness of crimes by assigning each type of offense a seriousness weight and
generally serves as a complement to other measures.The index has been set to 100 for Canada in 2006 and enables comparisons
of crime severity both at a point in time and over time.
Figure 1
plots the value of the Crime
Severity Index obtained from Statistics Canada for the five major northern
Ontario cities for the period 1998 to 2016.The severity of crime differs across these five cities in any given year
but all cities have seen a decline over time.The largest declines over time have been in Sudbury and North Bay at 36
and29 percent respectively.Next is
Thunder Bay with a 17 percent decline in crime severity between 1998 and 2016,
followed by Sault Ste. Marie at 16 percent and then Timmins at 15 percent.The good news is that while there are annual
ebbs and flows, crime rates over the long term are down in these major northern
Ontario cities.
Municipal
budget season is upon us and expenditures on protection – police and fire – are
some of the most important areas in which municipal tax dollars are spent. Municipal
police services have the responsibility of ensuring the security of residents,
businesses and visitors to their communities and the basic activities are crime
prevention, enforcement of laws, maintaining public order, assisting the
victims of crime as well as emergency services.Over the years, policing has become more
complex dealing with new types of criminal activity in the cyber age as well as
devoting more resources to social concerns.
One interesting
point of comparison for the five major northern Ontario cities is the number of
police officers per 100,000 of population and the trend in this number over
time.Figure 1 plots Statistics Canada
data on police officers per 100,000 for the period 2000 to 2016.In 2000, the largest number of police offers
adjusted for population was in Thunder Bay at 171.6, followed by Sault Ste
Marie at 156, Timmins at 153.1, North Bay at 147.6 and finally Greater Sudbury
at 143.1.By 2016, Thunder Bay was still
first at 199.5 officers per 100,000 of population.It was followed by Timmins at 196.2, Sault
Ste Marie at 176.7, Greater Sudbury at 160.7 and then North Bay at 152.6.
As Figure 2 illustrates, growth in per capita
policing numbers was greatest in Timmins at 28 percent, followed by Thunder Bay
which saw a 16 percent increases.Next
highest growth was Sault Ste Marie at 13 percent, followed by Greater Sudbury and North Bay at 12 and 3 percent respectively.
Another
point of comparison is spending. The BMA Municipal Reports provide some data on
the costs of providing policing services. The rankings for costs generally
parallel those for police numbers. When the net costs per 100,000 dollars of
assessment are compared (including amortization), in 2016 the highest cost was
in Timmins at $441 per $100,000 of tax assessment followed by Thunder Bay at
$434. Next was Sault Ste Marie at $402, then North Bay at $317 and finally
Greater Sudbury at $299.Naturally, this
ranking is influenced by the richness of the tax base and all other things
given cities with a weaker total tax base can expect costs of policing per
$100,000 of assessment to be higher.At
the same time, over the last decade, all five cities have seen a reduction in
the net costs pf policing per 100,000 dollars of assessment.This could be a function of growth in tax
bases as well as other efficiencies and economies.
It is municipal
budget season in Thunder Bay and the inevitable process of thrust, parry and
spin is well underway. First the thrust: the amount spent by the City of Thunder Bay obtained from
the tax levy is going up by 3.6
percent.Moreover, water and sewer
rates as well as tipping fees at the landfill will be going up by
three percent.In an effort to
forestall the inevitable complaints that these increases are too high, the
resulting parry and spin on the part of the City appears to be as follows.
The 3.6
percent increase in the tax levy will only be a 2.9 percent increase to
existing ratepayers after factoring in assessment growth.According to the budget chair: “This is a budget that
stays the course in terms of not reducing services but maintaining investments
while living within our means.”
Moreover,
much of the increase is going to hire new full-time positions and vehicles for
the Superior North EMS.The paramedic service
has seen call volumes grow substantially in recent years as a result of the
aging population and the opioid crisis. As well, according to the budget chair,
in an ideal world “we would stay below the level of inflation,” but there has
been a reduction in provincial transfer payments.
The efforts
by the City to justify a 3.6 percent increase in the levy – that is in tax financed
city expenditure – are pretty standard.Differentiating between existing ratepayers and “new growth”
conveniently sidesteps the fact that in the end it is all tax revenue coming
from city ratepayers.Arguing that we
are “investing” in services and living within our means needs to be considered
within the context of whether the services are cost-effective as well as the
fact the money is not from some kind of endowment but comes directly from city
ratepayers.
As for the
paramedic service, it would be nice to see some kind of breakdown in statistics
as to exactly what the sources of the increased demand are in terms of case mix
and demographic breakdowns.In an
interview on CBC Thunder Bay radio this morning, the chief of the Superior
North Emergency Medical Services also noted that the city has a large transient
population that is a source of increasing demand.This raises the question as to whether city
ratepayers rather than the province should be on the hook to fund what is
increasing regional demand for emergency health services. However, as noted
above, the province is apparently not very interested in raising its grant
contribution.
The most
entertaining line was the one that ideally, we would see tax increases that stay
below the rate of inflation.The last
four years have seen increases in tax revenue all above the inflation rate suggesting
that this aspiration has yet to be achieved by the current city council.Nevertheless, given that it is an election
year one should have goals and dreams to campaign on.
Given that
it is an election year, it is also important to take a longer term look at municipal
finances – in particular I want to focus on Thunder Bay municipal own-source
revenue – that is tax and user fee revenues and then provide some comparisons
to basic economic indicators for the city. The data on total municipal tax
revenue, residential and non-residential tax revenue, and user fees spans the
period 1990 to 2016 and is from assorted past City of Thunder Bay Consolidated
Financial Statements as well as from the Financial Information Returns (FIR) maintained
for each municipality by the Ministry of Municipal Affairs and Housing.For 2017 and 2018, I use current City
of Thunder Bay budget summaries with the total for 2018 a forecast based on
the tax levy increase of 3.6 percent. From Statistics Canada, I have the
inflation rate - inflation is Ontario’s Consumer Price Index with 2002 as the
base year – as well as median total tax filer income and annual employment for
Thunder Bay. Population figures for Thunder Bay are from the Census of Canada.
One point with respect to City of Thunder Bay financial data
is that the summaries and budget information over the last few years do not seem
to provide the tax revenue breakdown between residential and non-residential
revenue. I suspect the reason for this has less to do with economy of
presentation and more to do with drawing attention away from the fact that the
residential share of tax revenue has risen dramatically. While FIR does provide
this information, unfortunately it only becomes available with a lag and 2016
is the last available complete set of FIR data. Overall, municipal finance data
is rather opaque and difficult to use not just in Thunder Bay but Canada as a
whole.Cities could do better when it
comes to being accountable to their ratepayers via concise, comprehensive and
easy to use statistics.
For the period 1990 to 2016 (but forecast to 2018 for
taxation revenue), Figure 1 plots taxation revenue and its two components –
residential and non-residential taxation (commercial and industrial).It then also plots user fee revenue (water
& sewer and other fees) and then the total of taxation revenue and user
fees. In 2016, tax revenues grew 2.2 percent with residential tax revenue
growing at 3.8 percent and non-residential tax revenue actually declining 1.1
percent.User fee revenue also declined
2.5 percent (despite rate increases the previous year). As a result, own source
revenues in 2016 grew a modest 0.6 percent compared to 5.3 percent the year
before.If one looks only at total municipal
tax revenue, it grew 5.7 percent in 2015, 2.2 percent in 2016 and based on
recent estimates (and not FIR data) grew at 3.3 percent in 2017 and will grow
3.6 percent in 2018.
Figures 2 and 3 provide composition information for
taxation revenue and total own source revenue for the period 1990 to 2016. When
one considers only tax revenue, from a 50/50 split in 1990 the distribution by
2016 had evolved into a 70/30 split.The
residential ratepayer in Thunder Bay now provides the City of Thunder Bay with
70 percent of municipal tax revenue. When the picture is broadened to total
own-source revenue, the residential ratepayer in 2016 provided about 46 percent
of own-source revenue, the non-residential ratepayer 21 percent and user fees –
which incidentally are paid by both residential and non-residential ratepayers
-about 34 percent.
Figure 4 plots the average annual growth rates for total
taxation revenue as well as residential and non-residential tax revenue and
user fees, alongside the growth rates for Thunder Bay’s population, employment
and median total tax filer income and Ontario’s inflation rate.The average annual growth rate for taxation
revenue has been 4.1 percent but residential tax revenue has grown at 5.6
percent while non-residential taxes have been growing at 2.3 percent.On average, both residential and
non-residential taxes revenues have grown faster than either population (-0.2%),
employment (-0.1%), inflation (1.9%) and median tax filer income (2.2%).User fee revenue has also grown faster than
all of these indicators at an average of 5 percent.
So, the 2018 municipal budget year is shaping up to be
somewhat modest in terms of increases at least by historical standards.Total tax revenue is anticipated to only go
up 3.6 percent (as opposed to 4.1 percent) while user fee increases of 3
percent look pretty good compared to average increases of 5 percent.But then, 2018 is an election year and I
suspect that we will be in for some pretty steep increases in 2019 once the
election dust clears.If one goes back
to the 2014 election, that budget year saw a 2.2 percent increase in municipal taxation
revenue but they made up for it in 2015 with a 5.7 percent increase.
It probably is a smart strategy to moderate tax increases in
an election year and then raise them steeply early on in the new mandate so that their memory fades by the time the next election rolls around. It
may perhaps be seen as calculating and opportunistic behavior on the part of
our municipal politicians but it seems to work. Thunder Bay residents keep
re-electing the same people over and over again.
Well, it is the New Year and as always it is a
time of reflection and looking ahead to see what the New Year might bring for
Canada, Ontario, northern Ontario and naturally The Most Serene Kingdom of Thunder
Bay where there is always optimism. Of course, 2017 has been a pretty
tumultuous year but 2018 is also looking turbulent given the
changes poised to take effect as well as events around the globe. However, on
the bright side, the global economy is expected to do reasonably well according
to Goldman Sachs or then perhaps not if you listen
to Morgan Stanley. At least, Canada will not be
Venezuela which FocusEconomics expects to be 2018’s most miserable
economy though Canada is expected to be in the top ten for nominal GDP.
Nevertheless, this year will
certainly be a test of the aspiring nature of current economic policy in
Ottawa and Queen’s Park.At the top of the list, the United States will dramatically
lower business and personal tax rates effective January 1st.The last time this happened in the 1980s, Canada
countered with the federal tax reforms that lowered rates and broadened the
rates.This time, no such response
appears to be coming despite the fact the federal business tax rate in the
United States is expected to fall from 35 to 21 percent.A saving grace is that new US corporate tax
rates will match rather than fall below Canadian
ones.
If the US economy booms in the wake of its tax
cuts, Canada might be expected to benefit from increased trade.Yet, federal economic leadership is adrift on
the trade front given the United States is playing hardball on NAFTA and talks
with China and the Asia Pacific are stalled.The aspirational tone of current trade talks is not bearing fruit given Chinese and American
reactions. Indeed, the possibility is high that Trump will pull the plug on
NAFTA early in the New Year.
On the plus side, we can take solace in the
fact that while the United States is playing hardball on trade, Donald Trump
considers Justin Trudeau a “friend”.One
can only imagine our trade talks with the Americans if Donald Trump was dealing
with enemies. Perhaps we can look forward to a
visit to Canada by President Trump in 2018.
At the federal level, we can also take cheer in
the most recent Federal Department of Finance’s long-term projections (a few days before Christmas when no one is paying attention)
that the federal budget is now expected to be balanced by 2045 compared to the
2050s as forecast in last year’s long-term forecast.Given the international situation with North Korea, the United States, Russia, China, and the Mid-East, the world should last so long.Where is Lester Pearson when you need him?
Added to all this are expected increases in
interest rates for 2018 and the tightening of mortgage rules with a new stress test. The stress test will effectively
function like an increase in the interest rate for home buyers without the added
stress of implementing an actual increase for the Bank of Canada. These changes
are anticipated to have a
depressive effect on Canadian housing markets especially outside of Toronto
and Vancouver.As for Toronto and
Vancouver, being in an economic world of their own, they should only slowdown a
bit.
Things are marginally better when moving into
Ontario. Ontario’s economy has done relatively well in 2017 though NAFTA talks
are inevitably keeping Premier Wynne awake at nights. While Ontario is expected
to balance its operating budget, debt will continue to grow based on the
forecast capital spending ranging from public transit to high speed rail. Yet, it is also not a done deal that Ontario’s era of deficits is over given what appears to be a
ramping up of spending with implications for the future.Moreover, the increase in the minimum wage and other regulatory changes that
are being phased in with respect to employment standards, scheduling, and
overtime mark the debut of a massive experiment.How much change can employers absorb before
throwing up their hands and scaling down their operations?
Ontario is also on track to a June election and
many of the progressive initiatives of the current Wynne government are designed
outflank the NDP given the Conservatives under Patrick Brown have sailed into
the centre of the political spectrum with their policies. The
Wynne government’s policies are aspirations for a more socially just Ontario with less weight placed on trade-off
between equity and efficiency.Along
with the guaranteed annual income experiment, there is also a new youth pharma care
program.
In the end, all three political parties in
Ontario appear to be placing themselves along a centre-left alignment meaning
that Ontarians can expect government spending and debt to maintain their current
trajectories no matter who wins.
Of course, more government spending will be
seen as good news for northern Ontario given the economic dependence on
government. While the resource sector saw some marginal improvements in 2017,
the development of the Ring of Fire still appears to be quite distant though
2018 being an election year one can expect to see a number of positive inspiring announcements with respect to its future.As well, it will be interesting to see if there is any mention of the “success” of the Northern Ontario Growth Plan in the next provincial election
campaign. Any mention of the 25 year plan to boost the economy of northern Ontario that started in 2011 will likely mention the wonderful things yet to come - after all, we have yet to reach the halfway mark.
As for Thunder Bay, its economic engine is government
activity as the core sector with subsequent commercial and retail activity an
economic multiple of this core.It is a
recipe for stability that works given that the city’s economy has been static
in terms of employment for several decades.Rising public sector salaries and incomes provides a base for municipal
taxation and further local public-sector employment and the process will
continue until the flow of public money is constricted – which does not appear
to be any time soon.
Why tamper with perceived success? This means
the current batch of local politicians – provincial and municipal – will all be
re-elected come June and October and everyone will go back to sleep.The northern Ontario economy and Thunder Bay in particular have
become a sort of economic Brigadoon – an isolated sleepy region coming magically to
robust economic life every 100 years.
Yet, despite the evidence of slow economic and employment
growth from Statistics Canada and the Conference Board, its boosters have often maintained that Thunder Bay is one of the fastest growing cities in Canada and with some of the
lowest unemployment rates in the country.That the low unemployment rates in Thunder Bay's case also mean the labour force has been shrinking faster than employment is apparently not seen as a cause for concern.
Given the last real boom period in northern
Ontario was the resource commodity and baby booms of the 1950s and 1960s, we can expect the
regional economy to again awaken circa 2050 – roughly the same time the federal budget is
expected to balance again.By then,
perhaps the federal government will carry the public sector spending ball for
northern Ontario and give the provincial government and municipalities a rest.
A recent TBnewswatch story reported the estimated value of building permits in Thunder Bay in 2017 was up substantially from the year before at 146 million dollars. Based on the numbers presented in the story, the increase in 2017 can be calculated at approximately 55 percent. This is of course an upbeat year end story. Given the coming year will see both a provincial and municipal election, one can expect these types of numbers to be presented by local politicians as evidence that Thunder Bay's economy is doing well. However, it is important to adjust these kinds of number for inflation - that is present them in real dollars - as well as look at more than two years of data.
This is done in Figure 1. Using annual total value of building permit numbers from Statistics Canada for 1998 to 2016 and adding the 2017 estimate from the City of Thunder Bay's Chief Building Official and then deflating using the CPI, the real value (in 2016 dollars) of total building permits is presented. The good news is that 2017 is indeed up from 2016 but there has been an overall downward trend from peaks in real value reached in 2012 and 2013. Over a longer term view, a fitted linear trend suggests that there has been a slight increase in the real value of permits since the late 1990s but the 2017 performance is really not much higher than a decade ago or even two decades ago.
One can view the above chart as good news in the sense that construction activity over time in Thunder Bay over the long haul has been reasonably stable and perhaps even characterized by some very modest growth. It should be noted that this activity is composed mainly of residential followed by institutional and government construction projects. Indeed, the peaks in Figure 1 are much less impressive once you remove the government and institutional permit values.
The composition of these permits is provided in Figures 2 and 3. Figure 2 presents an area graph based on annual numbers while Figure 3 simply aggregates all the permits since 1998. Nearly thirty percent building permits since 1998 are of institutional and public sector origin. Industrial permits are below 10 percent. Commercial permits have been surprisingly large as a proportion of the total which is actually a cause for some optimism given that they reflect private sector perceptions of economic opportunities in Thunder Bay.
My recent
Fraser Institute Blog post on employment growth in Canada at the provincial and
CMA level since 2007 appears to have attracted a fair amount of interest if
only based on the hits via my Linkedin page.The article was posted on the Fraser Blog on December 4th and
by December 14th, it had garnered 1,515 views.The interest has been quite pronounced from
Linkedin profiles in Ontario and of course particularly from the Thunder Bay
area. As a follow-up, I decided to look at employment levels in Thunder
Bay and Greater Sudbury from a longer-term perspective using data from
Statistics Canada.
Now
Statistics Canada has annual province level unemployment rates and employment
data available on its site from 1976.Its annual CMA level data only appears to go back to 1987.So, in order to generate CMA employment
levels and unemployment rates for Thunder Bay and Greater Sudbury prior to
1987, what I did (acting on the suggestion of my Lakehead colleagueRob Petrunia) was run regressions of CMA level employment and unemployment rates
for both cities on the Ontario data along with a time trend
variable.The assumption is that
employment levels and unemployment rates in the two cities should reflect what
is going on in the province as a whole. The regression results were then used
to estimate fitted values for Thunder Bay for the period 1976 to 1987 and for
Sudbury from 1976 to 1990 (Sudbury data starts in 1990).
The results
are intriguing.Figure 1 plots the
unemployment rates in the two cities from 1976 to 2016 and there seems to be
some good news here.While unemployment
rates in both cities fluctuate a great deal over time, they have generally
trended downwards since the late 1970s.The average unemployment rate in Thunder Bay between 1976 and 1985 was 9.7
percent while in Sudbury it was 11 percent.Over the period 2010 to 2016, Thunder Bay’s unemployment rate was 6.1
percent while over the same period in Sudbury it was 7.5 percent.
However,
the good news seems to end when employment levels are examined in Figure 2 – at least for
Thunder Bay.Sudbury has seen its
employment grow over time while Thunder Bay has essentially remained flat. In
1976, estimated total employment (full and part time) in Thunder Bay was 61,224 and in Sudbury it was
60,475.By 2016, Thunder Bay’s
employment was 60,100 while in Sudbury it was 81,700.In other words, over 40 years Thunder Bay has
essentially remained flat in terms of its employment level – indeed there has
been a slight decline of 2 percent since 1976.As for Sudbury, its employment level has grown by 36 percent since its
estimated 1976 value.
A declining
unemployment rate when total employment is growing can be seen as good news.A declining unemployment rate when total
employment is declining means that your labour force is actually shrinking
faster than your employment level.For
Sudbury, a lower unemployment rate is good news given that it has been
accompanied by rising employment.For
Thunder Bay, a declining unemployment rate is a misleading indicator and masks
the moribund nature of its economy given that its employment level has been essentially
the same for 40 years.