Northern Economist 2.0

Wednesday 8 February 2023

Policing and Crime in Ontario, Part 4: estimating needs

 This post originally appeared on the Fraser Institute Blog February 7th. This is the fourth and final post in the series.

In estimating policing needs across Ontario municipalities, one approach is to estimate the determinants of police resources then compute a predicted staffing level. Using the results for the police regression estimated in the third post in this series, we can construct an estimate of police resources per 100,000 for each community based on community characteristics such as available property tax resources, population density and regional variation, and then compare actual staffing with what would be predicted by the regression.

The chart and table below present the results of this exercise and plot the actual number of police per 100,000 versus the predicted for each municipality, and rank the results by the size of the difference between the two amounts.


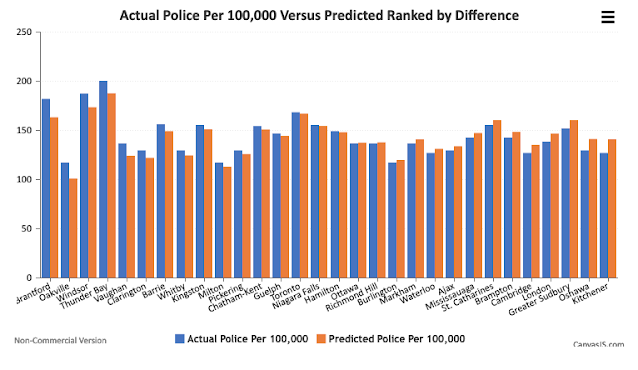
Brantford has the largest difference with 182 actual officers per 100,000 and a predicted level of 163 resulting, for 19 more officers per 100,000 than the model would predict. It’s followed by Oakville (16 more), Windsor (14 more) and Thunder Bay (13 more). Indeed, of these 30 municipalities, about half have more officers per 100,000 than predicted, ranging from Brantford (19) to Niagara Falls and Hamilton (approximately 1 each). Toronto is also just above its predicted staffing at about one officer more per 100,000 than predicted. The remaining municipalities have staffing below what the model would predict, ranging from about one officer per 100,000 less for Ottawa and Richmond Hill to Oshawa (12) and Kitchener (14).

Of course, these are estimates and there can be other extenuating factors that affect police staffing and hiring in respective municipalities as well as the weight of historical staffing patterns. For example, Windsor is a border city, with cross-border demands and traffic, and an entry point into Canada that requires more policing while Thunder Bay has long-standing issues with high homicide rates, which absorb substantial investigative resources. One also wonders if the presence of casinos in some of these cities may lead to a need for more resources. Moreover, like the rest of the labour force, police forces are aging and some of the proposed hiring may reflect replacements of retirements rather than overall staffing increases.

And for those municipalities that are part of regional police arrangements, the results provide an interesting comparison of what their population sizes suggest their policing resources should be and what they’re getting via a regional arrangement.

For example, Oakville, Burlington and Milton based on the Halton Region staffing all are assigned 117 officers per 100,000 population by the statistics. The predicted staffing per 100,000 is 101 for Oakville, 120 for Burlington and 113 for Milton. Whether this is reflected in actual day-to-day operations or is simply a statistical artefact is an interesting question. It’s also interesting that even though some municipalities are near the bottom in terms of actual police officers per 100,000 population relative to other large Ontario municipalities, they still have more officers than predicted.

However, these results may assist in revisiting the cases of Toronto, Hamilton, Sudbury and Thunder Bay mentioned at the outset of this series. In the case of Toronto, there are long-standing narratives that the police force is either overstaffed or understaffed. Moreover, this debate has occurred against a background of recent rising crime and rising policing costs, more complicated policing needs, issues of racism and defunding, calls for alternate investment in areas like homelessness or mental health, and responses to evolving events such as the recent violence on Toronto public transit. Hamilton has issues similar to Toronto and in the evolving debate over its proposed increases in the policing budget there’s the recent news that Hamilton had a historic drop in homicides in 2022. Does this mean that Hamilton’s police force is so effective that it does not need more officers? Or that Hamilton just got lucky in 2022 and crime rates are more random than one might imagine?

Making resource decisions in a heated, emotionally or politically charged debate environment driven by the events of the moment is not always the best policy approach. While empirical evidence is but one piece of the decision-making process, both Toronto and Hamilton appear to be very close to what the determinants in the models would predict their staffing levels to be, suggesting that other factors notwithstanding, at the very least, better deployment of existing resources may be something worth considering.

Sudbury, on the other hand has eight fewer officers per 100,000 population than the model would predict while Thunder Bay already has 14 more officers per 100,000 than one might expect. A simplistic interpretation of these results given their size would be that Sudbury should go ahead and hire more while Thunder Bay should not. However, if Sudbury is currently able to achieve its policing goals with fewer resources, then it should not automatically feel compelled to ramp them up. As for Thunder Bay, the picture there’s probably more complicated than even a regression equation can possibly imagine, but that still does not mean better deployment of existing resources should not be a complement to whatever else is deemed necessary.

The takeaway from all this is that policing and public safety is complex and complicated and more effort should be made to acquire evidence to support decision-making. The types of results are simply one piece of evidence that can go into resource allocation decisions at budget time, and municipal ratepayers and their city councils should make wise use of all available information. This is especially the case given the large increases in tax rates that seem to be marking municipal budget season in Ontario this year.


Policing and Crime in Ontario, Part 3: statistical relationships

 This post originally appeared on the Fraser Institute Blog, February 7th.


Crime rates and severity, as well as policing resources per person, can differ substantially across Ontario municipalities. Naturally, Ontarians want to know the relationship between crime and police resources, particularly when police forces are asking for more money.

The first chart below plots the number of police officers per 100,000 against the Crime Severity Index (CSI) in Ontario’s 30 largest municipalities. As illustrated, there’s a positive relationship between crime severity and police levels, which some might find counterintuitive as one would think that more police means less crime. However, as has been noted, it’s sometimes difficult to sort out if more police officers result in less crime or whether more crime leads to a call for more police resources and an increase in police officers. Or even if more officers and more crime are positively related because of more effective reporting and control of crime.


While one could interpret this as evidence that more crime requires more police, it remains that we must account for the aforementioned bidirectional nature of the relationship and this ultimately requires controlling for confounding factors before attempting to answer the question as to whether the crime severity in these communities supports the policing numbers.

The table below presents regression estimates of the determinants of crime severity and policing using data for the 30 largest Ontario municipalities in 2021 and with a methodology similar to other studies. The regression models first estimate a regression of the CSI on police officers per 100,000, average household income in the municipality, and regional variables placing the municipalities in either Northern, Eastern, Western, Central/GTA or the Niagara Peninsula (with Central/GTA as the omitted regional comparison variable). Northern municipalities are Thunder Bay and Sudbury. Eastern municipalities are Ottawa and Kingston. Western municipalities include London, Windsor and Chatham-Kent. The Niagara peninsula includes Hamilton, St. Catharines and Niagara Falls. The remainder are in the Central/GTA region.


To account for bidirectional or simultaneous effects, this regression was used to estimate a fitted CSI from the estimated coefficients, and it was then used in the police officers per 100,000 regression as the crime variable. The remaining determinants in the police regression were average residential property taxes for a three-bedroom bungalow as a measure of potential community resources, population density (persons per square kilometre), and then again, the set of regional variables, which are included to capture regional differences that might uniquely affect not only crime rates and severity but also the operation of police services. For example, Indigenous peoples comprise a larger population share of Northern Ontario and according to self-reported information from the 2009 General Social survey (GSS), aboriginal people were two times more likely than non-aboriginal people to experience violent victimization such as an assault, sexual assault or robbery (232 versus 114 incidents per 1,000 population). The approach is essentially a simultaneous equations technique and also uses weighted regression where observations were weighted by municipal population size thereby providing greater weight to larger population size municipalities.

The results show that variables significantly affecting crime severity positively include police officers per 100,000 population and the regional variable with Northern and Western Ontario demonstrating higher crime rates relative to the Central/GTA municipalities. As well, crime severity is negatively and significantly related to average household incomes in the municipality. Crime severity is also positively and significantly related to police officers per 100,000, which can be interpreted either as having more police officers per person results in more crime being reported and dealt with, or more crime requires more police officers.

In the police determinants regression, police officers per 100,000 is positively and significantly related to crime severity (fitted) and population density. The only regional variable that’s significant here is Western Ontario and that variable shows that Western Ontario has fewer police officers per 100,000 in relation to the Central/GTA region, all other things given. Both regressions explain a high proportion of the variation in the dependent variables.

Having established a statistical relationship between policing resources and crime rates after accounting for a number of confounding factors, the next step (in the fourth and final post of this blog series) is to use these results to see what predicted police staffing levels are like and how they compare to actual levels.


Tuesday 7 February 2023

Policing and Crime in Ontario, Part 2: severity and levels

 This post originally appeared on the Fraser Institute Blog on February 6th.

While crime in Ontario has been rising recently, it’s still at comparatively low levels while the number the number of police officers per person is also relatively low. However, there are sometimes rather large differences across Ontario’s cities both in terms of police staffing, crime rates and crime severity. The reasons for these differences can be complex ranging from historical and institutional factors to geographic spread of municipalities and local policing environments rooted in different crime rates and types of crimes.

The chart below plots police officers per 100,000 population in 2021 for Ontario’s 30 largest municipalities by population and ranks them from highest to lowest. (Note that a number of these municipalities have regional police services and in the chart the per-person policing number for the regional service has been assigned to the municipality.) The average across these 30 municipalities is 144 officers per 100,000, which is below the provincial level of 176 per 100,000 reflecting higher police per 100,000 population in more rural or remote areas with large geographies and sparser populations.


The level of policing ranges from a high of 200.4 officers per 100,000 in Thunder Bay to a low of 117 per 100,000 for the set of communities in the Halton region—a substantial difference. The four highest number of officers per 100,000 are for Thunder Bay, Windsor, Brantford and Toronto, ranging respectively from 39 per cent to 17 per cent above the 30-municipality average of 144. Conversely, the four lowest communities of Milton, Burlington, Oakville and Waterloo (which incidentally are all part of regional forces) are respectively 12 per cent to 18 per cent below the average.

The second chart plots the ranked Crime Severity Index (CSI) for these 30 communities. The CSI is a relatively new tool that complements existing measures of traditional crime rates by taking severity and the volume of crime into account (Statistics Canada, 2009). All Criminal Code offences, including traffic offences and other federal statute offences, are included in the CSI. In the calculation of the CSI, each offence is assigned a weight, derived from average sentences handed down by criminal courts with more serious sentences on average for the crimes resulting in a higher weight for that offence. Thus, more serious offences (for example, homicides versus traffic offences) have a greater impact on changes in the index.


The results again show a substantial range in overall crime severity ranging from highs of 105 and 98 for Windsor and Thunder Bay to lows of about 23 for the Halton region communities of Oakville, Burlington and Milton with an average CSI across these 30 communities of 57. While there’s a wide range in crime severity across these Ontario cities, given that the CSI is standardized with Canada equal to 100, Ontario cities generally rank lower in crime severity than some other parts of Canada such as Manitoba, Saskatchewan and the Territories.

Again, it should be noted that a number of these municipalities have regional police services and the crime severity index as reported for the regional service has been assigned to the municipality. The communities with the highest crime severity are Windsor, Thunder Bay, Brantford and Sudbury, which range from 84 per cent to 54 per cent above the average crime severity. Meanwhile, for the communities at the bottom—Brampton, Oakville, Burlington and Milton—they are 35 per cent to 60 per cent below the average crime severity. Notably, the per cent differences from the average for crime severity across these communities is larger than the difference in policing resources.

Of course, when examining what crime is like in these same communities and ultimately what relation the municipality may have to policing resources, it’s important to bear in mind that the relationship between crime rates, crime severity and policing is bidirectional or somewhat murky. On the one hand, one would expect that more police, all other things given, should result in lower crime rates as more resources are brought to bear on the problems. At the same time, one might also find that higher crime rates spur calls for more police resources, which in turn results in the hiring of more police. Put another way, it’s sometimes difficult to sort out if more police officers result in less crime or more crime also leads to more police officers.

In the next post in this blog series, we’ll take a more in-depth look at the relationship between policing resources and crime severity in these Ontario communities.


Saturday 4 February 2023

Policing and Crime in Ontario: Part I


This is the first post in a blog series exploring the state of policing levels and crime rates in Ontario. This post first appeared on the Fraser Institute Blog, Feb. 3rd, 2023.

Municipal budget season in Ontario comes with an assortment of budgetary issues including proposed hefty increases in policing budgets partly fuelled by rising crime rates.

Recent proposals include:

  • A 4.3 per cent increase of police spending in Toronto, which would increase the police budget by $48.3 million to $1.17 billion, and an increase of 200 officers (in light of a planned 5.5 per cent increase in property taxes, this proposal has generated much debate).
  • A 5.6 per cent increase in the police budget in Sudbury, accompanied by a proposal for 15 new officer cadet hires and ultimately 24 new officer positions. The proposed hires come at a time when crime rates have not fluctuated a great deal.
  • In Hamilton, the Police Services Board asked for a 6.7 per cent increase ($12 million) in its budget that includes 18 new civilian positions and 13 new officers yearly.
  • In Thunder Bay, a proposed increase in the police budget for 2023 accounts for about one-third of the proposed 6.2 per cent tax levy increase and also includes the hiring of 21 positions.

When proposing these large budget requests, advocates often cite the effects of capital renewal, general inflation of operating costs, rising demand for police services given their more complicated roles (especially with respect to social and mental health issues) and rising crime rates—that is, the number of police service reported criminal code incidents per 100,000 population. As chart below shows, crimes rates in both Canada and Ontario have grown since 2015 but took a sharp drop in 2020 (the first pandemic year) and then resumed upwards.

However, by historical standards crime rates remain quite low. At the same time, policing numbers in both Canada and Ontario are also at comparatively low levels in terms of officers per 100,000 population over the 1986 to present period (see second chart below). Since the mid-1980s, there have been two peaks in officers per 100,000—1991 and 2010. Both peaks were followed by declines in the number of officers but the decline after 2010 appears more pronounced with officers per 100,000 population in Ontario declining from 200.3 in 2010 to 174.9 in 2019 (a 13 per cent drop) followed by a slight rebound to 176 by 2021.


Given these numbers are per 100,000 people, another factor in the demand for more officers is simply Ontario’s rapid population growth. Since 2010, Ontario’s population has increased from 13.1 million to 14.8 million (an increase of 13 per cent) while the total number of police officers has remained flat, hence the per-person decline.

In general, public debate on rising police costs should be considered within the context of overall public spending in Canada and the demands of a more complex society. Policing has evolved beyond just dealing with crime and includes a wider range of problem social behaviours, which are factors in police resource and expenditure growth.

The key question then in municipalities across Ontario is what should municipal councils do in response to demands for more policing? To answer that, we must know what the relationship between police resources and crime is and how that might shape the assorted requests across the province for larger police budgets. Given the diversity that is Ontario, in terms of the size and needs of its urban centres, there’s not a one-size-fits-all answer to such questions. In the next post in this series, we’ll explore the relationship between police staffing and crime severity across major Ontario municipalities.


Wednesday 25 January 2023

Ontario Universities: Is More Competition Underway?


Ontario universities saw the release this week of the preliminary application statistics for the 2023-24 academic year by OUAC, and they are quite intriguing given that they suggest that there may be a shift underway in how students both apply and make their ultimate choices.  These applications are for full-time, first-year, fall-entry, undergraduate university study or 101s as they are known, and applications are up 2.9 percent this year though the number of applicants is down slightly by about one-firth of one percent.  Figure 1 plots both applications and applicants over the period 2014 to 2023 and though both exhibit a rising trend the number of applicants has been more volatile as a result of the pandemic year. 


What is more interesting is Figure 2 which divides the number of applications by the number of applicants in each year and reveals that over time individual applicants have been applying to more universities.  From 4.6 applications per applicant in 2014 to 5.8 in 2023.  This suggests that students are open to considering more options either because they are shopping around or perhaps to ensure that they get into a program they desire.  In any event, this alone suggests that university recruitment out of Ontario high schools may be getting a bit more competitive.


 More evidence to this effect is provided in Figures 3 to 5.  Figure 3 ranks Ontario’s universities with constituent affiliated campuses included with the main campus (for example, King’s, Brescia and Huron are included with Western) and there is definitely a pecking order in terms of application totals: Large (University of Toronto, York, McMaster, Toronto Metropolitan, Western, Waterloo and Guelph: 59,218 to 40,461), Medium (Queen's, Ottawa U, Wilfrid Laurier, Carleton, Brock, Trent, Ontario Tech, and Windsor: 37,638 to 10,665) and Small (Lakehead, Laurentian, Nipissing, OCAD, Algoma and Universite de l'Ont Francais: 3573 to 22).  Yes, 22 for Universite de l'Ontario Francais which because it had only 14 applicants last year it registers the largest percent increase in 101s of all Ontario universities at 57 percent making it such an obvious outlier that it is omitted from Figure 4.


Figure 4 plots the universities ranked by the percent increase in preliminary 101 applications in 2023.  Some of the largest increases are for smaller universities.  Of the top 10, only two are in the large university category – Guelph and York – while four are in the medium category – Windsor, Ontario Tech, Wilfrid Laurier and Brock - and the other four are all smaller institution – Nipissing, Laurentian, Lakehead and Algoma. Coincidentally, all four of these are in northern Ontario.  Figure 5 plots the percent increase in 101s applying in 2023 against the number of applications in 2022 for these institutions and there is a definite correlation between size and growth.  Smaller places in terms of previous application numbers on average seem to be seeing higher growth in applications this year.  


Now, to keep things in perspective, this does not mean that University of Toronto or McMaster are going to have trouble filling their first-year classes this year.  The main competition is still between the bigger places. They have way more applications than they need to fill their spaces making them still the overwhelming choice for most.  The seven largest universities ranked by applications accounted for about 64 percent of applications.  The eight medium sized places accounted for 34 percent and the remaining small universities accounted for just over 2 percent.  The small furry mammals are hardly a threat to the larger denizens of Ontario’s university system.  Still, the fact that their application numbers are up suggests that some students may be becoming more open to venturing outside their home communities which are invariably close to the GTA.  As well, students in these communities with smaller universities may be deciding not to go to school in higher cost centers. The cost of living in the GTA for students away from home is undoubtedly a factor in these inflationary times and so we may be seeing the smaller more out of the way places improving their enrollment at least at the margin.  This should hopefully spill over into budgetary positions given that Ontario universities have faced freezes in both their tuition and government grant revenues.


Friday 20 January 2023

Municipal Property Taxes and Water Rates in Ontario: A Comparison


As we continue to journey through  the 2023 municipal budget year, it is time to update some of the property tax and water rate comparisons I have done over a number of years.  This time, I would like to do the comparison for the top 30 municipalities in Ontario by population which essentially amounts to all the cities with over 100,000 people with the exception of Niagara Fall which is almost there at 96,000.  These cities together account for 75 percent of Ontario’s population.  The data for comparison is from the 2021 BMA Municipal report and two indicators are compared: 1) Annual property taxes for a detached bungalow and 2) Annual residential and Wastewater Costs per 200 cubic meters.  While much of the focus in municipal budgets this year is on the rather large increases in the tax levy, it remains that water charges are also another hefty amount on top of property taxes. In all the figures, I also highlight the amounts for Thunder Bay and Sudbury, which are the two northern Ontario members of the top 30.


Figure 1 ranks these municipalities by the property taxes for a detached bungalow in 2021 and they range from highs of $6,643 and $6,500 for Markham and Richmond Hill to lows of $3,444 and $$3,262 for Windsor and Chatham-Kent with an average of $4,323 and a median of $4,049.  It should be noted that the top ten property tax amounts are all in the GTA where of course property values are also the highest.  Thunder Bay is essentially mid-ranked in this comparison with its property tax figure  of $3,955 below both the average and the median.  Greater Sudbury, is much lower than Thunder Bay and at $3,453 has the third lowest property taxes for an average detached bungalow in Ontario’s top 30 municipalities.


Figure 2 now does the ranking by  residential water and wastewater(sewer) costs per 200 cubic metres of water.  The top three are Greater Sudbury, Windsor and Thunder Bay at $1,409, $1,306 and $1,278 respectively.  At the bottom are Hamilton, Mississauga and Brampton with Hamilton at $781, and the last two tied at $590.  The average was $976 while the median was $929.  The two northern Ontario cities both are amongst the highest when it comes to water rates in the province.  One suspects that water rates for some of the cities at the bottom are likely to go up substantially in the near future given urban growth and other issues.  Hamilton for example, is likely facing some expensive issues with respect to its water infrastructure given recent developments with respect to sewer discharges


Of course, for the average municipal residential ratepayer, what really matters is the total package when it comes to property taxes and water charges  and this is provided in Figure 3 where the two items are summed up and ranked by municipality.  When the two totals are summed up they range from highs of $7,537 and $$7,478 for Markham and Richmond Hill to lows of $4,482 and $4,457 for Waterloo and Chatham-Kent.  The average is $5,299 and the median is $5,099.  At $5,233 Thunder Bay is slightly below average and slightly above the median for the totals of property tax and water rate.  However, it does have the 11th highest total coming right after the ten GTA municipalities ahead of it and just before Hamilton.  With those types of numbers, when it comes to municipal finance, Thunder Bay is definitely GTA class in terms of property and taxes and water rates.  Greater Sudbury on the other hand is in the top of the bottom third with a total of $4,856.


The more interesting question is what the numbers will look like for 2022 once complete as well as where they are going to be headed in 2023.  Municipalities have been hit with escalating costs for labour, materials, supplies and energy as well and one can expect that there will be a lot of upward pressure to bring in property tax and water rate increases that reflect the inflation rate.  These increases will come at the same time as rising interests will put financial pressure on the mortgages of home owners and the pressure that inflation has been generating on family budgets.  Given that in Ontario, municipal elections in October have put in place a council for the next four years, one suspects that most councils will eventually  front end fairly large tax increases at the start of their terms and ease off midway through their terms in the run up to the next election.  Sad, but very likely to be the outcome in many cities across Ontario.  It will be the rare council with the foresight, fortitude and ability to rein in their costs sufficiently to prevent large tax increases this year.


Friday 13 January 2023

Municipal Employment in Thunder Bay: An Analysis


The last post presented an overview of what for lack of a better term can best be described as higher tier municipal employment in northern Ontario – that is individuals in the five major municipalities of northern Ontario who earned $100,000 or more in annual salary (let's call them Listers) thus placing them on the public sector salary disclosure list.  What was interesting in the overview was that Thunder Bay in 2021 had the most municipal Listers at 547 followed by Sudbury at 540, then the Sault at 246, North Bay at 187 and finally Timmins at 142.  This ranking roughly parallels population size with the exception that based on population, one would expect Sudbury to exceed Thunder Bay.  The per capita cost of municipal employees on the public sector salary disclosure list was also the highest in Thunder Bay of the five cities.  As a result, a more detailed look at trends for Thunder Bay is of interest.


Figure 1 plots the number of Thunder Bay  municipal employees earning $100,000 or more over the period 2017 to 2021 and shows that the number was relatively stable over the 2017 to 2019 period but took a large leap in 2020 (to 558 from 452) and has remained at approximately the same level (at 547 in 2021).  The percentage increase in the number of employees over $100,000 in 2020 was approximately 24 percent and at the time was attributed to a large number of employees in protective and emergency services who had been just under the threshold for a number of years going over.  However, this is only part of the story as the increase in the total wage and salary bill of municipal Listers (see Figure 2)  in Thunder Bay from 2019 to 2020 was nearly 30 percent.   That is the salary bill for those on the list  increased more than the number of employees on the list  suggesting compensation increases drove a portion of the increase.  And indeed, compensation particularly of higher tier administration and management was an issue last year with some increases approaching 12 percent.  This could be seen as particularly annoying by others in the broader public sector - particularly  front line workers in health and education - who were limited to one percent annually by Bill 124 while the municipalities were exempt.


Depending on what you think is the total municipal employment of the City of Thunder Bay, those making over the list probably make up anywhere from one-fifth to one-third of the City’s municipal employment though given the absence of readily accessible municipal employment numbers, these are estimates at best.  One thing that does not need to be estimated however is the ratio of the total wage and salary bill of Thunder Bay municipal employees earning $100,000 plus to the total value of the tax levy as illustrated in Figure 3.  Between 2017 and 2019, this share averaged 27 percent but in 2020 it took a leap to 36 percent  and then declined to about 34 percent in 2021.  In any event, one could make the case that the value of the wage and salary bill accounted for by those Thunder Bay municipal employees earning $100,000 plus represents over one third of the tax levy.  


Figures 4 and 5 round out the analysis by presenting first the average salary of Thunder Bay municipal employees on the List and then the per capita cost of these employees.  Again, 2020 – the pandemic year – is the crucial point in time.  In 2020, the average salary per List member rose just over  5 percent  - going from $121,002 to $127,091.  Meanwhile, the per capita cost of those on the municipal salary list rose from $494 to $640 – an increase of nearly 30 percent.  Between 2019 and 2020, the number of municipal Listers grew from 452 to 558 (24 percent) while their salary bill went from $54.7 million to  $70.9 million (30 percent increase).  Thus the average salary rose by about the difference.  However,  when you spread that salary bill across the entire population of the municipality you get a somewhat different result - salaries rose 30 percent but population growth was flat. 


The List get a lot of attention every year.  While accountability is important, it remains that the real accountability measure is not how much is being paid out but the value received for that money as well as its sustainability over the longer term.  It is not that people on the list are making too much given what they may or may not do or that their salaries rose too much or even that there are a lot more of them.  In the end, you do get what you pay for even in the public sector.  The real issue is that the cost of services has grown dramatically but the tax base and population of Thunder Bay have not.  Thunder Bay’s official population has stayed flat at about 110,000 people over the period 2017 to 2021, the value of the tax levy grew from $184 million to $204 million – an increase of 11 percent  but the wage and salary bill of its municipal list employees has grown from $50.1 to $69.6 million dollars – an increase of nearly 40 percent.  


No one is saying that those employees are not worth what they are being paid or are not deserving of their pay especially given the travails of the pandemic.  However, ultimately  the money does have to come from somewhere and to date the solution has simply been to pass the bill onto municipal ratepayers - something that was aided by the Ontario government under the provisions of Bill 124 which exempted municipalities because they had "own source revenues" - that is a municipal tax base.  It would appear a number of fiscal and budgetary chickens are coming home to roost.

Tuesday 3 January 2023

The Rise of the Polygon: The Evolution of Regional Concentration in Ontario

Last post, we looked at Ontario’s population and in particular its concentration in the GTA and what I termed the GTAPlus or "The Polygon" – a geographic area essentially going from Oshawa to the end of the Niagara peninsula and then to Kitchener-Waterloo and finally out to Barrie and back to Oshawa with Toronto approximately in the center.  Approximately two-thirds of Ontario’s population and by extension its economy are clustered in this small area whose perimeter is about 500 km and encompasses a total area of nearly 14,000 square kilometers and a land area of about 11,000 square kilometers.  On a map of Ontario, this area looks like a postage stamp and represents only about 1.3 percent of its area. Yet, well over nine million people out of Ontario’s 14 million people live here and it accounts for approximately 600 billion in GDP – nearly 70 percent of Ontario’s economy.


In many respects, this core area has always been the heart of Ontario’s economy but less so in the past in terms of its population, urban, and economic dominance.  There was a time when Ontario had somewhat more dispersed and balanced urban and economic development but the economic development of the last century has increasingly concentrated economic activity in The Polygon.  In order to provide some perspective on the evolution of Ontario’s population over time, we start with Figure 1 which plots the population of Ontario’s largest municipalities today ranked according to their 2021 population.  These differ from CMA populations – for example, while Hamilton is the third largest CMA in Ontario, its municipal boundaries and population make it the fifth largest municipality in Ontario after Toronto, Ottawa, Mississauga and Brampton.  Population size today versus 1921obscures the size of these cities 100 years ago so Figure 2 also plots the 1921 populations on their own.


Needless to say, the rankings have shifted somewhat over time.  London, Ontario was Ontario’s third largest municipality in 1921 while Hamilton was fourth, Windsor fifth and Thunder Bay (then the two Lakehead municipalities of Fort William and Port Arthur) would have been Ontario’s sixth largest city.  Ontario’s third and fourth largest cities today – Mississauga and Brampton were essentially small towns in 1921.  Indeed, much of the GTA outside of the City of Toronto today in 1921 was at the bottom of the municipal population rankings.  Indeed, when one considers these 30 largest municipalities (though Pickering and Ajax have been combined) – 23 of them can be considered members of the Polygon.  These municipalities alone account for nearly 9 million people in Ontario today, representing nearly two thirds of Ontario’s population.  However, in 1921, they totaled about 700,000 out of Ontario 2.9 million for approximately 25 percent of Ontario’s population.


Put another way, in 1921, nearly three quarters of Ontario’s population lived outside the Polygon whereas today it is at best one-third.  The increasing concentration of economic activity and population in The Polygon – Ontario’s geographic top 1 percent so to speak – reflects the decline of resource sector (agriculture included) and manufacturing industries that had dispersed population prior to the mid 20th century.  The relative decline of cities such as Thunder Bay, Sudbury, London and Windsor – the North and Southwest regions of the province – reflects this economic shift. The growth of the Polygon cities reflects the rise of services and knowledge industries and the increasing importance of having large urban agglomerations with economies of scale and scope for associated industries and robust international connections to world cities as the source of growth.


Is this a problem?  Well it depends on your perspective I suppose.  The Polygon is a dynamic and growing population and economic cluster in Ontario and is essentially Ontario’s gateway to the international economy.  While small and compact, it has a very diverse population given it is the end point for most of the international immigration into Ontario.  By world standards, having 9 million plus people clustered on 11,000 square kilometers – over 800 persons per square kilometer – is not exactly at the top of the list.  The Polygon is still quite roomy by world standards.  For example, the Hong Kong SAR with an area of just over 1,000 square kilometers has about 7,000 people per square kilometer.  Nevertheless, for the Polygon region to proposer, it will need continuing investment in infrastructure not least of which will be housing.  It will also need investment in quality of life infrastructure such as green space and recreational facilities, not to mention transit.  Still, these challenges represent opportunities for creative solutions and innovation. The most important challenge is the institutional framework given the patchwork of municipalities and jurisdictions in this area.  Infrastructure development based on existing municipal boundaries is a sense fails to take into account the true scope of the Polygon as a growing and integrated region.


Some of those creative solutions will also need to address what happens to those living outside The Polygon.  Here the challenges are more diverse.  In the end, Ontario really consists of three regions - The Polygon, The Ottawa Nexus (Ottawa and the Kingston-Pembroke area) and then everyone else. Figure 3 outlines what this looks like in terms of distribution with the Polygon at closer to 10 million people here because Muskoka-Kawarthas are lumped into it for population purposes. The Ottawa region is the next largest outside of the Polygon but with its role as the federal capital and its own relatively compact outlying region, it will easily  find its own solutions to its growth and development issues.  More problematic will be those parts of Ontario outside of the Polygon and Ottawa Nexus, the Southwest from London to Windsor and upwards into the Bruce Peninsula and of course “The North” which with 90 percent of Ontario’s land area only has about 6 percent of the population.  The interests of a high growth densely populated region like the Polygon will differ from these slower growth and lower population density parts of Ontario.  


Needless to say, there will not be a one size fits all solution to economic growth and development in these regions but their success will ultimately all hinge on their ability to tap into opportunities offered by the Polygon and how to market the goods and service of their regions there and beyond.  There is strength in numbers and it is time for cities like Windsor and London in the Southwest, Thunder Bay and Sudbury, in the North and Peterborough and Kingston in the East to forge better relationships within their regions and with each other to promote their common interests outside.  These cities may have greater success by magnifying their lobbying power and political influence within Ontario by presenting a more  united front when it comes to economic development issues.  Easier said than done?  Yes, but when it comes to the economic future, there is no say, only do.

Monday 2 January 2023

Measuring Ontario: Introducing "The Polygon"


Happy 2023! This is the first post of the year.  Northern Economist started out as a blog dealing mainly with Thunder Bay and northern Ontario economic and policy issues but over the years the posts have branched out into a wider range of topics with Ontario as a whole much of the focus.  For 2023, I will be looking at Ontario issues a lot more given Ontario’s importance as an economy in its own right not only within Canada but indeed the world economy.  At 14.2 million people, Ontario is the largest province in Canada making up 37 percent of its population.  Within North America, if Ontario was a US state, it would be the fifth largest in terms of population coming in between New York (19.3 million) and Pennsylvania (12.8 million).  If Ontario was a country, it would be the 75th largest country in the world by population. And as for its economic size, with an estimated GDP of 956 billion dollars in 2021 ($707 billion USD), Ontario would be among one of the 25 largest economies in the world.  Yet, most of Ontario’s population and economy is highly concentrated in a rather small geographic area as illustrated in Figure 1.


As part of getting to Figure 1, let me review some of the other ways of looking at Ontario's population and economy in terms of boundaries.  Ontario’s population has been growing robustly and this robust growth is a factor -along with low productivity and business investment - why per capita GDP lately has not been growing as fast.  Ontario’s population can be looked at a variety of different lenses – economic regions, CMAs or municipalities.  Ontario used to be a very rural province but as industrialization progressed by the early 20th century half of its population lived in urban areas.  Today, over 85 percent of Ontario’s population is urban and it is increasingly being concentrated in a number of large urban areas chief of which is the GTA. 


Figure 2 plots the ranked populations of Ontario’s CMAs.  A CMA (Census Metropolitan Area) must have a total population of at least 100,000 of which 50,000 or more must live in the core.  Generally a CMA is formed of one or more adjacent municipalities and CMAs and municipalities bearing the same name usually differ in size.  For example, the City of Hamilton is just over 500,000 but its CMA is closer to 800,000 people.  The largest CMA in Ontario is the Toronto clocking in at 6.6 million.  Next comes the Ottawa CMA at just over one million, and then comes Hamilton at over 800,000 and they fall away after that in size with Belleville at about 114,000. 

Figure 3 shows the population share of these CMAs and they show the Toronto CMA – the GTA – accounting for nearly half of Ontario’s population.  Indeed, the GTA, Ottawa and Hamilton together account for 60 percent of Ontario’s population, the remaining CMAs account for 25 percent and the rest of Ontario represents 15 percent of the population.  


Another way of looking at the distribution of Ontario’s population is via the Economic Regions used by Statistics Canada and the provincial government – which total eleven.  These are broader geographic entities covering specific parts of the province and contain not only CMAs and municipalities but also all the other urban entities whether they are villages, townships, etc… as well as rural areas.  Think of them as the eleven kingdoms of Ontario.   Figure 4 ranks the regions by population size and again the Toronto (GTA) region at 6.9 million people is the largest followed this time by Hamilton-Niagara at 1.6 million and the Kitchener-Waterloo-Cambridge region at 1.5 million.  The region centered on Ottawa comes in fourth place and the much of western Ontario followed by the north and east.  At 241,000 people the Northwest is Ontario’s smallest economic region by population size.  Figure 5 plots the distribution of population by region and Toronto and the adjacent regions of Hamilton-Niagara and Kitchener-Waterloo-Cambridge account for two-thirds of Ontario’s population.  Eastern Ontario – consisting of Kingston-Pembroke and Ottawa together account for 13 percent.  Western Ontario including Stratford-Bruce is 11 percent the remaining largely northern regions – Northeast, Northwest, Muskoka-Kawartha account for nine percent.


As total output is well correlated with total population, these rankings are also pretty good indicators  of the economic size  of these regions.   However, these CMA and economic regions are just one way of dividing up the province geographically.  Here is another. Take a map of Ontario and starting at Barrie, draw a line to Oshawa and then to the end of the Niagara peninsula just below Niagara Falls, and then continue up to Kitchener and back to Barrie.  You get a rather nice looking polygon that on a map of Ontario looks a bit like a postage stamp in terms of its size.  Let's look at figure 1 again to better introduce "The Polygon'.


It turns out nearly two-thirds of Ontario population and just over two-thirds of its economy is clustered in this small polygon going from Oshawa to the end of the Niagara peninsula and then to Kitchener-Waterloo and finally out to Barrie with Toronto and the GTA  approximately in the center.  This small postage stamp area relative to the rest of the province – See Figure 1 again -  has most of Ontario’s economy and population concentrated. “The Polygon” is essentially the GTAPlus and while Toronto since confederation has always been Ontario’s largest city, its dominance of the province’s economy and population has grown to an extent that was unimaginable in the 19th century when Ontario was a more dispersed province in terms of its economic activity and population.  Much of this dominance however is rooted in the growth of a regional economy as demarcated by the Polygon. More on that in a future post.

Monday 24 October 2022

The House-Condo Price Differential: Northern Ontario Exceptionalism Strikes Again!


Population growth in northern Ontario has been weak over the last few decades as a result of youth out-migration as well as little immigration into the region – even though immigration has accounted for over three quarters of Ontario’s population growth in recent years.  The result has been an aging population and while Ontario  had a population share aged 65 and over of 18 percent in 2021, the province’s North was closer to 22 percent.  A more elderly population is usually seen as a source of rising demand for services like health and a cost driver for government.  At the municipal level, seniors are also a source of local income stabilization given that they still inject some purchasing power into the local economy and of course continue to pay property taxes. 


Yet, in the case of northern Ontario, the earlier waves of youth out-migration may eventually spawn a new wave of out-migration rooted in seniors following their children.  People in the 50 to 65 age range may be looking ahead and thinking about where and when they will retire and facing a choice between remaining in the north in retirement or relocating closer to children.  Weighing in on decisions to stay or go are the need to downsize accommodation and as the years advance staying in the north is certainly made easier by selling your house and moving into a condo or apartment.  What is intriguing in the case of condos in northern Ontario is how much higher priced they are relative to single-detached houses.


Figure 1 plots the median price of a single detached one in 2022 against the median price of an apartment style condo in twelve Ontario urban areas including Thunder Bay and Greater Sudbury.  The median single-detached housing price data for all twelve cities is from Canadian Real Estate Association web site while the median condo prices are from the same place with the exception of Thunder Bay and Sudbury which required creating a separate estimate based on what is currently available on Mitula or Realtor.ca.  Needless to say, that is not the ideal approach, but it will have to suffice given data limitations.  Figure 1 plots the urban areas from highest to lowest single detached median housing price and those prices range from a high of $1.425 million for Oakville to a low of $315,000 for Thunder Bay.  What is more interesting is the accompanying median condo prices which show a lot less variation than those for houses.


The range in median prices for single detached houses in these twelve cities is $1.11 million but for condos it ranges from a high of $648,500 in Greater Toronto to a low of $329,900 in Thunder Bay – a still consequential but much smaller range of $318,600.  Why is this important?  Well take a look at Figure 2.  In Oakville, if you decide to sell your $1.425 million-dollar median valued home and buy a median valued condo at $640,000 you generate a nice cash surplus $785,000 dollars that you can use to finance your retirement or assist your children in buying their home.  If you are in Thunder Bay, doing the same thing will require you to come up with nearly another $15,000 to complete the purchase of the condo. This is of course based on the median prices and in my observations over the last year taking a look at condos in Thunder Bay, very often the difference was more effectively in the $50,000 to $100,000 range depending on the unit.  At nearly $135,000, the gap is even more pronounced in Sudbury though the caution is that this is more likely a function of the much smaller sample size in terms of the Sudbury data currently available.  One would expect the gap to be more similar to that for Thunder Bay.


So here is the thing.  The population in northern Ontario is aging and, in many cases, there will be some consideration of relocating to where children and grandchildren have gone.  Selling your house in Thunder Bay or Sudbury and buying another house in southern Ontario is prohibitive given the vast difference in housing prices.  However, the spread for condos is a lot smaller and the fact is you are going to have to cough up quite a bit of extra money to stay put in a condo in Thunder Bay or Sudbury anyway making a move easier to swallow.  Given the higher cost of a condo relative to a single detached home in Thunder Bay or Sudbury, one cannot help but wonder if the strategy in condo building to date in these communities is simply designed to part widows and widowers from their money when they sell their houses?  Condos in other cities generally have a broader mix of residents based on demographics whereas when one tours a condo in Thunder Bay for example it is not hard to feel that you are visiting a long-term care home rather than a condo.  Even more interesting is the high proportion of condos in Thunder Bay that have little indoor or underground parking - not the best incentive if you are trying to minimize the impact of harsh winters in your Golden Years.


While the young are often the focus of policy initiative and consumer marketing, it remains that wealth and income rise with age and the loss of purchasing power of relatively young seniors – those in the 50 to 65 age range – will not help local economies in the north.  Northern Ontario will need to up its game in both the design and pricing of future condo developments if it wants to forestall the next potential wave of out-migration.