Northern Economist 2.0

Monday 11 September 2023

Thunder Bay's Municipal Budget Woes


Well, Thunder Bay’s municipal budget opera season is now in full swing with assorted fiscal choruses and arias being played in lockstep as we move towards finalizing the 2024 budget.  Like many municipalities across Ontario, there is increasing budgetary pressure to raise taxes.  The narrative this budgetary opera season in Thunder Bay is a little more complicated because along with planning for 2024, there is also the matter of dealing with the remnants of the 2023 season.  This task has proven to be a bit more mettlesome than usual but the end result will probably be a fairly large tax increase in 2024.


Very often, the proposed budget generally includes a tax levy increase that is higher than what is eventually opted for as opposition mounts.  For example, the 2023 budget originally put forth 6.2 percent levy increase that went to 5.6 percent and then 5 percent but eventually passed at a 4.4 percent levy increase (after growth).  This before and after growth distinction is one that has always been a bit of a diversion because after all, a tax increase is a tax increase whether one factors in growth in the tax base or not.   One is indeed surprised that the recent increase in managerial salaries of 12 percent at the City of Thunder Bay was reported as a nominal increase rather than after growth or after inflation.


The last budget was a particularly vexing one mainly because the 2023 budget process was with a new council and they no doubt very much did not want to debut with one of the larger tax increases in recent history.  However, everything comes at a price and the price was taking one million dollars out of the reserve fund and the task of finding several million dollars more in terms of savings.


That process has not gone well, and one suspects behind the scenes municipal movers and shakers do not mind because they would be happier with a tax increase than cuts.  The initial round of cuts tended to deal with relatively high profile but small budget items such as cuts to fireworks, movie nights, and Christmas Day transit service as well as items like the sister cities program. As well, there were the controversial cuts to the Neebing Arena as well as outdoor rinks that in a hockey town like Thunder Bay generated more of a backlash.  Yet, the backlash was dealt with by delaying the cuts and taking a “survey” which is really not a survey at all. 


The survey site consists of a web page and link asking the question of whether you supported the proposed outdoor rink reduction and was really not a statistical survey but a consultation.  The over 80 percent opposition comes from the fact that there is a certain self-selection bias here in that the survey is voluntary and those opposed to the cut of 31 out of 39 outdoor rinks had a strong incentive to go on and register their opposition which explains the 80 percent opposition rate.  Needless to say, the odds are that after rousing public sympathy for the rinks, the next budget offering will be an orchestrated refrain about how we will have to raise taxes more if you want to keep the rinks open.


The reality is that the big money in the City of Thunder Bay budget is not to be found in hockey rinks or fireworks or movie nights but in two key areas: Public Safety and Public Works.  The accompanying figure has been constructed using the City of Thunder Bay’s own data and reveals that the Public Safety Category occupies nearly 40 percent of municipal spending while the Public Works Category is nearly 20 percent.  In other words, with nearly 60 percent of spending in these two categories, looking for cuts in the other 40 percent of spending is going to be difficult as a budget solution.  Even the claim that much of our spending is mandated by the “province” looks a little lame as the legislated programs category accounts for barely one percent of spending though some additional mandated spending is also internalized within some of the other categories.


In the end, the two largest potential sources of savings lie in Public Safety and Public Works, followed by Parks and Recreation, Contributions to Outside Boards and Agencies, Social Services and then Debt Charges. We are in a situation where without any serious attempt to sit down and examine them, the two largest categories are going to increasingly take a larger share of spending.  This will take money from quality-of-life categories such as Parks and Recreation (though oddly enough there is still interest in a new Turf facility on the part of the city administration but I guess that is the capital budget rather than the operating budget at least for now) and then contributions to associated community groups.  Cuts in these other categories will not be sufficient.


We are heading for a scenario where there will be higher taxes and fewer services.  It will be interesting to watch City Council and Administration sell that one.

Thursday 27 July 2023

Thunder Bay Crime, Policing and Population: An Update


Statistics Canada has released the police-reported crime statistics in Canada for 2022 and police-reported crime in Canada, as measured by the Crime Severity Index (CSI), increased for the second consecutive year, up 4% in 2022.  The CSI considers both the volume and the severity of crime. The police-reported national crime rate—a measure of the volume of crime—increased by 5% from 2021 to 2022, up to 5,668 incidents per 100,000 population. However, like the CSI, the crime rate in 2022 (-4%) was lower than in 2019.


Figures 1 and 2 provide the 2022 CSI and Crime Rate Per 100,000 population for Canada 35 CMAs and ranks them from highest to lowest.  Crime Severity was highest in Winnipeg, followed by Kelowna and Lethbridge while in terms of crime rates, Kelowna topped the ranking followed by Lethbridge and then Winnipeg.  In terms of crime severity, Thunder Bay ranked 7th highest of the 35 CMAs whereas in terms of crime incidents per 100,000, Thunder Bay dropped to 10th spot.  For those interested in a northern Ontario comparison, Thunder Bay's crime severity and crime rate exceeds  Greater Sudbury.


In the case of Thunder Bay, to provide some additional time series perspective, Figure 3 plots both crime severity and the number of police officers per 100,000 population from 2000 to 2022. Crime Severity has fluctuated somewhat over time though it has been on an upward trend since 2015 but remains below the peak year of 2009 when it reached nearly 115. Between 2015 and 2022, Crime Severity in Thunder Bay grew by 27 percent but if one looks at the period 2000 to 2022, then there has been a decline in crime severity of just over two percent.  


Another metric – not shown in any charts here – is the crime rate and the total number of crime incidents.  In 2000, the total number of total crime violations in Thunder Bay was 10,869 whereas by 2021 it had fallen to 8,117 – a decline of about 25 percent. Over the same period, the number of total crimes per 100,000 fell from 9084 to 6940 – a drop of 24 percent. If one takes the 2022 numbers in consideration, the rate appears to have declined further to 5842.


It is always interesting to compare the crime time series numbers to police resource numbers.  Policing numbers per 100,000 have trended upward throughout the period going from 173 officers per 100,000 population in 2000 and reaching 213 in 2022.  This represents an increase in per capita policing resources of 23 percent.  It should be noted that over the same period, the total number of civilian employees grew from 95 to 119 while the total number of officers grew from 207 to 249 – total increases of 25 and 20 percent respectively. 


Putting these increases into perspective, it helps to have some population numbers.  Over the same period, the population of Thunder Bay, Municipal as reported in these crime statistics by Statistics Canada fell from 119,657 to 116,968 – a decline of 2.2 percent. This is certainly a different number than one has seen in the past referring to either the CMA or the municipal population. While this is a larger number than the 2021 census city of Thunder Bay population figure of 108,843, it is also smaller than the CMA census population of 123,258.  One city, many population statistics.


So, that is a brief overview of the numbers. Make of them what you wish.  One imagines that personal and individual experience with crime never mind population growth in Thunder Bay may vary depending on your location or socioeconomic status.

Tuesday 18 July 2023

Population, Growth and Statistics in Thunder Bay


The City of Thunder Bay’s population according to the Census of Canada has remained essentially the same since the 1970s with some minor growth in the surrounding CMA.  This has occurred while elsewhere in the province and country, population soars.  Indeed, the city’s growth rate between July 2021 and July 2022 while positive at 0.2 percent, was actually the lowest in Canada for cities with populations above 100,000. 


With every census, there are the usual concerns with stagnation but despite the census evidence, there are actually two narratives when it comes to population in Thunder Bay.  One story is that given the city’s growth rate in population, there is a lack of economic growth and stagnation is a real concern given that population is attracted to economic opportunity.  When combined with the fact that the city and region appear to be aging faster than the rest of the province, the prospects for a more dynamic future look increasingly precarious.  However, the other story often voiced by local officals is that Thunder Bay’s population is much larger than the official population figures indicate.  In this narrative, Thunder Bay is an attractor for a transient regional population that comes in and makes use of its services. 


Even the current Mayor of Thunder Bay recently was quoted asserting that “he believes there are 15 per cent more people than recorded by Statistics Canada, adding that’s where a lot of the city’s financial problems come from, having to provide services for people that aren’t officially on the books, and hence aren’t counted when senior levels of government hand out transfer payments.” More directly, he said: ““We’ll ride with 120,000, but the police know, the hospitals know, the health-care system knows, and even the mercantile areas know it’s more than that. There’s more people around and if you spent one hour at city hall you’d know there are a lot more people wandering around the city than actually meet any census.” With an offical City population of 108,843 and a CMA/Metro population of 123,258, the mayor’s assertion suggests that Thunder Bay’s actual population range from City to CMA is from about 125,000 to 142,000.


Of course, such assertions would be useful if accompanied by time series data from police, paramedic, and hospital services though even that of itself is not sufficient.  After all, it is possible to have population growth flat, but usage rates rise.  With more use per capita, even with flat population growth, one could see paramedic or police services rise in total incidents.  Indeed, rising usage for hospital and paramedic services could be a function of a larger transient population or it could also be the result of an aging population.  However, without more detailed data, simply saying “if you spent one hour at city hall you’d know there are a lot more people wandering around the city than actually meet any census” is probably not going to cut it with the city’s governmental transfer partners. 


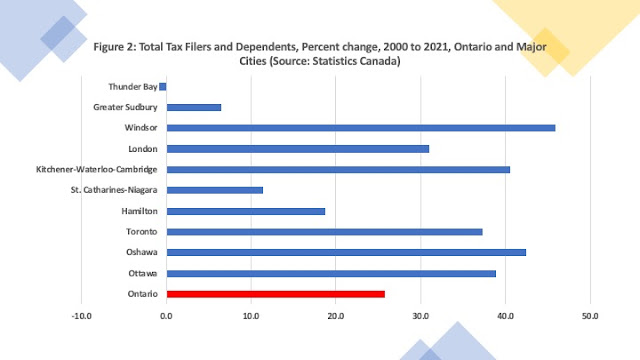
In the search for other approaches to the numbers, another way at looking at growth in a city is through federal tax filer data collected by the Canada Revenue Agency and disseminated through Statistics Canada.   The accompanying Figure 1 presents an index for the number of tax filers and their dependents for the period 2000 to 2021 for Ontario as a whole and a number of its major cities with the year 2000 set at a value of 100.  Over this period, the total number of tax filers in Ontario rose from 11,331,080 to 14,248,730 which when normalized with 2000 equal to 100 means Ontario went from 100 to 125.7 for an increase of 25.7 percent (See figure 2).  Over the same period, Thunder Bay went from 120,140 to 119,180 which when normalized goes from 100 to 99.2 for a decrease of -0.8 percent.  Indeed, of the cities on these two charts, Thunder Bay is the only one that sees a decrease in the number of total tax filers and dependents.


Does this mean that the mayor is wrong? Not necessarily. Given that the assertion is that these additional users of services are transient or temporary population, there is no reason that they would be registered with a residential address in Thunder Bay for income tax purposes.  All these figures do is confirm the official narrative from the Census and Statistics Canada that Thunder Bay’s population is essentially flat and has been for quite some time.  If there are indeed a large number of unofficial residents moving to and from the city using its services, then Thunder Bay needs to do a better job of presenting a credible statistical method of capturing that population.

Saturday 17 June 2023

Building 21st Century Thunder Bay


Monday evening promises to be another long haul at Thunder Bay City Council given the conjunction of issues that will be arriving.  In many respects, the issues of revamping the library system and redeveloping Victoria Avenue will help define the city for the remainder of the 21st century.  A common theme to all these issues is downtown development, always a complicated issue in a city which now has three downtowns as well as several smaller neighborhood cores.  And to further spice things up, Thunder Bay has been left off the list of Ontario cities with strong mayor powers.  However, this is not a slight given that Thunder Bay has company in southern Ontario with  other big city places like Newmarket and Chatham-Kent which have been left off because they also have not yet submitted a housing pledge to the provincial government.  The strong mayor powers are generally designed to help fast track housing development.


However, the issues of downtown development and housing can be linked and the current issues facing Thunder Bay City Council with respect to a new library master plan, the demolition of Victoriaville and housing development could be linked facilitating a case for the allocation of strong mayor powers to Thunder Bay – assuming that is a direction we want to go.  Given the often insular and informal backroom nature of decision making in Thunder Bay, it is not surprising that informal polling suggests that the majority of people in Thunder Bay are not overwhelming keen on having the mayor’s office gain additional powers.


The issues in summary are as follows.  First, a $17.5-million preferred design for the demolition of the Victoriaville Mall, reconstruction of Victoria Avenue, and addition of new public spaces will be considered by City Council as part of yet another plan to revitalize the city’s south core.  The demise of the core has been ascribed to the decision to close up the traditional main thoroughfare – Victoria Avenue – with the building of the mall in the early 1980s.  This was done as part of another plan to revitalize the core in a manner akin to downtown north (Port Arthur) which had a new mall built there known as Keskus.  Keskus is now gone and the north core the home of a casino, new restaurants, a waterfront park and hotel, cruise ship dock and condo development, and is now considered the entertainment district.  The hope is now that opening up the south core to traffic will also spur revitalization.  The estimated cost is $17.5 million but realistically we can probably multiply that by two by the time everything is done given the history of public sector projects in Thunder Bay.


Second is the new master plan set of proposals for the future of the Thunder Bay library system.  The current system has four branches with two on the north side and two on the south side reflecting the traditional distribution of neighborhoods and population.  However, over time the two downtowns – where the two largest branches are - have seen fewer residents and the gist of the library system renewal plans are a new central location in the intercity area.  Three scenarios have been proposed: Plan 1) Retention of M.J.L. Black and County Park, retention of the two downtown locations (albeit downsized) and a new central branch located in the former Lowe’s store at Intercity Shopping Center. Naturally, this is modified status quo plus one making it politically the most palatable as well as the most expensive at $9.1 million. (However, see earlier caveat about public sector projects costs in Thunder Bay).


Plan 2) A central branch again at the former Lowe’s store with retention of County Park, Waverly, and M.J.L. Black with the closure of Brodie.  Cost of this option, $8.3 million.  What is interesting here is the juxtaposition of revitalizing the south core by opening up Victoria Avenue while removing a key amenity such as a major public library.  Given that many homeless people have been using both the enclosed Victoriaville center as well as the Brodie library as supports, their joint removal would create a new set of issues for Thunder Bay.   In addition, the Brodie Branch does have some historic significance as both a landmark and a Carnegie Library and naturally there would need to be a plan to deal with that aspect. On the other hand, there would still be four branches and politically this might sell depending on how many friends the Brodie location has.


Plan 3) A central branch located at the former Lowe's at Intercity Mall. There would be two neighborhood locations at Waverley and MJL Black. Brodie and County Park locations would close. Cost would be $7.7 million.  In strict cost terms, this makes the most sense but the issues with respect to Brodie raised under plan 2 holds and to that would be added neighborhood interests for the County Park branch.  In the end, this option would generate the most opposition though going to a more stream-lined system of only three branches might be seen by some as an advantage. 


What is common in all three of these plans is of course a new central location that is not a new build but a repurposing of existing mall space. This has pluses and minuses.  The biggest minus is that no one really lives in the intercity area and in a car dependent city like Thunder Bay, despite the official ceremonial attachment to environmental causes and bike lanes, it means yet another reason to drive to the area.  This is an area which incidentally still has freight trains merrily winding their way thru at the most inopportune times.  The biggest plus is also that it makes use of existing mall space and transforming underused mall space into other uses is a good thing. 


It would be more helpful if along with putting amenities in intercity, there was more of a plan to put density housing there too. In the end revitalization of core areas helps to have people living in and around them because downtowns traditionally have a lot of amenities within walking distance.  In the case of the former core areas of Port Arthur and Fort William, many of those amenities have over the years migrated to the inter-city area.  The inter-city area has become the de-facto main downtown of Thunder Bay and yet there has been no follow through to also put in more apartment or condo buildings.  Intercity mall is a case in point, with its retail and a new library, a residential development at its north end would create much needed housing and help create the urban density that Thunder Bay claims is one of its goals.  Indeed, density housing projects – six to eight story apartment and condo buildings – in both former downtown cores as well the intercity area – would be a way of Thunder Bay helping meet provincial government housing targets.  This could indeed be the type of plan that would allow the provincial government to grant the city strong mayor powers, but it requires a vision and to date there is no vision.


While Thunder Bay has not been growing robustly in terms of population, it appears that there is a demand for housing given the recent move to increase density in existing residential neighborhoods via basement apartments and mother-in-law suites, while paradoxically also expanding standard suburban residential developments.  One suspects if well-designed quality and affordable apartment and condo housing was more available in any of Thunder Bay’s three “downtowns” one suspects there would be a definite demand for it.  Again, building it requires a vision as well as the will and the ability to implement the vision.   It also requires a more favorable municipal tax rate for multi-unit residential.  To date, all this has been lacking and we are left with incremental changes that do not always work together to build integrated and thoughtful end results. 


Saturday 1 April 2023

The Thunder Bay That Never Was


For all sad words of tongue and pen.

The saddest are these, “It might have been.”

John Greenleaf Whittier


As a result of its historic evolution from the twin cities of Fort William and Port Arthur, Thunder Bay has always had two former downtown cores that have been the focus of constant attempts at revitalization as well as a third commercial retail core in the former intercity area.  Three downtowns for a city of 125,000 is a lot of downtowns and yet the process of revitalization continues unabated.  The latest iterations are the recent local media stories dealing first with the downtown north core which being adjacent to the waterfront has emerged as the “entertainment” and “tourist” district.  A planned reconstruction of the downtown street here to emphasize walkability at a total of $13.2 million is now considerably above the original estimates.  And on the other side of town, there is another major streetscape project that is even more involved as it requires the complicated dismantling of the Victoriaville Mall which was placed on top of the major downtown intersection at Victoria and Syndicate.  This too will require many millions of dollars – about $11 million in one estimate - and is likely to see cost increases before we are done. 


The evolution of both downtowns has marked a return to more open street and pedestrian spaces that were blocked by the erection in the 1970s and early 80s by downtown street enclosing and blocking malls – Keskus on the north side and Victoriaville on the south. Keskus was finally demolished in 1999 to make way for downtown development centered on the arrival of the OLG Thunder Bay Charity Casino.  The result has been a more vibrant downtown area of shops and restaurants.  There is a similar expectation of this happening in the south side after the removal of Victoriaville Mall.  In the end, both downtowns along with the intercity area have evolved to some extent in a manner remarkably similar to the paths outlined in several Chronicle Journal newspaper articles and opeds authored in the late 1980s and early 1990s (CJ “Assign each city core its own specializations, Weds. July 26, 1989; CJ City at a Crossroads Series, November 16, 17 & 24, 1990).  That is “core specialization” with the north side downtown a “tourism-commercial” area given the presence of the harbour and waterfront, the south side downtown an “administrative-commercial” area given the concentration of city government there and intercity area as “commercial-industrial”. 


With some exceptions this is somewhat what has happened.  The former Port Arthur Downtown has a waterfront park and the arrival of the new Art Gallery will be an important addition to a critical mass of activities and functions making it a tourism and entertainment core.  The former Fort William downtown has City of Thunder Bay offices making it the administrative core.  Meanwhile, intercity has become the choice for new retail development.  At the same time, there is a lot of inconsistency given that the community auditorium is in the intercity area rather than in a spectacular waterfront setting, there is still a substantial city office and utility presence in the Whelan building in the north core and the main arena complex – the Fort William Gardens – remains in Fort William.  And then, a plethora of public buildings – Mini Queen’s Park, a new federal building, and the public health unit as well as assorted offices – went outside the Fort William Core to off of Arthur Street, the Balmoral Area and intercity.  However, given the long-established urban pattern and historical rivalry between the two twin cities, such is the weight of history and adjustment, and change takes a long time in Thunder Bay.  And there is the reality that private developers will develop land they own to realize a return and not necessarily to implement an urban planning vision.


Still, change has occurred but all of this change and development pales somewhat with the anticipated urban renewal and development plans of the 1960s.  Urban renewal gripped Ontario municipalities in the 1960s and the former cities of Port Arthur and Fort William commissioned consultants coordinated by engineering firm Proctor and Redfern to put together comprehensive studies and recommendations on their downtown cores.  They were comprehensive plans for renewal of the aging cores that included general land use, streets and traffic analysis, parking, pedestrian circulation, and transit that assumed that both downtowns would retain their comparative size and strength and remain centers of activity.  The Port Arthur Report was delivered in February of 1968 and the Fort William Report in April of 1969.  


The before and after illustrations are quite dramatic.  Port Arthur has plans for a dramatic waterfront park and civic centre and plaza, plans for streetscaping and a new senior complex.  Fort William’s downtown plan was even more ambitious with apartment blocks along Vickers Street, a new civic complex and riverfront park adjacent to the current city hall. The removal of the tracks along the Kam River was shown with a new thoroughfare and a set of high-rise riverfront dwellings along a park and boardwalk.  As for shopping, a new retail mall on land off of May Street to be called the Kam Center was proposed. As the accompanying illustrations show, the downtowns especially in Fort William were to be higher density areas and pedestrian intensive.  In many respects, the downtown areas would be “15 minute” cities with many services within walking distance of where people lived.


Alas, the reports presented an urban downtown picture that did not come to pass for a variety of reasons.  First, they of course were made immediately obsolete by the Amalgamation that fused the two cities together and the resulting politics created new initiatives that included two downtown malls as part of core revitalization.  Second, the plans failed to anticipate and realize the rise of the intercity area which after Amalgamation meant it was poised to be readily developed as the choice location given it was between the two population clusters.  Third, the 1970s much like the rest of the country saw a suburban housing boom that led to car intensive sprawl rather than infill in the downtown cores.  And finally, there was a massive overestimate of where Thunder Bay’s population was going given that the proposals assumed rather robust population growth for the Lakehead area that by 1986 was forecast under various assumptions to range anywhere from about 150,000 to 175,000.  Indeed, under such assumptions, Thunder Bay today would be well over 200,000 but such growth was not supported by the future evolution of either the city’s economy or its demographics


At the same time, the Port Arthur waterfront park envisioned in 1968 has in many respects come to pass though without the massive civic plaza.  And the rehabilitation of Arthur Street (now Red River Road) has occurred as well as the senior’s complex on Cumberland.  As for Fort William, the results are more disappointing in that there is no William McGillivray Boulevard skirting the Kam River and a riverfront park and boardwalk, or density high-rise housing along the riverfront or a new Civic centre adjacent to the current City Hall.  As for retail, the street blocking Victoriaville emerged in the late 1970s but not the proposed Kam Centre.  The urban reality that evolved reflected the needs and wants of the times as well as the political environment.  Still, it is fun to look back and wonder what might have been under different circumstances.  There may even be some ideas in those old plans worth exploring further.

Wednesday 22 March 2023

Thunder Bay and Sudbury: A Tale of Two Economies


The Conference Board of Canada has issued its March 2023 Metropolitan outlooks for Thunder Bay and Greater Sudbury and the immediate news looks good for Thunder Bay.  As a result of the construction of a new provincial jail in Thunder Bay over the new two years, Thunder Bay is expected to see its real GDP grow 3.6 percent in 2023 making it number 1 out of 24 comparable CMAs for economic growth.  On the other hand, Sudbury at only 1.4 percent projected growth for 2023 is still doing well and expected to rank 12th out of the same 24 CMAs.  Sudbury is doing well as a result of expected persistence of demand for nickel given the growth of the electric car industry. In terms of how Thunder Bay and Sudbury will fare in the longer term based on these economic drivers, the Conference Board projects that Sudbury will see some continued growth particularly in employment but Thunder Bay after the construction boom is expected to falter somewhat given the absence of a more robust long-term driver. 


Figures 1 and 2 plot both real GDP growth and employment growth for Thunder Bay, Sudbury and Ontario as presented by the Conference Board reports.  While 2023 sees Thunder Bay surpass both Ontario and Sudbury for growth, for the 2024 to 2027 period, Sudbury sees real GDP growth stay at about 1.5 percent while Thunder Bay falls to just over one-half of one percent.  Despite the anticipated slowdown in 2023, Ontario real GDP growth recovers to an average of over 2 percent for 2024-27. In terms of employment growth, Thunder Bay sees a surge to a 4 percent growth in jobs created for 2024 but eventually sees employment shrink moving into 2025 to 2027.  While Sudbury also is expected to see lower employment growth moving forward, it remains positive to 2027.


And finally, Figure 3 provides a retrospective on local investment spending for the two cities in terms of the value of building permits from 2014 to 2021.  Fluctuations notwithstanding, the long-term trend up to 2021 has been slightly positive for Sudbury, and slightly negative for Thunder Bay. Going forward, housing starts are an important component of building permits, and the provincial and federal budgets are expected to see some initiatives for boosting housing spending.  The Conference Board is forecasting that total housing starts in Thunder Bay will fall from 193 units in 2021 to 161 in 2023 but then start to increase reaching 237 by 2027.  Sudbury is expected to follow a similar pattern declining from 434 starts in 2021 to 269 by 2023 but then recovering to 301 by 2027.


Both communities have aging populations which in the absence of economic opportunities attracting large scale immigration means that investment, employment, and real GDP growth in the long term will lag the rest of the province. One potential game changer is of course in the area of mining for both communities given the global demand for critical minerals and the expected development of the Ring of Fire.  Tomorrow’s provincial budget may provide a glimpse of what might happen there in terms of infrastructure spending.

Saturday 18 March 2023

Urban Density, Rules, and Thunder Bay


The big rage in urban policy these days is the 15-minute city – that is, living in an urban area where everything is 15 minutes away.  One could argue that Thunder Bay has been a 15-minute city for decades – no part of town is more than 15 minutes away by car.  However, the modern incarnation of the 15-minute city is one where most things one needs in the process of daily life – medical services, schools, retail, services, etc…- are within a 15-minute walk from where you live.  This used to be a feature of early cities that persisted well into the 19th century but with urban growth and the advent of the automobile and suburbanization, we have moved away from that.


Nonetheless, Thunder Bay is also trying to move into the new age and part of that process involved its new Zoning By-law that passed in April of 2022.  While not ostensibly part of an official plan to build the 15-minute city, it is designed to encourage urban density.  Among other things, the plan levels “residential zoning across the city, opening the door for homeowners to subdivide any detached house, build new homes on smaller lots, and even allow for residential housing in backyards”.  In part this is expected to expand the rental housing market by allowing for more basement apartments – many of which already exist – to come out into the housing stock fully and legally and expand affordable housing.  Even the Chamber of Commerce has got into the act by supporting this policy as a return to mixed use neighborhoods and the creation of “walkable neighborhoods” where you can walk down the street and get groceries or a cup of coffee.


Of course, the problem is that in Thunder Bay, as is often the case, the left municipal hand does not always move in accord with what the right municipal hand is doing.  There is a degree of policy inconsistency.  On the one hand, April 2022 saw a new zoning bylaw designed to encourage urban density through a process of infill while September of 2022 sees the same municipal entity initiating planning to expand the Parkdale suburban subdivision that also requires a substantial extension to the city’s sewer infrastructure.   On the one hand we want more density in existing residential neighborhoods, but we also want new suburban residential developments.


However, such inconsistency is minor given it is traditional not only in Thunder Bay but across municipalities in Ontario.  It is rare to find a municipality – especially in today’s era of “housing shortages” that would not jump at the prospect of new development and associated tax revenues and development charges.  The more serious issue for Thunder Bay is that despite being a city with a CMA population of 130,000, it really feels like a much smaller and spread-out place because of its historic development as two cities.  What is actually required is more density buildings in the four to eight storey range just off of existing commercial and retail areas – including the old downtown cores.  Simply allowing for more basement apartments in existing suburban neighborhoods does nothing for “walkable communities” as they all need cars to get anywhere anyway.  If anything, this makes a car-centric city worse. Pretending that more basement apartments in areas remote from shops and services will create walkability is simply aspirational urban planning.


What is starting to happen especially in some of the older “modern suburbs” built circa 1960 and going forward is basement apartments being allowed without consideration for the spillover effects of more residents and especially more vehicles.  The new zoning bylaw allows 1.5 vehicles per home but some of these rental homes now have 3 and 4 vehicles most of which end up being parked on the street.  The amount of traffic on some residential streets is noticeably higher – and one should note faster.  And if the new units happen to be close to the university or college, there are invariably a lot of overnight guests adding to the urban street scene.


Even all this could be worked around if the City of Thunder Bay actually followed up its plans with some type of concerted implementation.  Case in point. Snow removal. The city has calendar parking in residential neighborhoods to facilitate snow clearing.  That is on even calendar days you park on the even address side of the streets and on odd calendar days you park on the odd side.  This allows for easier and efficient snow clearing as one side of the street is always clear after a storm. 


The problem is there are now too many cars on some streets for the parking available at the homes, so they invariably need to be parked on the road and in the winter rotated from side to side.  That has become too bothersome for the average Thunder Bay resident who prefers to park willy-nilly wherever they feel like  and so there are always cars on both sides no matter what day it is.  And if snow is in the forecast, no one cares because facilitating snow removal is a community benefit and the constant turnover of new rental residents with weaker ties to the neighborhood means they do not care as much.  Moreover, the city rarely, if ever, tries to go down streets and ticket violators as part of a program of regular enforcement – no doubt because they are “short-staffed”.  On days when it does snow, the snow plough operator has difficulty getting through the street resulting in an uneven job.  And to make it worse, more often than not even the city plough operator does not follow the rules ploughing the even side on an even day when parking there is allowed and vice versa.


Thunder Bay has in many respects again become the wild west. Rules? They appear to have become voluntary unless someone decides they are not.  Try following the speed limit in a school zone with two large F-150s behind you and see what its like.  If you want rules, you follow them if you like, it is your choice, seems to be the mantra.  Yet, with increased density and more people living in closer proximity, following the rules should be more and not less important.  Thunder Bay has always been a place full of independently minded people doing whatever they want when they want and that appears to extend to the city government itself which makes plans and rules and does not enforce them or even try to implement them properly.  To be fair, some of this behaviour is continued fallout from the pandemic and a reaction to the rules and restrictions that were imposed.  There is a process of social and behavioural adjustment under way in cities across Canada, and it is not over yet.  Still, it remains that the long-term outcome here is not going to be some type of urbanite planning fantasy of happy renters and homeowners co-existing in walkable suburban communities strolling hand in hand to save the environment while the city wins urban planning awards.  Rather, it is going to result in a deterioration of urban quality and community life for many residents of Thunder Bay as a result of aspirational planning with no follow through.


Friday 13 January 2023

Municipal Employment in Thunder Bay: An Analysis


The last post presented an overview of what for lack of a better term can best be described as higher tier municipal employment in northern Ontario – that is individuals in the five major municipalities of northern Ontario who earned $100,000 or more in annual salary (let's call them Listers) thus placing them on the public sector salary disclosure list.  What was interesting in the overview was that Thunder Bay in 2021 had the most municipal Listers at 547 followed by Sudbury at 540, then the Sault at 246, North Bay at 187 and finally Timmins at 142.  This ranking roughly parallels population size with the exception that based on population, one would expect Sudbury to exceed Thunder Bay.  The per capita cost of municipal employees on the public sector salary disclosure list was also the highest in Thunder Bay of the five cities.  As a result, a more detailed look at trends for Thunder Bay is of interest.


Figure 1 plots the number of Thunder Bay  municipal employees earning $100,000 or more over the period 2017 to 2021 and shows that the number was relatively stable over the 2017 to 2019 period but took a large leap in 2020 (to 558 from 452) and has remained at approximately the same level (at 547 in 2021).  The percentage increase in the number of employees over $100,000 in 2020 was approximately 24 percent and at the time was attributed to a large number of employees in protective and emergency services who had been just under the threshold for a number of years going over.  However, this is only part of the story as the increase in the total wage and salary bill of municipal Listers (see Figure 2)  in Thunder Bay from 2019 to 2020 was nearly 30 percent.   That is the salary bill for those on the list  increased more than the number of employees on the list  suggesting compensation increases drove a portion of the increase.  And indeed, compensation particularly of higher tier administration and management was an issue last year with some increases approaching 12 percent.  This could be seen as particularly annoying by others in the broader public sector - particularly  front line workers in health and education - who were limited to one percent annually by Bill 124 while the municipalities were exempt.


Depending on what you think is the total municipal employment of the City of Thunder Bay, those making over the list probably make up anywhere from one-fifth to one-third of the City’s municipal employment though given the absence of readily accessible municipal employment numbers, these are estimates at best.  One thing that does not need to be estimated however is the ratio of the total wage and salary bill of Thunder Bay municipal employees earning $100,000 plus to the total value of the tax levy as illustrated in Figure 3.  Between 2017 and 2019, this share averaged 27 percent but in 2020 it took a leap to 36 percent  and then declined to about 34 percent in 2021.  In any event, one could make the case that the value of the wage and salary bill accounted for by those Thunder Bay municipal employees earning $100,000 plus represents over one third of the tax levy.  


Figures 4 and 5 round out the analysis by presenting first the average salary of Thunder Bay municipal employees on the List and then the per capita cost of these employees.  Again, 2020 – the pandemic year – is the crucial point in time.  In 2020, the average salary per List member rose just over  5 percent  - going from $121,002 to $127,091.  Meanwhile, the per capita cost of those on the municipal salary list rose from $494 to $640 – an increase of nearly 30 percent.  Between 2019 and 2020, the number of municipal Listers grew from 452 to 558 (24 percent) while their salary bill went from $54.7 million to  $70.9 million (30 percent increase).  Thus the average salary rose by about the difference.  However,  when you spread that salary bill across the entire population of the municipality you get a somewhat different result - salaries rose 30 percent but population growth was flat. 


The List get a lot of attention every year.  While accountability is important, it remains that the real accountability measure is not how much is being paid out but the value received for that money as well as its sustainability over the longer term.  It is not that people on the list are making too much given what they may or may not do or that their salaries rose too much or even that there are a lot more of them.  In the end, you do get what you pay for even in the public sector.  The real issue is that the cost of services has grown dramatically but the tax base and population of Thunder Bay have not.  Thunder Bay’s official population has stayed flat at about 110,000 people over the period 2017 to 2021, the value of the tax levy grew from $184 million to $204 million – an increase of 11 percent  but the wage and salary bill of its municipal list employees has grown from $50.1 to $69.6 million dollars – an increase of nearly 40 percent.  


No one is saying that those employees are not worth what they are being paid or are not deserving of their pay especially given the travails of the pandemic.  However, ultimately  the money does have to come from somewhere and to date the solution has simply been to pass the bill onto municipal ratepayers - something that was aided by the Ontario government under the provisions of Bill 124 which exempted municipalities because they had "own source revenues" - that is a municipal tax base.  It would appear a number of fiscal and budgetary chickens are coming home to roost.

Wednesday 4 January 2023

Thunder Bay 2023 Budget Is Out: Highest Tax Levy Increase Since 2015 Proposed

 The City of Thunder Bay has released its proposed 2023 budget and it looks like the biggest tax increase in recent years.  The proposed budget is increasing the tax levy by  6.18 percent (just under 6 percent after tax base growth) which will raise the total tax levy by nearly 13 million dollars and bring the total tax levy to over 220 million dollars.  As the accompanying figure shows, this will be the largest tax increase since at least 2015 and probably since 2006.  In terms of tax levy increases for the 1991 to 2023 period,  since 1991, Thunder Bay tax levy increases have ranged from a high of almost 22 percent in 1998 to a low of -1.7 percent in 1995.  If enacted, this proposed levy increase will be the fifth highest since 1991.  The current Mayor campaigned on keeping the tax increase low and reduce bureaucracy but this proposed budget comes apparently with an additional 50 full time equivalent employees.  With inflation running at over 6 percent, the proposed budget comes pretty close to the inflation rate which is not unexpected as signals to this effect have been ongoing for months.   However, one suspects the Mayor will at least make an effort at vocal displeasure at this increase given that it is the fifth highest increase since 1991, the highest increase in nearly twenty years and he was the mayor from 1997 to 2003 which means he was also in office as the Mayor during the highest levy increase in the 1991 to 2023 period.  A legacy associated with some of the highest tax increases in Thunder Bay's municipal fiscal history is not something the mayor probably is interested in.  The reaction of the rest of council and the public will be key.  These are of course very preliminary numbers and reaction on my part and the full budget has yet to be posted on the city web site at the time of writing but will take a look at the details in coming days.


Saturday 5 November 2022

Does Balloting Method Matter?


The October 24th municipal election in Thunder Bay featured an assortment of voting options in an effort to make voting more convenient and thereby encourage greater turnout.  On that front, the results were not favorable in that despite the increased options for the 2022 election, there was a decline in turnout.  Apparently, about 43 percent of the city’s 83,679 eligible voters cast a ballot which was down from nearly 51 percent in 2018.  While Thunder Bay voters were more engaged than the provincial average, the results were a disappointment given the effort expended.


What is also of interest is whether or not different voting methods may be associated with the outcomes.  A case in point is the Councillor-At-Large Race which saw 140,095 ballots cast.  Given that there were about 35,980 voters who cast ballots, and each could vote for up to five choices, this means that a total of 179,900 votes were up for grabs.  Given that only 140,095 were cast – 78 percent of those available –a proportion decided to vote for fewer than five candidates.  This suggests that some voters were unhappy with the available choices even given the large number of candidates or may have been voting more strategically by voting for their preferred candidate(s) and not supporting anyone else.


More to the point is the difference between the number of paper ballots and internet ballots cast.  Of the 140,095 ballots cast, 50,403 (or 35 percent) were paper ballots while 89,692 (65 percent) were internet ballots.  This suggests that there was indeed a marked preference for internet voting in this election.  Figure 1 shows the results for total ballots cast with the five winners in red – Bentz, Ch’ng, Giertuga, Agarwal and Etreni – followed by Judge, Barrett, and Margarit.   


If one looks at only the paper ballot results, the winners would be Bentz, Giertuga, Ch’ng, Judge and Agarwal, followed by Etreni, Barrett and Mauro.  If one only uses the internet results, the five winners would be Bentz, Ch’ng, Giertuga, Etreni and Agarwal, with the next three spots taken by Barrett, Judge and Margarit.  While the top three spots were unaffected – and went to incumbents – there were differences in who would occupy the next two spots.  Paper ballots alone would see Judge and Agarwal on council with Etreni in sixth place while internet balloting alone would see Etreni and Agarwal with Barrett in sixth place.


Can one draw any conclusions from these results? Without detailed data that allows you to correlate voter characteristics (eg. age and income) with ballot method preferences and voting outcomes, it is difficult to really know if these results mean anything at all.  However, it is not too much of a stretch to argue that most important conclusion is that candidates need to campaign to attract both types of voters – paper ballot voters and internet voters.  Victory is ensured by coming out on top in both types of voting methods.  Voters who prefer internet voting are probably more likely to be web and social media savvy and will require a more sustained campaign targeted towards them as well as more traditional door to door type campaigning. 


In the end, internet voting makes it easier to vote well in advance of election day meaning much of the campaign is over well before the official voting day.  However, if you are an incumbent, name recognition alone seems to guarantee a top place finish. It is only for the new entrants that campaigning vigorously on a variety of platforms seem to matter more.


One other thing. Given the differences across voting platforms that can emerge and the rather erratic flow of results on election night, it is imperative that the release of results be better coordinated in future.  One can only imagine the effect on candidates as they watched their rankings seesaw in the blink of an eye on election evening as internet voting tallies flooded in.