Northern Economist 2.0

Wednesday 23 October 2019

The Federal Election Results: Northern Ontario


The people have spoken, and Canada has a minority Liberal government.  In my home community of Thunder Bay, there will be double representation on the government side as both ridings went Liberal.  This however was not the result of strategic voting or a calculated decision by the local electorate to go with what they saw as the winning side but the outcome of ingrained behaviour.  Thunder Bay always votes Liberal at both federal and provincial levels except on occasion when it goes NDP because the voters feel the Liberals ought to be punished.  However, their NDP support is a temporary dalliance and they ultimately return to their original faith.   

If Monday’s election had yielded a Conservative minority or majority, then Thunder Bay would have been on the outs and of course complaining incessantly about the lack of government attention. Yet, loyalty to one party by a smaller and more remote community does not always ensure you will get what you want if your team is in power.  If your support is always assumed to be there, than that can also work against you when it comes to getting your issues on the table.

Electing a variety of representatives over the years based on calculation rather than political faith or loyalty is another approach to collective voter wisdom and diversity in outcomes over time is one way of ensuring your support is not taken for granted.  While Thunder Bay generally always votes the same way, nearby Kenora is much more flexible and over the years has voted in representatives at the provincial and local level affiliated with all three of the major parties.  This time, they switched from Liberal to Conservative at the federal level.   

While parts of northern Ontario seem to be closed shops when it comes to voting patterns, the region as a whole, has actually elected a diverse portfolio of representatives with the balance what one might term centre-right rather than centre-left - if you assume the Liberals are more centrist than the other two parties.  Given that the Liberals and NDP generally term themselves as “Progressive” the region as a whole is probably more centre-left.  One can only imagine what the “Progressives” would now term themselves if the federal Conservatives had not rebranded and retained their “Progressive Conservative” label.

In terms of results for the 10 ridings, they are:

Kenora: Conservative
Thunder Bay-Rainy River: Liberal
Thunder Bay-Superior North: Liberal
Timmin-James Bay: NDP
Algoma-Manitoulin-Kapuskasing: NDP
Sault Ste. Marie: Liberal
Nickel Belt: Liberal
Sudbury: Liberal
Nipissing-Timiskaming: Liberal
Parry Sound-Muskoka: Conservative


On a map, electoral northern Ontario is a bit of an oreo sandwich made up of two conservative graham wafer borders -Kenora and Parry Sound-Muskoka - and a rather large dollop of Liberal cream accented with some additional NDP filling.  Obviously, northern Ontario voters as a whole like their electoral food spiced with diversity even if smaller regions within prefer more monotonous diets.  However, if one takes a pan-northern view, the north is greater than the sum of its local parts when it comes electoral wisdom and has made sure it has its bases covered.

On a final note, a special congratulations to Eric Melillo who pulled ahead of incumbent Bob Nault to win the Kenora riding.  Eric is a graduate of the Economics program at Lakehead University and I am thrilled to see him do well.  Eric was a hardworking and keen student in Economics and a very pleasant young man and I wish him all the best.

Thursday 21 March 2019

Reflections on a Town Hall: Trudeau in Thunder Bay

Well, in the wake of the release of the 2019 Budget, Prime Minister Trudeau is off to Thunder Bay where he will be hosting a Town Hall on the campus grounds of Lakehead University on Friday March 22nd.  Indeed, the preparations for his arrival are already underway as the grounds of the C.J. Saunders Fieldhouse where the event will occur are being swept and tidied up from the accumulated grit of a harsh winter.  This is apparently Trudeau’s first visit to Thunder Bay since 2016 which is a signal that the election campaign is already underway.  The festivities get underway at 7 pm (but if you want a front row seat you need to register and arrive by 5:00 pm).

Thunder Bay can be considered a relatively politically safe place for the federal Liberals to have a Town Hall given the two ridings have returned mainly Liberals to Ottawa for nearly 100 years.  Thunder Bay voters are actually very conservative voters in the sense that they dislike change and always do the same thing – that is, return Liberals to Ottawa.  The only way they deviate from their inherent conservatism is to actually vote Conservative. Indeed, the last federal Conservative party politician who was elected was Robert Manion, who if memory serves me correctly, was around in the 1930s.  Of course, there was MP Joe Commuzzi circa 2007 – who started as a Liberal but then switched to the Conservatives and served as a Minister– but he was not elected as a Conservative so my initial point stands.

So what issues will Prime Minister Trudeau have to face in Thunder Bay? Well, the audience is likely to be filled with gushing supporters who will hang on his every word and engage in numerous standing ovations despite the recent disillusionment over the SNC-Lavalin-Raybould Affair.  Indeed, the Prime Minister is probably looking forward to an evening’s relief from the stress and acrimony of Ottawa.  There is nonetheless the potential for some fireworks and charged questions on a number of topics should the Town Hall decide to deviate from what is likely to be a large pep rally.  For those who might be interested, here are the parameters of just two interesting question areas.

What is the Federal Government going to do to help Thunder Bay address the December 2018 report by the Office of the Independent Police Review Director on relations between Indigenous People and the Thunder Bay Police Service? It is true that the local police are a municipal function and municipalities are creatures of the provinces, but it remains that First Nations and Indigenous peoples are a very important responsibility for the Federal government.  The recommendations for the Thunder Bay Police Service are going to involve a substantial increase in expenditures on an already stretched municipal tax base.  Is there any real federal financial assistance coming or is Thunder Bay on its own in dealing with this? Indeed, given that Thunder Bay is a regional centre for health and education services for area First Nations, what can the federal government do to assist in this regard?

As well, what is the Federal Government doing to actually implement its own growth plan for the  Northern Ontario economy?  All of us are familiar with the 2011 Northern Growth Plan released by the Ontario Liberal government which, over the course of the next 25 years, was supposed to assist the North in reversing its economic decline.  Well after five years of the provincial Northern Growth Plan – the plan to end all plans – the population of the North remains flat, employment is down and the value of new investment is also down.  

This lacklustre result has not deterred the Federal government from announcing its own Prosperity and Growth Strategy for Northern Ontario in April 2018 with twelve areas of action.  However, since then there really has not been much to be seen and heard as to specifics of what this strategy entails, aside from mentioning the strategy whenever there is an announcement of federal money from FEDNOR as was the case in Sudbury in December 2018.  Aside from this, there is little to be found in a Google News search when the term "Prosperity and Growth Strategy for Northern Ontario" is typed in.  So, is there an actual Federal action strategy for Northern Ontario or is it just another election marketing ploy?

I guess we will have to wait until tomorrow night to see if we learn anything new.  I for one expect there will indeed be some entertainment involved in this Town Hall Meeting.  Who knows, maybe we'll even get yet another announcement of federal support and commitment for the Ring of Fire? At the very least, in an election year one might expect some federal infrastructure dollars to finish four-laning the highway to Nipigon.

Thursday 3 January 2019

Ontario's North and the Future of Labour Force Growth


Northern Ontario and New Brunswick are similar in population size and face similar economic challenges given their rapidly aging populations and slow population growth.  However, with its provincial status, New Brunswick is often able to attract considerably more attention for its predicament as opposed to Ontario’s north whose issues are essentially buried within a much larger population focused on the GTA.  Indeed, a spate of stories over the years have noted New Brunswick’s declining birth rate, its outmigration, and its shrinking population.    

It is now common knowledge that northern Ontario’s population is aging at a more rapid rate than the rest of Ontario and that its population growth now rests on its Aboriginal population which is both younger and faster growing than the rest of the population.  Indeed, the 2016 Census showed that population was actually increasing in some northern Ontario Districts and attributable to the rising aboriginal population.  Given the projected labour shortages for northern Ontario that have been forecast as a result of an aging population and outmigration, it stands to reason that the Aboriginal population will have to play an increasingly important role in filling positions.

This role for the growing Aboriginal population has not only been noted for northern Ontario but for Canada as a whole which also faces the prospect of labour shortages given that nearly 20 percent of current employment is filled by those aged 55 years and older and the decline in labour participation rates particularly among those aged 15 to 24.  In his remarks made as part of the David Dodge Lecture in Public Finance at Queen’s University last spring, Bank of Canada Governor Stephen Poloz noted that: “Employment rates among indigenous peoples—one of the youngest demographic groups in Canada—remain well below those of the rest of the country.”

This is the challenge, not only for northern Ontario but for Canada as a whole.  For employment rates among our Aboriginal population to go up, they need to increase their participation rates and as the accompanying figure illustrates – there is much work to be done.  Figure 1 shows that the labour force participation rate for the Aboriginal population over the period 2007 to 2017 has remained consistently below that of the total population.  The average labour force participation over this period for the total population for those aged 15 to 64 is 78 percent compared 64 percent for the aboriginal population.  Figure 2 shows that a consistent gap also is present for the employment rate for those aged 15 to 64 which averaged 72 percent for the total population but 61 percent for the aboriginal population.


Needless to say, this national situation is invariably also a feature of the northern Ontario economy and the challenge for 2019 should be to take further steps to devise a strategy to increase the labour force participation and employment rates of the Aboriginal population.  The first step is increasing human capital and training.  While this is probably easier for Aboriginal populations closer to major northern Ontario urban centers, we also need to do better in the case of more remote populations also.  Our region’s economic future depends on our getting this right. 

Saturday 3 November 2018

So What Is the New Plan for Northern Ontario's economy?


As the Ford government forges ahead, we should soon expect to see evidence of what its plans for boosting the economy of northern Ontario will be.   Given the change of government, the previous Northern Growth Plan is gone and will not be mourned given that evidence of its positive impact was hard to come by.  The Northern Growth Plan was essentially a form of palliative policy care given that despite the lack of progress on the economic front, there were nevertheless numerous press releases and announcements to the effect that many things were happening in the north -usually announcements of government funding - and we should feel good.  As a strategy, it has even been embraced by the federal government.

Ontario is now apparently open for business and while that can certainly be beneficial for northern Ontario, it is necessary for the government to demonstrate what that actually means for the North.  During his recent visit to northern Ontario, the Premier reiterated his “open for business mantra” and stated a commitment to sectors like steel, mineral exploration and forestry.  His visits in late October to the steel facilities in the Sault, the opening of Harte Gold’s new Sugar Zone mine near White River and Thunder Bay for Resolute Forest Products investment announcement provided excellent photo opportunities for economic success but these were projects that have been in the works for some time.

It is now time for the Premier to demonstrate his commitment to growing the northern Ontario economy.  As to what the new approach will be, one can start by an examination of the election platform that brought the provincial Ford conservatives to office.  The northern platform was a five-point plan that involved:

  • Developing Northern Resources, including the Ring of Fire.
  • Moving forward with resource revenue sharing from mining, forestry and aggregates to help Northern towns and Indigenous communities share in resource development
  • Ensuring hunting and fishing revenues go toward their stated purpose of conservation
  • Cutting the aviation fuel tax for the North to reduce the cost of living in the North and,
  • Bringing back passenger rail service to the North (which I take to mean the Ontario Northland and probably not full service across the north shore).
In terms of proposed implementation, the election platform of the victorious Conservatives said that a provincial conservative government under Doug Ford would:

1.     Build the roads to the Ring of Fire.

2.     Establish resource revenue sharing from mining, forestry and aggregates to help Northern and Indigenous communities share in the benefits of resource development by having the province take a portion of provincial revenues collected from aggregate licenses, stumpage fees and the mining tax and direct it to the local, host Northern and Indigenous communities. This was estimated at $20-$30 million in annual revenue.

3.     Ensure all hunting and fishing license fees are spent on wildlife conservation.

4.     Reverse the 148 percent increase to the aviation fuel tax for all Northern airports returning the aviation fuel tax to its original 2.7 cents per litre

5.     Bring back full passenger rail service to the North by first completing an environmental assessment of what equipment needs to be purchased and what upgrades need to be made to restore the service and then providing $45 million annually for operating costs.

Despite the flurry of activity with respect to announcements about promises made and kept, it remains that these five points and their associated implementation specifics have yet to be addressed.    How they will be implemented given the fiscal constraints the province faces will be an important issue.

In terms of fostering the northern Ontario economy, to these five points, I would add the freeing up of more Crown Land for cottage and camp development to provide the inputs to grow and develop a tourism service sector in the north that can be serviced out of its existing towns and cities. I would also urge extension of the highway twinning projects already currently underway to grow needed transport infrastructure in the north and hopefully improve upon the previous government’s anticipated completion date.

When these specifics will start to take firmer shape may be indicated in the November 15th Ontario Economic Outlook and Fiscal Statement.  Until then, we wait.  Hopefully, the Ford government will repudiate the adage that while provincial governments go and come, the problems of the northern Ontario economy abide. 


Friday 12 October 2018

Municipal Spending Ranges by Key Categories in Northern Ontario Cities


Given the ongoing municipal election campaigns in Ontario, I have been focusing a fair amount of my blogging activity on municipal public finance issues.  In a recent post, I looked at the Net Municipal Levy Per Capita (NMLPC ) for the five major northern Ontario cities for the years 2007 and 2017. In 2007, the NMLPC was highest in Thunder Bay at $1,216 and lowest in Sudbury at $1,041.  By 2017, spending was highest in Timmins at $1,651 (with Thunder Bay second at $1,641) and lowest in Sault Ste. Marie at $1,434.  If one compares the growth rates in the per capita levy, they were actually highest in Timmins at an average of 4.6 percent annually and lowest in Thunder Bay at 3.5 percent annually.  I also compared the growth of the NMLPC to household income growth and showed that per capita municipal spending has been rising faster than average household income raising the question of sustainability.

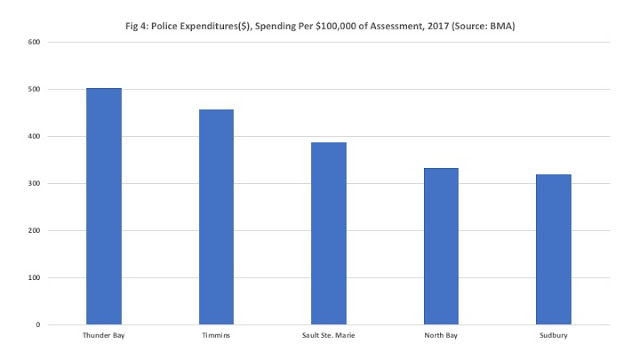
In this post, I want to drill down a bit in the total expenditure numbers and compare spending for these five major northern Ontario cities in a number of key municipal expenditure categories.  The data is from the 2017 BMA Consulting Municipal Report and was available for key expenditure categories in terms of the levy for the category per $100,000 of municipal tax assessment.  In order to standardize comparison, I have reproduced the net levy graph (Fig 1) but per $100,000 of assessment rather than per capita as in the last post.  To this I have added graphs comparing general government (Fig 2), fire (Fig 3), police (Fig 4), paved roadway spending (Fig 5) and winter control (Fig 6).  Keep in mind that this is data for only one year and there are differences in population size and geographic spread across these five cities as well as any unique local circumstances that may affect spending.


Nevertheless, the results are illuminating in that there is no one size fits all pattern of spending across these five communities when it comes to these key municipal expenditure categories.  The net levy per $100,000 of assessment ranges from a high of $2,136 in Timmins to a low of $1,482 in Sudbury.  Thunder Bay spends the most on general government (i.e. administration) at $257 per $100,000 of assessment and Timmins the least at $65.  North Bay spends the most on fire services at $283 per $100,000 of assessment and Sudbury the least at $160.  In terms of policing, Thunder Bay spends the most at $503 per $100,000 of assessment and Sudbury the least at $320. 


When it comes to paved roadway expenditure, Sudbury spends the most at $258 per $100,000 of assessment and Sault Ste Marie the least at $101.  Finally, all five of these cities experience harsh winters and the need to plow roads and when you look at winter control spending, Timmins spends the most at $237 per $100,00 of assessment and Thunder Bay the least at $48 per $100,000 of assessment.  This last category however is the most likely to be the subject of large fluctuations from year to year given local weather conditions.  My guess is the winter of 2017 was pretty bad in Timmins. 

Overall, there are large differences in spending across these categories across these five cities.  The spending in these categories on average across these five cities in 2017 accounted for about two-thirds of the net levy – a significant proportion.  It would be interesting to know what the incidence of fires is in North Bay and Thunder Bay given the size of the expenditure in these communities compared to the others.  Given high homicide rates in Thunder Bay, it is understandable perhaps why it spends the most of police of these five cities.  Yet, given that the average proportion spent on governance in these five cities is about 8 percent of the net levy, one wonders why Thunder Bay spends 14 percent and the Sault is at 11 percent compared to say 3 percent in Timmins or 9 percent in Sudbury. 

Ratepayers in each community should be asking themselves how their community compares to the others and what may be driving the differences.  Is the best value for money being provided?

Monday 1 October 2018

Municipal Election 2018: Spending in Northern Ontario Cities

We are about three weeks out from the municipal election and across northern Ontario, voters will be looking for information on which to base their decisions.  Inevitably, some of that decision making will be based on comparisons of how municipal ratepayers feel they fare relative to other similarly sized cities.  Taxes are often the basis of such comparisons, but municipal property taxes are a function of what municipalities spend so another basis for comparison is expenditure.

Among the many municipal statistics provided in the annual BMA Municipal Study is fairly detailed comparisons of spending on municipal services.  The aggregate number on which any comparison can begin is what is known as the net municipal levy per capita (NMLPC).  This is an estimate of what the spending need for a municipality is to provide its services – as determined by the city administration and elected council – and ultimately is what feeds into required tax revenues.

Now the BMA reports are quite explicit in qualifying what a NMLPC measure can and cannot do and what its limitations are.  Spending per capita can vary as a result of different service levels as well as type of service.  There are also demographic and socio-economic reasons why spending may vary across cities and per capita spending is simply an aggregate and not an indicator of value for money.  However, the BMA maintains that changes in per capita spending reflects changes in total spending relative to population and “Increasing per capita expenditures may indicate that the cost of providing services is outstripping the community’s ability to pay, especially if spending is increasing faster than the resident’s collective personal income.”

So, the accompanying figure 1 shows the NMLPC for the five major northern Ontario cities for the years 2007 and 2017. In 2007, the NMLPC was highest in Thunder Bay at $1,216 and lowest in Sudbury at $1,041.  By 2017, spending was highest in Timmins at $1,651 (with Thunder Bay second at $1,641) and lowest in Sault Ste. Marie at $1,434.  If one compares the growth rates in the per levy, they were actually highest in Timmins at an average of 4.6 percent annually and lowest in Thunder Bay at 3.5 percent annually.
 

However, in all of these cities, per capita spending grew faster than population suggesting that there was a deepening of per capita spending.  That could be the result of a desire to improve services or it can reflect a weakening economic base and the spreading of costs across fewer people.  Over the last ten years, population actually shrank in four out of five of these cities – the exception being Sudbury which saw its population rise 2.3 percent over the last ten years.  Yet even in Sudbury, spending rose faster than population given t per capita expenditure is growing.
 

More interesting, is figure 2 which plots the average annual growth rates of the net municipal levy per capita (from 2007 to 2017) and average household income (2010 to 2017). In all of these cities, per capita municipal spending has been rising faster than average household income.  So, it would appear that in all of these cities, municipal spending has generally risen faster than both population and income.  This suggests that recent years have seen municipal spending outstrip the resource base in these communities as measured by population and income.  Indeed, sustainability for sub-national governments has been outlined as a key concern in a recent federal PBO reportMunicipal ratepayers in all five of these cities should be asking how candidates for their ideas on how they plan to address the fiscal sustainability of their cities?

Thursday 7 June 2018

The North and Ontario's Population

Well, today is election day and as we pause and wait for the results later today, why not take another look at northern Ontario's population but this time with numbers from the 2017 BMA Municipal Study.  Two items for your consideration. First, a table showing population in the major northern Ontario municipalities as well as the growth rates of their population for the period 2006 to 2011 and 2011 to 2016.  The table ranks the cities from the highest to lowest growth rates for the period 2011 to 2016 and they show that at the top are Parry Sound and Greater Sudbury.  Their populations have continued to expand and while their proximity to the GTA and its opportunities may be a factor it remains that proximity has not helped North Bay.  Also of interest is Elliot Lake which has taken to marketing itself as a retirement community.  Despite an aging population, people are not retiring to Elliot Lake in droves.


With the north not really growing while Ontario's population rises, its share of Ontario's population is also declining.  However, in this case it turns out that the North has plenty of company when it comes to shrinking population shares.  The figure below - also taken from the 2017 BMA Municipal Study (using data from the Ontario Finance Ministry) plots the population share of each of Ontario's regions since 1991 and projected to 2041.  It turns out that each region is expected to decline as a share of Ontario's population by 2041 with the exception of the GTA.  The GTA is projected to rise from 42% in 1991 to hit 53% by 2041.  As for northern Ontario - it is going from 8 percent of the population in 1991 to 4 percent by 2041.  At present it is about 7 percent.


Two things.  First, Ontario is becoming increasingly lopsided in terms of population and employment with the GTA enjoying a perpetual boom and the rest of the province with perhaps the exception of the Ottawa area undergoing a slow stagnation.   This will be a major challenge for the next government when it comes to dealing with the provincial economy.  Second, as many of you are aware, there was an increase in riding numbers for today's elections - there are now 124 seats in the legislature up for grabs.  Of those, 13 are in northern Ontario which means that 10 percent of the election ridings are in the north but only about 7 percent of the population.  Whatever northerners may think about their relative alienation and neglect by the south, it remains that their votes yield clout out of proportion to their population numbers.  Northern Ontario needs to make use of this influence while it still retains it. It is unlikely that 2041 will see the north with 10 percent of the seats in the legislature but only 4 percent of the population.

Saturday 2 June 2018

What Should Northern Ontario Voters Do?


With a few days left before the June 7th provincial election, northern Ontario voters face important choices and consequences.  The governing Liberals appear headed for defeat if one is to believe the evolving poll trackers.  Indeed, Premier Wynne has acknowledged the election is lost.  This means that come June 8th there will be a new government with consequences for the region in terms of public policy.  Public policy is of importance to the region given government’s role in health, education and transportation, the dependence of the region on government employment for economic sustenance and the stalled regional economy, which has seen little net employment growth compared to the rest of the province.

The Liberals have been in power since 2003 and their tenure encompasses the forest sector crisis and the stalled Ring of Fire.  On the one hand, the forest sector crisis was a function of a rising Canadian dollar, aging private pulp mills and increased competition from abroad.  On the other hand, the increase in electricity rates did not help.  As for the Ring of Fire, in the end it is not going anywhere until chromite prices rise no matter how much is spent on infrastructure.  The Liberal government’s short-term response to northern development was increased government spending in the region via assorted projects and initiatives including highway work.   The long-term response was the 25-year northern Ontario growth plan – which it must be noted actually predates the Wynne government.  Interestingly enough, to date the growth plan has not been accompanied by significant results and more to the point, there has been no mention of it during the current campaign.  Make of that what you wish.  However, given Premier Wynne has acknowledged the election is lost, thought must also be given to ensuring the region has some representation in any new government that is formed.

The NDP has surged in the polls since the election was called and their policies in health, pharma care, education, rent control and hydro seem mainly to be extensions of what the Liberals have been campaigning on.  For a region dependent on government job creation, an NDP government would be business as usual but with a more ideological bent away from market-based solutions to the region’s issues.  If one wants to differentiate the two parties when it comes to northern policies, one would have to say a key difference is that the pleasant Andrea Horwath is presently more popular than Kathleen Wynne.  However, when the rest of the team accompanying Horwath is examined more closely one wonders about the depth of talent available to serve in portfolios like northern development, natural resources and health not to mention finance.  Most of her team seems drawn from public sector, labor union, non-profit and social activism sectors.  Even the usually ubiquitous lawyers that dot politics are relatively scarce. Aside from a short–term continuation of government spending, the long-term economic benefits of an NDP government for northern Ontario are uncertain despite the claim of change for the better.

Just as uncertain are what the benefits of a Doug Ford government would be for northern Ontario given the lack of a detailed and  clearly articulated northern platform.  Natural resource revenue sharing has been promised as well as a jump start to the Ring of Fire but as noted earlier, the price of chromite is not going anywhere soon.  If the desire is simply for policy change, that would certainly be provided by a Conservative government more so than by the NDP but that change given traditional conservative values, is likely to not support the current orientation of the region towards public sector dependency.  On the other hand, given that we have been subjected to activist government economic development policies for several decades, it may be time for a different approach.  Moreover, whatever one might think of Doug Ford, it remains that his team would include some proven talent when it comes to northern Ontario – Greg Rickford, Norm Miller and Vic Fedeli come to mind.  Further reflection should also be given to the prospect that based on the distribution of votes, poll trackers are suggesting a high probability of a Doug Ford administration.

So what is a northern Ontario voter to do?  Good question.  Think about the region and its economy and the direction you think it should go.   Think about what the benefits and cost of each party and their policies might be to you and your families and friends.  Then make your decision and go vote.  None of the above is really not an option.  One must make a choice from the options available. On June 8th, the sun will still rise.  The northern Ontario economy will still face challenges and they will need to be tackled no matter who forms the government. That is the only certainty.

Tuesday 29 May 2018

Northern Ontario Property Tax Update

The 2017 edition of the BMA Municipal Study is out and there is a wealth of material here for blog posts for the next little while.  It is a municipal election year so comparisons of property taxes and service levels are particularly of interest. For this post, an update of property taxes paid for a detached bungalow in the five major northern Ontario cities.  According to the BMA, the definition of a single detached family bungalow is: "A detached three-bedroom single story home with 1.5 bathrooms and a one car garage.  Total area of the house is approximately 1200 sq, ft. and the property is situated on a lot that is approximately 5,500 sq. ft."

Figure 1 plots the average residential property tax paid for a detached bungalow for the five cities for the period 2005 to 2017.  In 2005, these averaged $2,260 and by 2017 the average was $3,530 representing an increase of 56 percent.  While property taxes trend up everywhere  there are several features that caught my interest. First, there is a clustering with Thunder Bay, Timmins and North Bay as higher property tax jurisdictions while Greater Sudbury and Sault Ste. Marie are generally cities with lower property tax levels - at least for this class of property.  In 2017, average taxes for a detached bungalow were highest in Timmins at $4,294, followed by Thunder Bay at $3,695, then North Bay at $3,576 then Greater Sudbury at $3,123 and finally the Sault at $2,954.


Second, the last year has seen the property taxes paid on an average  detached bungalow in Timmins apparently spike while those in North Bay actually declined.  Between 2016 and 2017, the value for Timmins rose from $3,574 to $4,294 - an increase of 14.4 percent.  Meanwhile, in North Bay, there was a decline from $3,632 to $3,576 -  a decline of 1.5 percent.  Naturally, these changes need to be put into the context of the local municipal economic and fiscal environment. 

Keep in mind, this also does not mean every property owner in Timmins saw a 14.4 percent increase in Timmins but the steeper increases may be related to how a change in assessment values for mining companies by MPAC that turned out to be lower than expected was measured in the BMA Report.  The projected decline could have resulted in higher rates on residential properties but the full impact appears to have been mitigated for the time being.   It turns out the average homeowner only saw a $125 increase in 2017 in Timmins.  As for North Bay, there apparently are rate decreases underway as a result of market assessment value shifts.


In any event, the annual percent increases for 2015 to 2017 plus an average of the three years are plotted in Figure 2.  The average increases in property taxes for a detached bungalow were highest in Timmins at 7.2 percent and lowest in North Bay at 0.6 percent.  Thunder Bay was in the middle of the pack at 2.9 percent - just below Sudbury at 3 percent and ahead of the Sault at 2.6 percent. more to follow.

Sunday 13 May 2018

When Will the Trans-Canada Be Completely Four-Laned Across Northern Ontario?

Ontario's provincial election campaign is in full swing and Thunder Bay Liberal party candidates and cabinet ministers announced the Liberal party's northern platform on May 11th. A key highlight of the plan was to completely four-lane the Trans-Canada Highway throughout the province from the Manitoba border to the Quebec border.  As we all know, after years of lobbying going back to the 1980s and early 1990s, four-laning of northern Ontario highways finally commenced and has been underway for a number of years in two key areas - Thunder Bay to Nipigon as well as from Sudbury to Parry Sound.   So, my question is - if we want to completely four-lane the Trans-Canada Highway, how long will it  take to fully four-lane the Trans-Canada in northern Ontario?

So here is a quick back of the envelope estimate.  Let us assume only the "southern" route will be completely four-laned.  This is a 1,628 km stretch (based on Google maps) going from Kenora to Parry sound via Thunder Bay-Nipigon-Marathon-the Sault-Sudbury and Parry Sound.  The stretch from Thunder Bay to Nipigon is about 109 km long with the commitment to four-laning announced in 2009. As of spring 2018, 30.2 km has been completed and another 19.5 km are underway.  Based on the 30.2 km completed to date and a nine year completion date, we are looking at 3.3 km a year.  If we want to be charitable and include the 19.5 km underway, then  we are looking at about 50 km over 9 years or approximately 5.5 km per year as the highway completion rate.

The stretch from Sudbury to Parry Sound - part of the old Highway 69 - is 173 km long (again using Google maps).  The provincial government announced the four-laning of Highway 69 in 2001 and to date 70 km from Parry Sound south to Port Severn have been completed and about 70 km from Parry Sound north to Sudbury is either complete or underway with the aim to be done by 2021.  This still leaves quite  a bit of highway to be started and apparently the remainder is in the engineering and property acquisition phase. So, based on the total of 140 km completed (including Port Severn to Parry Sound) since 2001 with completion scheduled for 2021, this means 140 km over 20 years or 7 km per year.  The pace of northern Ontario highway four-laning is a little faster south of Sudbury.

So, take the total distance of 1,628 km and subtract what is underway or completed and you have  about 1,438 km left to go.  Let's make it a nice 1,400 km left as there already is some four-laned highway near the Sault and Kenora also.  If we average the Thunder Bay-Nipigon and Highway 69 four-laning speeds, we get 6.25 km per year as the pace of highway four-laning in northern Ontario.  At this pace, it will take 224 years to completely four-lane the remainder of the southern route from Kenora to Parry Sound bringing us to the year 2242.   This as many of you should know is about 20 years before the events of Star Trek the original series which is supposed to take place between the years 2265 and 2269.


Needless to say, its going to be a long road, getting from there to here. Saying you are going to need faith of the heart to get there is probably an understatement.


Thursday 5 April 2018

Yet Another Growth Plan for Northern Ontario


Most of us are familiar with the Northern Ontario Growth Plan which is a 25-year plan that was released on March 4, 2011 by the Ontario government that aimed to strengthen the economy of the North by:
  • Diversifying the region's traditional resource-based industries
  • Stimulating new investment and entrepreneurship
  • Nurturing new and emerging sectors with high growth potential. 

The Plan's policies were built upon six themes that each was to  contribute to the region’s long-term sustainability and prosperity: Economy, People, Communities, Aboriginal Peoples, Infrastructure and Environment.  I have discussed this plan in several posts on this blog.

Well, it turns out that the federal government also has a growth plan for northern Ontario though I must admit that it has flown under my radar.  I guess, when one works in an ivory tower, one sometimes loses sight of activity on the ground though how I never got wind of the extensive range of consultations escapes me. I am obviously moving in the wrong social circles.  As part of the follow up to the 2017 budget, FEDNOR began to put together a Prosperity and Growth Strategy for Northern Ontario (PGSNO) as a “roadmap to economic development and success” for the region.

FEDNOR undertook a series of engagement activities from June to November 2017 which included round tables, meetings and online tools aimed at reaching stakeholders across the region. According to FEDNOR, there was an online questionnaire with over 600 respondents, 33 round tables and 12 presentations with over 400 participants.  The result was a report with 12 common areas/themes of action (see the report for details):

1.    Infrastructure (broadband; transportation; and, energy)
2.    Diversification and self-sufficiency
3.     Northern image
4.     Rural and remote communities
5.    Timely and effective support
6.     Shortage of human resources
7.     Indigenous participation
8.     Building on regional strengths
9.     Business supports
10.   Indigenous enterprises
11.   Technology adoption
12.   Access to support for innovation

There was an item by MP Bob Nault in February 2018 discussing the report and its availability online but there seems to be little else until now.  Apparently, on Monday April 9th there will be an announcement by federal ministers Navdeep Bains and Patty Hajdu with respect to the PGSNO.  One imagines that there will be an announcement of federal development money to implement or address some aspect of the PGSNO.  Or perhaps there will be an announcement of further study and consultation.  Maybe both? Nevertheless, given that the federal report had twelve themes as opposed to six for the provincial growth plan, I would imagine that it will be twice the fun.