Well, with all the
excitement about the Federal Fall Economic Statement yesterday, the release by
Statistics Canada of the 2017
homicide numbers flew in somewhat under the media radar.According to Statistics Canada, the homicides
in Canada hit its highest rate in almost a decade in 2017 with much of the
increase attributed to more firearm-related and gang-related incidents. The
firearm-related homicide rate increased 18 percent from 2016 to 0.72 per
100,000 population—the highest rate since 1992. Police reported 660 homicide
victims in Canada in 2017, 48 more than in 2016. The homicide rate rose 7
percent in 2017 to 1.80 victims per 100,000 population—the highest level since
2009.It would appear that the upward
increase in homicide rates was driven by British Columbia and Quebec.
What is also of
interest is the homicide rate by CMA for 2017 as shown in Figure 1.In 2017, the homicide rate per 100,000 ranged
from a high of 5.8 in Thunder Bay to a low of 0 in Saguenay.Greater Sudbury came in close to the bottom
at 0.61.The good news for Thunder Bay
is that the homicide rate for 2017 is down from 2016 when it stood at 6.62 per
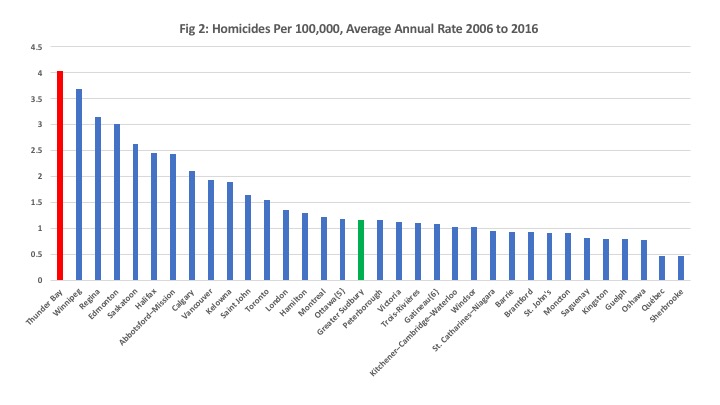
100,000.The bad news is if one takes
the average homicide rates for all CMAs for the period 2006 to 2016 (see Figure
2) Thunder Bay also ranks the highest at
an average of 4.04 per 100,000, just ahead of Winnipeg at an average of 3.69. As for Sudbury, its homicide rate is up from last year - when it stood at zero - but given the rankings there does not seem to be that much to worry about there.
Needless to say, despite
an improvement in 2017 Thunder Bay still has work to do.
Given the ongoing municipal
election campaigns in Ontario, I have been focusing a fair amount of my
blogging activity on municipal
public finance issues.In a
recent post, I looked at the Net Municipal Levy Per Capita (NMLPC ) for the
five major northern Ontario cities for the years 2007 and 2017. In 2007, the
NMLPC was highest in Thunder Bay at $1,216 and lowest in Sudbury at
$1,041.By 2017, spending was highest in
Timmins at $1,651 (with Thunder Bay second at $1,641) and lowest in Sault Ste.
Marie at $1,434.If one compares the
growth rates in the per capita levy, they were actually highest in Timmins at an
average of 4.6 percent annually and lowest in Thunder Bay at 3.5 percent
annually.I also compared the growth of
the NMLPC to household income growth and showed that per capita municipal
spending has been rising faster than average household income raising the question of sustainability.
In this post, I want
to drill down a bit in the total expenditure numbers and compare spending for
these five major northern Ontario cities in a number of key municipal expenditure
categories.The data is from the 2017 BMA
Consulting Municipal Report and was available for key expenditure categories in
terms of the levy for the category per $100,000 of municipal tax assessment.In order to standardize comparison, I have
reproduced the net levy graph (Fig 1) but per $100,000 of assessment rather
than per capita as in the last post.To
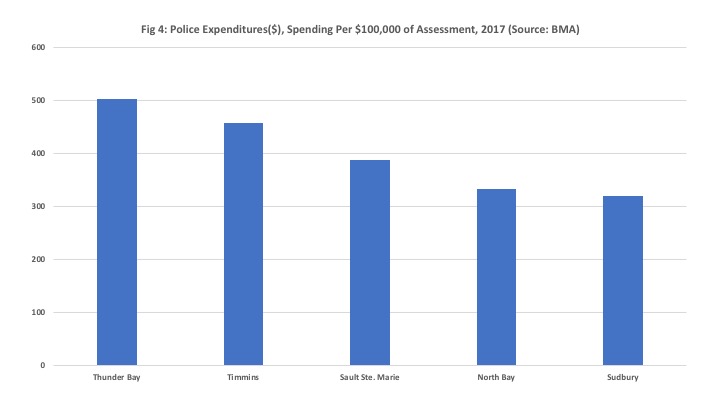
this I have added graphs comparing general government (Fig 2), fire (Fig 3),
police (Fig 4), paved roadway spending (Fig 5) and winter control (Fig 6).Keep in mind that this is data for only one
year and there are differences in population size and geographic spread across
these five cities as well as any unique local circumstances that may affect
spending.
Nevertheless, the
results are illuminating in that there is no one size fits all pattern of
spending across these five communities when it comes to these key municipal
expenditure categories.The net levy per $100,000 of assessment ranges from a high of $2,136 in Timmins to a low of $1,482 in Sudbury. Thunder Bay
spends the most on general government (i.e. administration) at $257 per
$100,000 of assessment and Timmins the least at $65.North Bay spends the most on fire services at
$283 per $100,000 of assessment and Sudbury the least at $160.In terms of policing, Thunder Bay spends the
most at $503 per $100,000 of assessment and Sudbury the least at $320.
When it comes to paved
roadway expenditure, Sudbury spends the most at $258 per $100,000 of assessment
and Sault Ste Marie the least at $101.Finally, all five of these cities experience harsh winters and the need
to plow roads and when you look at winter control spending, Timmins spends the
most at $237 per $100,00 of assessment and Thunder Bay the least at $48 per
$100,000 of assessment.This last
category however is the most likely to be the subject of large fluctuations
from year to year given local weather conditions.My guess is the winter of 2017 was pretty bad
in Timmins.
Overall, there are
large differences in spending across these categories across these five
cities.The spending in these categories
on average across these five cities in 2017 accounted for about two-thirds of
the net levy – a significant proportion.It would be
interesting to know what the incidence of fires is in North Bay and
Thunder Bay given the size of the expenditure in these communities
compared to the others. Given high homicide rates in Thunder Bay, it is understandable perhaps why it spends the most of police of these five cities. Yet, given that the average proportion spent
on governance in these five cities is about 8 percent of the net levy, one
wonders why Thunder Bay spends 14 percent and the Sault is at 11 percent
compared to say 3 percent in Timmins or 9 percent in Sudbury.
Ratepayers in each community should be asking themselves how their
community compares to the others and what may be driving the differences.Is the best value for money being provided?
The 2017 edition of the BMA Municipal Study is out and there is a wealth of material here for blog posts for the next little while. It is a municipal election year so comparisons of property taxes and service levels are particularly of interest. For this post, an update of property taxes paid for a detached bungalow in the five major northern Ontario cities. According to the BMA, the definition of a single detached family bungalow is: "A detached three-bedroom single story home with 1.5 bathrooms and a one car garage. Total area of the house is approximately 1200 sq, ft. and the property is situated on a lot that is approximately 5,500 sq. ft."
Figure 1 plots the average residential property tax paid for a detached bungalow for the five cities for the period 2005 to 2017. In 2005, these averaged $2,260 and by 2017 the average was $3,530 representing an increase of 56 percent. While property taxes trend up everywhere there are several features that caught my interest. First, there is a clustering with Thunder Bay, Timmins and North Bay as higher property tax jurisdictions while Greater Sudbury and Sault Ste. Marie are generally cities with lower property tax levels - at least for this class of property. In 2017, average taxes for a detached bungalow were highest in Timmins at $4,294, followed by Thunder Bay at $3,695, then North Bay at $3,576 then Greater Sudbury at $3,123 and finally the Sault at $2,954.
Second, the last year has seen the property taxes paid on an average detached bungalow in Timmins apparently spike while those in North Bay actually declined. Between 2016 and 2017, the value for Timmins rose from $3,574 to $4,294 - an increase of 14.4 percent. Meanwhile, in North Bay, there was a decline from $3,632 to $3,576 - a decline of 1.5 percent. Naturally, these changes need to be put into the context of the local municipal economic and fiscal environment.
Keep in mind, this also does not mean every property owner in Timmins saw a 14.4 percent increase in Timmins but the steeper increases may be related to how a change in assessment values for mining companies by MPAC that turned out to be lower than expected was measured in the BMA Report. The projected decline could have resulted in higher rates on residential properties but the full impact appears to have been mitigated for the time being. It turns out the average homeowner only saw a $125 increase in 2017 in Timmins. As for North Bay, there apparently are rate decreases underway as a result of market assessment value shifts.
In any event, the annual percent increases for 2015 to 2017 plus an average of the three years are plotted in Figure 2. The average increases in property taxes for a detached bungalow were highest in Timmins at 7.2 percent and lowest in North Bay at 0.6 percent. Thunder Bay was in the middle of the pack at 2.9 percent - just below Sudbury at 3 percent and ahead of the Sault at 2.6 percent.
more to follow.
The Thunder Bay Community Foundation held its 2017 Scholarship and Bursary Reception at the Thunder Bay Art Gallery this evening and it was an exciting and very well attended event.
I served on the Foundation Board from 2007 to 2010 and this evening was an opportunity to reconnect with the Foundation and its activities. The Foundation was established in 1971 with a gift from Prue Morton and has gone on to build a substantial endowment that funds a program of community grants including a set of scholarship and bursaries to students from Thunder Bay and tnorthwestern Ontario. This year, thanks to the generosity of many donors over the years, the Foundation was able to present $66,900 in scholarships and bursaries to students in Thunder Bay and the District of Thunder Bay.
Congratulations to all of this year's recipients and best wishes for an exciting future!
Well, the 2017 federal budget is out and I have put together some comments in two parts: general and northern Ontario specific.
General Comments
Today’s federal budget addresses Canada’s economic
uncertainty by stimulating spending without adequately addressing the
long-term productivity growth of Canada’s economy.Total spending is expected to rise from 315.1 billion dollars in 2016-17
to reach 371.8 billion dollars by 2021-22 – an increase of 18 percent.The 2017 federal budget is disquieting
given that revenues will still rise from 292.1 billion dollars to 356 billion
dollars – an increase of 22 percent - over the same period and yet still result
in the accumulation of more deficits.
The
federal debt is 637.1 billion dollars in 2016-17 and projected at 756.9 billion
dollars by 2021-22. Debt service costs will rise from 24.3 to 33.3
billion dollars over the same period. The deficit will be 23 billion dollars in
2016-17, 28.5 billion dollars in 2017-18, 27.4 billion dollars in 2018-19 and
decline moderately to 18.8 billion dollars in 2021-22.
While the introduction of a contingency reserve is welcome,
it still remains there is no long-term plan for addressing the fiscal deficit situation
of the federal government.This is
of concern given the importance of private sector confidence when it comes to
making investment and business decisions.This is also worrisome given that interest rates are projected to rise as well as the economic uncertainty we still face
given the trade and economic policies of the Trump administration in
Washington.
Despite the increased spending, there is to date relatively
little to show for promised federal infrastructure investment and the federal
government’s promises of a bold and transformative agenda have fallen flat when
it comes to actual implementation.While today’s budget focus on social policies such as more
skills training, better access to child care, innovation and infrastructure
spending for First Nations is commendable, there is really no assurance that
the government will be able to implement anything given its slow pace of
implementation on the preceding year’s infrastructure and spending commitments.
According to a recent report from the Institute of Fiscal
Studies and Democracy, the federal government already spends nearly $23 billion
on innovation, skills development and training across 147 activities and there
is little available in the way of performance measurement to evaluate what
works and what does not.
In the case of assistance to the middle class, it remains
that the recent reduction in middle class tax rates from 22 to 20.5 percent
generally benefited tax filers making between $50,000 and $100,000 per year
while nearly two-thirds of Canadian tax-filers report total income below
$50,000 and saw no benefit from the tax decrease. Moreover, the increase in
unemployment insurance premiums in 2018 to partly offset the government’s
skills-training proposals and the increase in excise taxes constitute a tax increase on the middle class.
However, the government is to be commended for not further increasing the tax
burden via increases in capital gains taxation.
While the federal government has grand aspirations and seems
willing to spend a lot of money it falls short on achievement and does not
appear able to fully address concerns that it is generating the best value for
money.A budget must be more than
an aspirational document that announces spending that is to be spread out over
time.It should set goals and then
achieve them.
Northern Ontario
Comments
This is a government that has decided to run large deficits
and add substantially to the public debt.In the case of northern Ontario, one has to ask where the regional
benefits of this increased spending are given the federal emphasis on
infrastructure investment, the innovation agenda and assistance to the middle
class?In many respects, the
budget is a disappointment with respect to some of the specific issues the
northern Ontario economy faces.Northern Ontario is still
characterized by slower economic and employment growth relative to the rest of
the country and given that its has substantial representation at the federal
level both in terms of MPs as well as cabinet, one wonders where the federal
growth agenda for northern Ontario is now that we are two years into the
federal mandate?
Northern Ontario receives little in the way of specific mention in Budget 2017. An extra 25 million dollars over five years for Fednor is not much in a world of multi-billion dollar spending projects.Here is what I would have liked to see
in the 2017 federal budget with respect to the economic future of northern
Ontario.
·1.It is Canada’s 150th
anniversary.Where is the federal
vision that would see us embark on finally completing the Trans-Canada highway
through northern Ontario up to a standard that is worthy of a nation as wealthy
and developed as Canada?When will
there finally be a commitment to complete a four-lane national highway through
the middle of Canada fully linking east and west?
·2.Northern Ontario municipalities have not had the
increase in economic base characteristic of larger urban centers and their revenue
is increasingly being borne by residential ratepayers.At the same time, the physical
infrastructure in northern Ontario municipalities is increasingly in need of
repair and renewal.Notwithstanding the announcements of investing in infrastructure, where
are the federal infrastructure projects and dollars infrastructure in terms of
roads, bridges and sewers here in northern Ontario?
·
3. Where is federal leadership when it comes to investing
in the Ring of Fire?Commodity
prices have bottomed out and are in the process of starting an upturn.What are the federal plans to providing
the infrastructure investment to assist in development of mining resources in
northern Ontario in advance of the coming upturn in commodity prices?
·4. The federal government maintains it is committed
to research and innovation and economic development.When can we see some direct and more substantial federal
investment in research directly related to northern Ontario economic
development issues, to the analysis of the regional economy of northern Ontario,
and the economics of natural resources, mining and transportation?Where are the Federal Research Chairs
and research support directly dedicated to these areas?
·5. The 2016 Federal Budget said it planned to
invest $8.4 billion over five years for indigenous people with $1.5 billion
earmarked for 2016-17 and the 2017 Budget earmarks an additional 3.4 billion
over the next five years. The
money was supposed to be spent on health, infrastructure, renovating and
building schools on-reserve as well as improving water supply and treatment
infrastructure.How much of this
in 2016-17 made its way to northern Ontario? How much in 2017-18?