Given the ongoing municipal
election campaigns in Ontario, I have been focusing a fair amount of my
blogging activity on municipal
public finance issues. In a
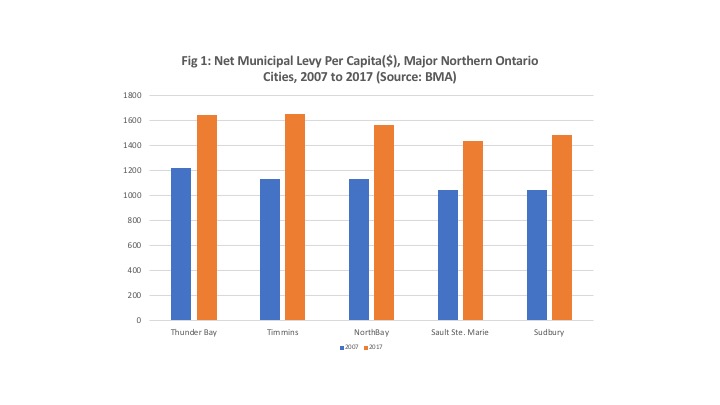
recent post, I looked at the Net Municipal Levy Per Capita (NMLPC ) for the
five major northern Ontario cities for the years 2007 and 2017. In 2007, the
NMLPC was highest in Thunder Bay at $1,216 and lowest in Sudbury at
$1,041. By 2017, spending was highest in
Timmins at $1,651 (with Thunder Bay second at $1,641) and lowest in Sault Ste.
Marie at $1,434. If one compares the
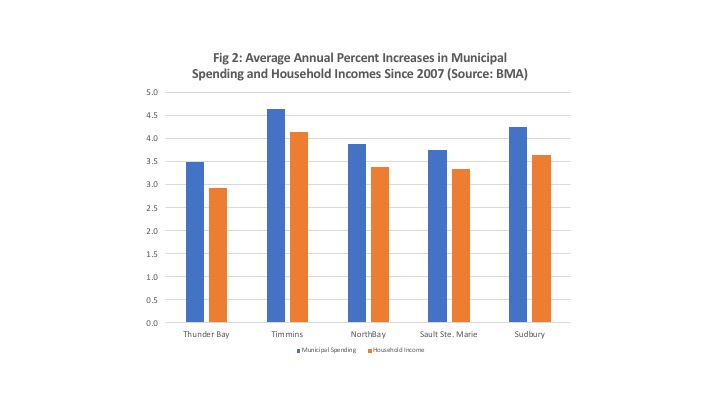
growth rates in the per capita levy, they were actually highest in Timmins at an
average of 4.6 percent annually and lowest in Thunder Bay at 3.5 percent
annually. I also compared the growth of
the NMLPC to household income growth and showed that per capita municipal
spending has been rising faster than average household income raising the question of sustainability.
In this post, I want
to drill down a bit in the total expenditure numbers and compare spending for
these five major northern Ontario cities in a number of key municipal expenditure
categories. The data is from the 2017 BMA
Consulting Municipal Report and was available for key expenditure categories in
terms of the levy for the category per $100,000 of municipal tax assessment. In order to standardize comparison, I have
reproduced the net levy graph (Fig 1) but per $100,000 of assessment rather
than per capita as in the last post. To
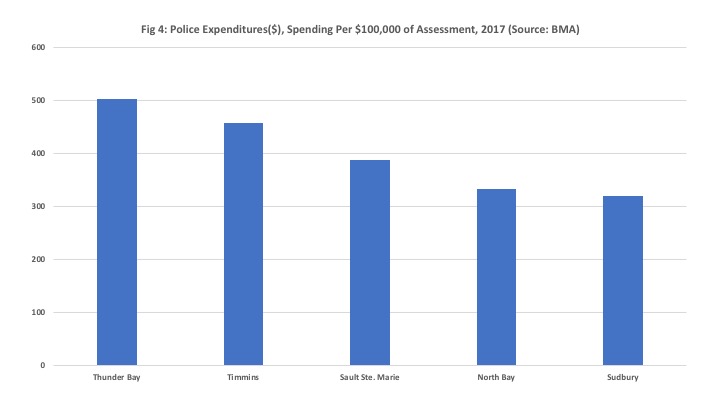
this I have added graphs comparing general government (Fig 2), fire (Fig 3),
police (Fig 4), paved roadway spending (Fig 5) and winter control (Fig 6). Keep in mind that this is data for only one
year and there are differences in population size and geographic spread across
these five cities as well as any unique local circumstances that may affect
spending.


Nevertheless, the
results are illuminating in that there is no one size fits all pattern of
spending across these five communities when it comes to these key municipal
expenditure categories. The net levy per $100,000 of assessment ranges from a high of $2,136 in Timmins to a low of $1,482 in Sudbury. Thunder Bay
spends the most on general government (i.e. administration) at $257 per
$100,000 of assessment and Timmins the least at $65. North Bay spends the most on fire services at
$283 per $100,000 of assessment and Sudbury the least at $160. In terms of policing, Thunder Bay spends the
most at $503 per $100,000 of assessment and Sudbury the least at $320.


When it comes to paved
roadway expenditure, Sudbury spends the most at $258 per $100,000 of assessment
and Sault Ste Marie the least at $101.
Finally, all five of these cities experience harsh winters and the need
to plow roads and when you look at winter control spending, Timmins spends the
most at $237 per $100,00 of assessment and Thunder Bay the least at $48 per
$100,000 of assessment. This last
category however is the most likely to be the subject of large fluctuations
from year to year given local weather conditions. My guess is the winter of 2017 was pretty bad
in Timmins.
Overall, there are
large differences in spending across these categories across these five
cities. The spending in these categories
on average across these five cities in 2017 accounted for about two-thirds of
the net levy – a significant proportion.
It would be
interesting to know what the incidence of fires is in North Bay and
Thunder Bay given the size of the expenditure in these communities
compared to the others. Given high homicide rates in Thunder Bay, it is understandable perhaps why it spends the most of police of these five cities. Yet, given that the average proportion spent
on governance in these five cities is about 8 percent of the net levy, one
wonders why Thunder Bay spends 14 percent and the Sault is at 11 percent
compared to say 3 percent in Timmins or 9 percent in Sudbury.
Ratepayers in each community should be asking themselves how their community compares to the others and what may be driving the differences. Is the best value for money being provided?
Ratepayers in each community should be asking themselves how their community compares to the others and what may be driving the differences. Is the best value for money being provided?