Northern Economist 2.0

Wednesday 5 April 2023

Urban Density and Taxation in Ontario


Thunder Bay has signaled that it wishes to increase urban density by enacting a new zoning bylaw in April of 2022 designed to encourage urban density through a process of infill.  One of the more controversial changes is that the urban low rise neighborhood designation now permits buildings that can contain one to four homes based on the size of the property.  Most buildings in such neighborhoods can now be permitted to contain two homes – mainly basement apartments or “mother-in-law” suites but backyard homes will also be allowed.  In some respects, this legitimates a process that has already been underway in many neighborhoods given the persistent housing shortage that seems to be present even in Thunder Bay - a city whose official population has not grown that much since 1971. And as part of the move to create new housing and urban density, there is now a move underway to consider reviewing surplus City of Thunder Bay land for the purposes of selling it for infill housing. Of course, there is the usual inconsistency in that while wanting to increase density in existing residential neighborhoods, Thunder Bay is expanding standard suburban developments at the same time which often reduce urban density.


Ultimately, the policy of allowing more units on a standard-lot or the renting of basement apartments is really an infill policy done on the cheap by piling more people onto existing infrastructure and services and not worrying too much about any disruption or other social costs.  In addition, more people living in current suburban residential areas removed from shops and services simply perpetuates a car intensive community.  True density housing should be built adjacent to or in the two main downtown cores with secondary core density areas being areas like perhaps  Westfort or the Bay-Algoma area.  True density housing is not a single detached home or duplex that accommodates renters on an existing lot in River Terrace or Vickers Park, it is two and three-bedroom apartments in 4 to 6 story buildings and sometimes even higher, situated adjacent to core areas with a lot of shops and services.  In this regard, even parts of intercity near shopping malls could be considered a location for an apartment building or condo though the swampy nature of the area probably militates against high rise construction.  If the city has surplus land and buildings in these core areas, that is what should be used to stimulate density.


And of course, just selling land and hoping  that if you sell it, they will build, is ultimately not enough. You probably need to streamline the permit and approval process as well as rebate those costs with the amount of the rebate tied to the speed with which the building is constructed and put on the market. In addition, you probably need to lower the property tax rate on such structures to make them more lucrative for developers to build density buildings.  This is a key point and a neglected one.  To start, take a look at figures 1 and 2.  Figure 1 plots population density as a proxy for urban density in Ontario’s thirty largest municipalities and Thunder Bay ranks fifth from the bottom.  Figure 2 takes those same municipalities and plots their multi-residential total property tax rate from highest to lowest.


 It turns out that Thunder Bay has the third highest multi-residential rate – just after Chatham-Kent and Windsor.  According to the 2022 BMA Municipal Report analysis, the average multi-residential rate in Ontario communities was 2.04% but in Thunder Bay it was 3.12%. Other examples include Brampton 1.56%, Hamilton, 2.73 percent, Burlington 1.45%, Sault Ste Marie 1.77%, Greater Sudbury 2.98%, and Guelph, 1.99%.  Elliot Lake is higher at 4.0%, Belleville at 3.24%, Port Colborne at 3.45%, and Timmins at 3.35%.  My point is larger cities - of which Thunder Bay is still considered one - tend to have lower rates but Thunder Bay taxes its multi-residential more like a much smaller town.  Why is Thunder Bay so spread out?  True density is penalized by its property tax structure.


Now it should be noted that a high multi-residential property tax rate in and of itself is not evidence that it is discouraging density development. In general, municipalities with weaker tax bases tend to have higher rates in general to provide the same range of services often mandated by the provincial government.  In this respect, Thunder Bay is in good company with other cities whose former lucrative industrial tax base has seen decline – Windsor, Sudbury, Hamilton, and St. Catharines.  Thunder Bay just has high rates in general and it also has the third highest residential tax rates of these thirty municipalities.


What is more relevant is not the multi-residential tax rate per se but the difference between the multi-residential rate and the single unit residential rate in a given municipality.  The greater the gap between the multi-residential rate and the residential rate applied to a given value of assessed property, the greater the incentive to build single residential housing units as opposed to multi-residential units.  While Thunder Bay has some of the highest residential and multi-residential total property tax rates in the province, it also has one of the highest differences between the two.  Relatively speaking, the larger the gap, one would expect a  greater tax disincentive to invest in large multi-unit residential properties, all other things given.  As a result, one would also expect to see a relationship between the size of the gap and the degree of urban population density with a larger gap correlated with lower population density.


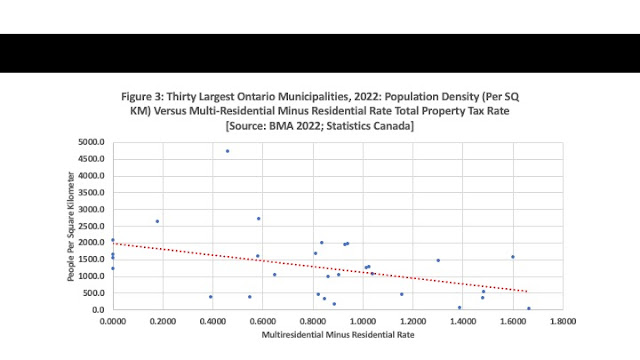
Figure 3 tries to do exactly that.  It plots a scatter-plot for Ontario’s thirty largest municipalities of municipal population density as a function of the difference between the two rates.  The larger the difference -that is the higher the gap between multi-residential and residential property rates – the lower the population density, all other things given.  Of course, all other things are not given and there may indeed be other variables influencing urban density not just in Thunder Bay but other cities as well.  After all, robust economic growth that pours more people into a fixed geographic space is also a way to increase population and urban density.  However, parsing everything out would require a fairly expensive study – this is after all, just a blog – but that would mean paying a lot of money to consultants for answers Thunder Bay City Council and Administration probably do not want to hear. Namely, Thunder Bay’s municipal tax system and development policies discourage density and encourage sprawl.  Rule of Thumb. If you want less of anything, tax it more heavily.

Sunday 20 October 2019

Which Federal Party Can Open the Door to Thunder Bay's Employment Growth?


With the federal election into its home stretch and the vote scheduled for tomorrow, voters in Thunder Bay have to decide who to vote for.  Needless to say, it has been a disappointing election given that the major parties – as well as the smaller ones – have presented grandiose expenditure visions that are for the most part fiscally unsustainable.  Moreover, much of the campaign has been not on policy but on opportunistic promises with major efforts expended on digging up dirt on opponents, mixing it with a little self-righteous water and then spattering it about in the hope that it sticks somewhere. 

When it comes  to making a ballot-box decision, the prevailing sentiment on the street seems to be that it is hard to choose from a set of equally unpalatable national parties.  So, the next best approach might be: let us look locally and make the decision, based not on what might be best for the country, but what might be best for Thunder Bay.  Here too, the answer is really quite muddy as ultimately what is best for Thunder Bay is making sure that at least one of the ridings is with whoever ends up as the governing party.  However, even that is a difficult game to play given that we are probably looking at a minority government situation.  And such strategic behaviour is made even more difficult by Thunder Bay's historical genetic aversion to any federal choice but Liberal - except when they seek to punish the Liberals by voting New Democrat.  Thunder Bay has not elected a federal conservative since the 1930s but then oddly wonders why conservative governments do not grant its wishes.

In terms of what is best for Thunder Bay, needless to say a government that promotes economic growth and diversification is always a safe bet but that can often only be judged years after the fact.  The current north side incumbent who is also a member of the present governing party certainly points to the last four years as a period of economic growth for Thunder Bay and northwestern Ontario in part due to the “millions of dollars coming into our area” which she no doubt ascribes to her government and her role as a Minister of the Crown.

Quantitatively assessing growth in Thunder Bay and the region is never easy but a glance at employment numbers is one way of providing an evidence-based attempt on how much growth there has been.  Between 2014 and 2018, total employment in Thunder Bay has indeed grown by 3.6 percent – from 61,500 to 63,700 jobs – which is actually not bad given that Ontario over the same period increased by 5.3 percent.  However, when employment is examined in a longer-term framework using the period from 2001 to 2018 – see Figure 1 – it is still within the traditional employment range of the last two decades.  We basically bounce up and down between 60,000 and 65,000 jobs and never seem to break out of that corridor in any sustained fashion.  Between 2001 and 2018, Thunder Bay’s employment grew 3.4 percent while Ontario grew 22 percent. 

 
What is also interesting as shown in Figure 2 is when employment growth by occupational category over the period 2014 to 2018 is examined. The most employment growth since 2014 has been in occupations related to arts and culture (26.7%), health (22.2%), natural and applied sciences (17.6%), manufacturing (13.3%) and law, social and government services (12%).  However, sales and services, business and finance, and construction have all seen declines.  As for the manufacturing resurgence, given the 550 jobs slated to disappear at Bombardier, manufacturing is poised to continue the decline that has been underway since 2001.


So, has Thunder Bay’s employment grown over the last four years?  Yes, but there are important qualifications given the dynamic nature and unique features of any local economy.   Here in Thunder Bay jobs are both created and destroyed but in almost perfect balance over time so as to keep total employment locked within a narrow corridor.  This corridor has remained the same for decades and Thunder Bay remains in an overall total employment stasis despite the efforts of two growth plans - one provincial and the most recent federal.   This is unlike Ontario as a whole where jobs are both created and destroyed but on net over the last 20 years many more jobs have been created than have been destroyed.  In choosing who to vote more tomorrow, voters need to think long and hard on which party they believe can actually open the door to getting us outside our historical corridor of employment stasis.

Saturday 3 November 2018

So What Is the New Plan for Northern Ontario's economy?


As the Ford government forges ahead, we should soon expect to see evidence of what its plans for boosting the economy of northern Ontario will be.   Given the change of government, the previous Northern Growth Plan is gone and will not be mourned given that evidence of its positive impact was hard to come by.  The Northern Growth Plan was essentially a form of palliative policy care given that despite the lack of progress on the economic front, there were nevertheless numerous press releases and announcements to the effect that many things were happening in the north -usually announcements of government funding - and we should feel good.  As a strategy, it has even been embraced by the federal government.

Ontario is now apparently open for business and while that can certainly be beneficial for northern Ontario, it is necessary for the government to demonstrate what that actually means for the North.  During his recent visit to northern Ontario, the Premier reiterated his “open for business mantra” and stated a commitment to sectors like steel, mineral exploration and forestry.  His visits in late October to the steel facilities in the Sault, the opening of Harte Gold’s new Sugar Zone mine near White River and Thunder Bay for Resolute Forest Products investment announcement provided excellent photo opportunities for economic success but these were projects that have been in the works for some time.

It is now time for the Premier to demonstrate his commitment to growing the northern Ontario economy.  As to what the new approach will be, one can start by an examination of the election platform that brought the provincial Ford conservatives to office.  The northern platform was a five-point plan that involved:

  • Developing Northern Resources, including the Ring of Fire.
  • Moving forward with resource revenue sharing from mining, forestry and aggregates to help Northern towns and Indigenous communities share in resource development
  • Ensuring hunting and fishing revenues go toward their stated purpose of conservation
  • Cutting the aviation fuel tax for the North to reduce the cost of living in the North and,
  • Bringing back passenger rail service to the North (which I take to mean the Ontario Northland and probably not full service across the north shore).
In terms of proposed implementation, the election platform of the victorious Conservatives said that a provincial conservative government under Doug Ford would:

1.     Build the roads to the Ring of Fire.

2.     Establish resource revenue sharing from mining, forestry and aggregates to help Northern and Indigenous communities share in the benefits of resource development by having the province take a portion of provincial revenues collected from aggregate licenses, stumpage fees and the mining tax and direct it to the local, host Northern and Indigenous communities. This was estimated at $20-$30 million in annual revenue.

3.     Ensure all hunting and fishing license fees are spent on wildlife conservation.

4.     Reverse the 148 percent increase to the aviation fuel tax for all Northern airports returning the aviation fuel tax to its original 2.7 cents per litre

5.     Bring back full passenger rail service to the North by first completing an environmental assessment of what equipment needs to be purchased and what upgrades need to be made to restore the service and then providing $45 million annually for operating costs.

Despite the flurry of activity with respect to announcements about promises made and kept, it remains that these five points and their associated implementation specifics have yet to be addressed.    How they will be implemented given the fiscal constraints the province faces will be an important issue.

In terms of fostering the northern Ontario economy, to these five points, I would add the freeing up of more Crown Land for cottage and camp development to provide the inputs to grow and develop a tourism service sector in the north that can be serviced out of its existing towns and cities. I would also urge extension of the highway twinning projects already currently underway to grow needed transport infrastructure in the north and hopefully improve upon the previous government’s anticipated completion date.

When these specifics will start to take firmer shape may be indicated in the November 15th Ontario Economic Outlook and Fiscal Statement.  Until then, we wait.  Hopefully, the Ford government will repudiate the adage that while provincial governments go and come, the problems of the northern Ontario economy abide. 


Monday 9 July 2018

Advanced Industries: A Northern Ontario Economic Challenge


A recently released report jointly released by the Brookings Institute and the Martin Prosperity Institute lays out Canada’s path to future prosperity via advanced industries and the challenges Canada faces in this economic sector.  The report is titled Canada’s Advanced Industries: A Path to Prosperity and is authored by Mark Muro, Joseph Parilla, Gregory M. Spencer, Deiter F. Kogler and David Rigby. These industries are not just in manufacturing but span a number of diverse industries with the commonality being the application of advanced technology and innovation.  Brookings defines advanced industries as: “industries as diverse as auto and aerospace production, oil and gas extraction, and information technology—are the high-value innovation and technology application industries that inordinately drive regional and national prosperity. Such industries matter because they generate disproportionate shares of any nation’s output, exports, and research and development.”

The report argues that Canada’s advanced industries are not realizing their full potential and that these industries need to be targeted to build a dynamic advanced economy for future growth.  About 11 percent of Canada’s employment – about 1.9 million jobs – is currently employed in these higher wage advanced industries and they generate 17 percent of GDP, 61 percent of exports and 78 percent of research and development.  Services account for about half of the Canadian advanced industry worker base followed by manufacturing at about 36 percent.  What is more interesting is the variation in scale, intensity and diversity of this sector across provinces and Canadian CMAs. 

Ontario, Quebec, Alberta and British Columbia together account for 91 percent of advanced industry employment which is just a bit more than their total employment share which is about 87 percent.  Not surprisingly, the CMAs with the most advanced industry jobs are Toronto, Montreal, Calgary and Vancouver.  However, productivity growth in this sector has been lagging relative to the United states. What is particularly disconcerting from the point of view of northern Ontario economic development however is the fact that every Canadian CMA added advanced industry employment between 1996 and 2015 – the exceptions being St. Catharine’s-Niagara, Greater Sudbury and Thunder Bay.  Thunder Bay also ranks low when it comes to the regional value added generated by advanced industries (See figure taken from page 22 of report) whereas Sudbury does better because of the intensity of its mining sector. Moreover, Greater Sudbury and Thunder Bay are also at the bottom of the CMA rankings when the number of advanced industry specializations is compared in terms of local concentrations of activity.


Boosting advanced manufacturing in Canada according to this report requires a strategy of “four C’s” – capital, competition, connectivity and complexity.  Capital is of course the most fundamental – that is, investment in machinery and equipment but also knowledge capital such as information and technology systems.  The weakness in business investment has been a long-known factor in Canada.  As for competitiveness, Canadian industries have traditionally had less exposure to intense competition and this may be limiting the capacity of its advanced industries to innovate.  Fixing this requires greater market competition and indeed deregulation and easing foreign ownership restrictions.  Connectivity involves Canadian firms participating more in global value and production chains and networks.  Finally, complexity requires firms to master the technological complexity and specialization of the modern economy and this is often measured by patent activity which in Canadian CMAs is generally below American ones.  Policies for building connectivity and complexity in the end also involve the unleashing of greater competitive forces within the Canadian economy in order to achieve the market size or scale within which advanced industrial output can grow.

Thus, a major obstacle for Canada when it comes to growing its advanced industrial sector is its highly regional nature which in the end results in barriers to internal trade, less competition and small market sizes that militate against the scale needed to grow output.  In the case of northern Ontario, even with the growth in local entrepreneurship which has been quite noticeable in its larger cities such as Thunder Bay and Sudbury, it remains that without growth in market size, new innovative ideas will be like so much seed fallen in rock if the companies cannot grow their output.  In the end, any regional economic policy must focus on increasing the scale of output by boosting market size either via exports or via immigration and local population growth.