Northern Economist 2.0

Thursday 25 April 2024

Municipal Spending in Ontario: A Long-Term Overview

 This originally appeared on the Fraser Institute Blog. 

Municipal dollars in Ontario—where did the money go?

   
Municipal dollars in Ontario—where did the money go?

Municipal budget season in Ontario recently ended and the evidence reveals some fairly substantial tax increases around the province. For example, Waterloo Region approved a property tax increase of 6.9 per cent while Toronto passed an increase of 9.5 per cent. Hamilton ultimately saw an increase of 5.8 per cent after fears of a double-digit tax increase were unveiled in the fall while Kingston saw one of the lower increases coming in at 3.5 per cent. For the most part, these increases exceed the current consumer price index (CPI) inflation rate of approximately 3 per cent and rather anemic GDP growth performances.

Given these tax increases have exceeded both inflation and income growth, it’s more than a matter of curiosity to understand what drives the increases. Municipal governments in Ontario provide numerous services to ratepayers, and their budgetary actions can have a major economic impact on households and individuals. An overview of municipal expenditures at the provincewide level using data from the provincial Municipal Financial Information Return illustrates not only how much total expenditures and household taxes have grown but the categories driving the expenditure over time.

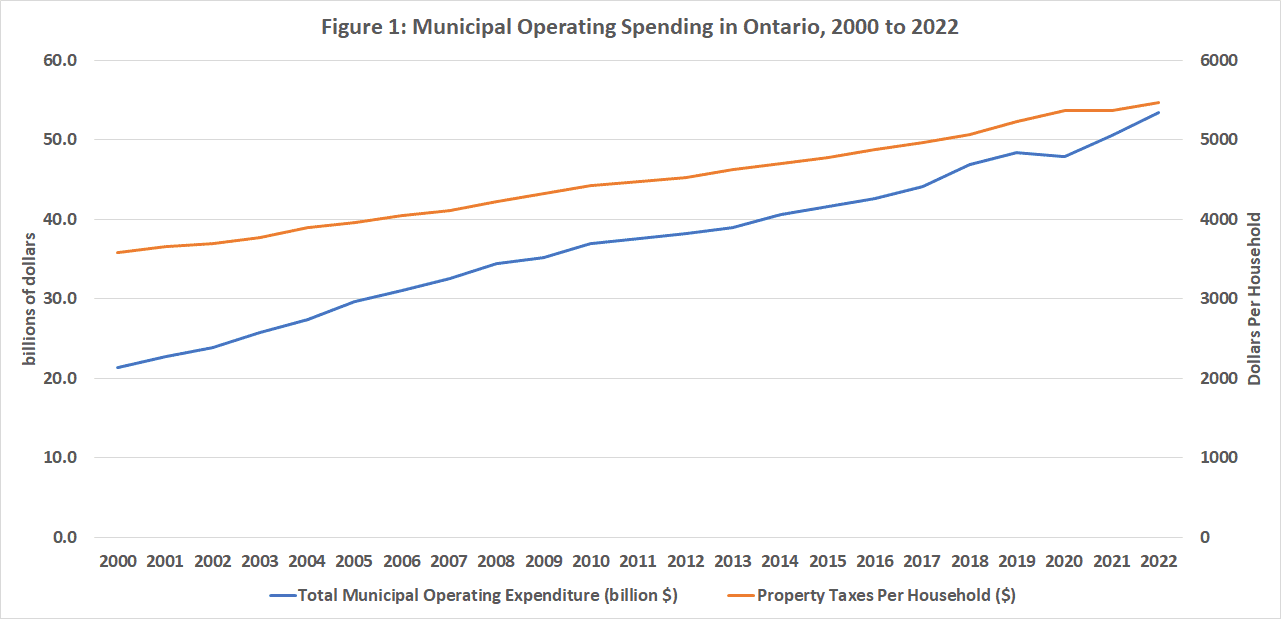
The first chart below plots total municipal expenditures along with average property taxes per household from 2000 to 2022. Since 2000, municipal operating expenditures have more than doubled going from $21.3 billion to $53.4 billion. It should be noted that total municipal operating spending has grown by 151 per cent while population has grown 61 per cent and the number of households by 134 per cent. Meanwhile, property taxes used to fund that spending have also grown from an average of $3,580 per household to $5,471 per household. Importantly, municipal operating expenditures do not include capital spending and much of that spending has been funded by debt. From 2000 to 2022, municipal net debt grew from $3.8 billion to $25.5 billion—nearly a six-fold increase in debt.

Figure 1

Over this period, the municipal workforce in Ontario grew from 216,367 to 234,235—an increase of 8.3 per cent over roughly 20 years. Much of the additional municipal spending is going into higher wages and salaries per employee rather than simply more employment. Indeed, any examination of the public-sector salary disclosure data for Ontario finds that the number reported earning more than $100,000 grew from 586 in 2000 to 61,021 in 2022 while the average salary for those over $100,000 rose from $118,333 to $127,294—an increase of eight per cent. While the average salary of those earning more than $100,000 has increased modestly, the growing number of municipal workers earning those high salaries has been the big expenditure driver. Put another way, in 2000 approximately one-third of one per cent of municipal employees on Ontario earned $100,000 or more whereas in 2022, that percentage had grown to 26 per cent.

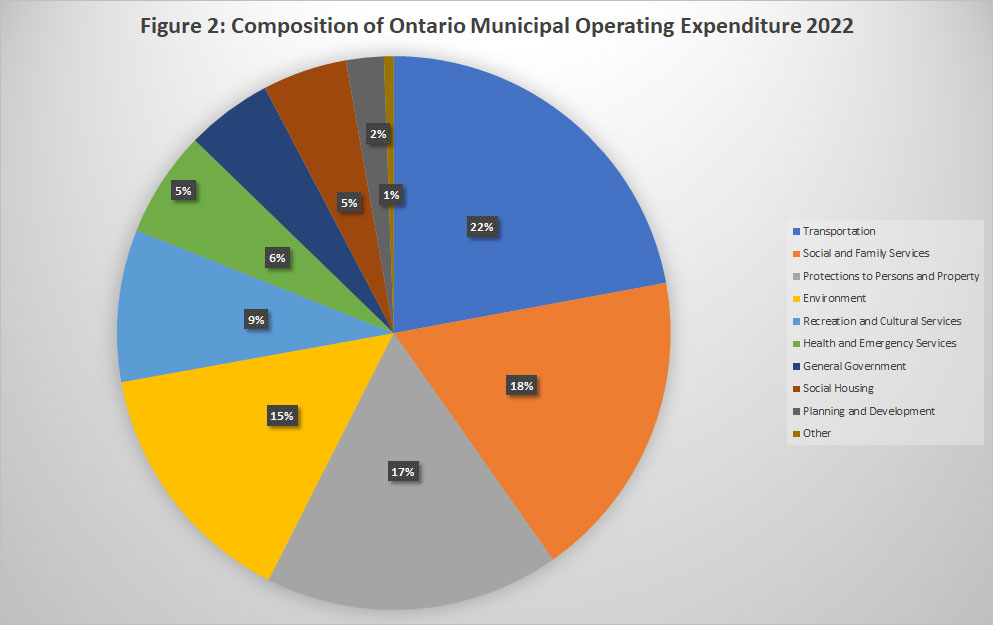
Where does the money go? The second chart shows the composition of municipal operating expenditures in 2022—the four largest expenditure items were transportation (22 per cent), social and family services (18 per cent), protection to persons and property (17 per cent) and environment (15 per cent). These four items together accounted for more than 70 per cent of municipal operating expenditures. What’s more interesting is the growth rates of all these categories since 2000 especially when compared to the growth rate of economic indicators.

Figure 2

Municipal operating expenditures since 2000 have grown the most in the categories of health and emergency services (335 per cent) followed by planning and development (215 per cent), then transportation and “Other” categories at 207 and 208 per cent respectively. Of the 11 expenditure categories, nine have grown faster than either nominal provincial GDP, real GDP, population or inflation (see third chart below). General government and social and family services have grown the least at 45 and 79 per cent respectively. While the relative restraint with respect to general government is welcome, the slower growth of social and family services given the social problems afflicting many Ontario cities seems a curious choice of priorities.

Figure 3

So, pulling everything together, here’s the story that emerges. Municipal operating expenditures in Ontario over the period 2000 to 2022 have grown 2.5 times faster than general inflation and double that of population. They have also grown a bit faster than the province’s output.

The increase in spending is driven by spending on wages and salaries but not in the manner one might think. Average salaries in the municipal sector for those making more than $100,000 annually since 2000 have grown by only 8 per cent but the number of individuals making those salaries has grown in the thousands of per cent. Within the broader public sector, in 2000 municipal employees accounted for 6 per cent of individuals on the salary disclosure list whereas by 2022 they accounted for 23 per cent.

In Ontario, municipal tax dollars have gone not so much into an expansion of services but into paying substantially more for roughly the same total number of people providing those services. And the areas of greatest spending increase have been in health and emergency services and planning and development. While the former can be explained by the pandemic and the opioid crisis, one must wonder where the value for money is with respect to planning and development given shortages of affordable housing and homelessness that have been allowed to develop across Ontario’s municipalities over the long term.

Monday 12 February 2024

Municipal Spending Evolution in Thunder Bay


As the 2024 municipal budget season wraps up, it is worth looking at where Thunder Bay has been going over the last decade in terms of the composition of its total municipal expenditures (all spending, tax and grant supported, capital and operating).  Using multi-year financial data (2002 to 2022) from the Ontario Ministry of Municipal Affairs Financial Information Review, one can obtain an overview of the trends.  In 2012, total municipal expenditures in Thunder Bay were 505.4 million dollars and in 2022 they were 599.8 million making for an increase of 19 percent.  Compared to some other municipalities, this was actually a rather modest increase as over the same period, Greater-Sudbury saw an increase of 41 percent, Windsor 26 percent, Barrie 29 percent and Kingston 41 percent.  At the same time, over this entire period, Thunder Bay nevertheless still managed to have the largest municipal expenditure to GDP ratio of these cities.  


What is more interesting is the evolution in functional composition.  Figure 1 illustrates that in 2012, the City of Thunder Bay spent 5 percent of its budget on general government, 14 percent on protection of persons and property, 12 percent on transportation, 12 percent on the environment, 5 percent on health and emergency services, 13 percent on social and family services, 9 percent on cultural and recreation services, 2 percent on planning and development and 28 percent on "other".  This last category reflects Thunder Bay’s ownership of its municipal telecom utility (TBayTel) as well as differences in the way Thunder Bay approaches social housing given we have a district board – the District of Thunder Bay Social Services Administration Board.


Figure 2 presents the 2022 composition.  General government showed a decline to 4 percent, protection to persons and property rose to 21 percent, transportation remained at 12 percent as did the environment.  Meanwhile, health and emergency services grew to 7 percent, social and family services declined to 7 percent, and both recreation and culture and planning and development remained the same at 9 percent and 2 percent respectively.  Meanwhile, the "other" category's share declined to 26 percent.  


Of course, for the composition to change, it means that these categories have grown at different rates and so Figure 3 presents the percent change in total spending by category over the 2012 to 2022 period.  In accord with general local perceptions, the largest increases in spending have indeed been in protection services and health and emergency services at 76 and 73 percent respectively.  Next is recreation and culture at 25 percent, followed by the environment at 14 percent, planning and development at 13 percent, "other" at 12 percent and transportation at 11 percent.  There were two categories that saw declines in total spending: general government fell by 6 percent (there have indeed been some administrative economies) while social and family services fell by 32 percent.  


Given that social issues have been front and center in Thunder Bay over the last few years, this allocation does provide some insight into how Thunder Bay is dealing with some of its social issues.  Resource allocation appears to have targeted the more direct outcomes and fallout of the assorted social ills afflicting the streets of Thunder Bay.  This is to be expected.  What is somewhat more disturbing is that there has been an expenditure drop in family and social services which one might expect would be a longer-term spending approach to addressing some of the causes of social issues.  Whereas, in 2012, 64.4 million was being spent on family and social services, this has declined to 44 million by 2022.  


It is interesting to note that of the five cities mentioned at the start of this post, between 2012 and 2022, Thunder Bay saw the largest percent increases in dollars spent on protection to persons and property as well as health and emergency services.  With respect to spending on family and social services, only Barrie saw a decline while Greater-Sudbury, Windsor and Kingston all saw increases.  Windsor, Barrie, Greater-Sudbury, and Kingston also all  increases in social housing spending (though Greater-Sudbury's was quite small). However,  in the case of Thunder Bay it is difficult to tell from these numbers if we are indeed spending more in social housing in the "other" category.  Ultimately, such differences across urban centers will provide an interesting laboratory experiment on how municipalities are dealing with issues like poverty, addiction and crime.

Sunday 4 February 2024

Measuring Municipal Public Sector Size


Public sector size and its impact on the economy is a long-standing research question in public finance.  In the case of Canada with its federal system of government, measures of public sector size often focus on either total public sector size or break it down into measures of federal and/or provincial public sector size.  These measures commonly take government spending or government revenues as a share of GDP to estimate the size of the public sector footprint.  Less common are attempts to related municipal public sector size to the size of their local economies.


Data is always an issue when trying to get an empirical handle on measuring things like public sector size.  Fortunately, in the case of Ontario municipalities, it is possible to get annual data on total municipal government expenditures and revenues from the Ontario Ministry of Municipal Affairs Annual Financial Information Returns which are filed by municipal governments.  Also fortunate is that Statistics Canada now provides some estimates of GDP for major census metropolitan areas going back to 2009.  While the data is a bit onerous to compile and put together, the preliminary results for Thunder Bay and three other Ontario municipalities are interesting.


Figure 1 plots total municipal expenditure as a share of CMA GDP from 2009 to 2022 for Thunder Bay, Greater Sudbury, Windsor, and Barrie.  These are relatively smaller Ontario urban centres well outside the GTA/Niagara region with two in northern Ontario.  Greater Sudbury is always an automatic comparison for Thunder Bay on many levels given that it is the largest city in northern Ontario with Thunder Bay second.  Also, note that for 2021 and 2022, GDP was estimated using the annual average growth rate of GDP for the 2010 to 2020 period.


The results reveal that total municipal expenditures in these four cities as a share of GDP reveal that Thunder Bay has a larger municipal footprint than the other three.  Over the entire period 2009 to 2022, Thunder Bay’s municipal expenditure to GDP ratio averages 9 percent while Sudbury is at 6 percent, and Windsor and Barrie each at 5 percent and 4.7 percent respectively.  In terms of trends over time, since 2011, Barrie has been trending slowly downwards, Windsor is stable, Sudbury has been growing while Thunder Bay managed a small decline that was reversed during the pandemic.  Indeed, the two end points of this chart are both associated with economic trauma in that the start is marked by the aftermath of the Great Recession and Financial Crisis and the end by the COVID-19 pandemic.


Nevertheless, the results suggest that based on this albeit limited sample, the two northern Ontario municipalities have larger municipal public sectors than ones in southern Ontario. Even within the north, Thunder Bay is certainly in a league of its own when it comes to the size of its municipal footprint.  Some of these differences across the cities can of course be ascribed to the generally more robust southern Ontario economic environment and better economic growth performance which naturally spills over into GDP.  At the same time, Thunder Bay is different, and the question as always is why?


One might argue that the municipal public sector in Thunder Bay is larger than these other cities because it has a weaker economy.  Given that so much municipal spending is mandated or guided by the province, Thunder Bay does not spend more per se but does relative to the size of its economy.  This is the “province makes us do it defence”.  On the other hand, one could argue that more spending is also a choice and Thunder Bay and the Lakehead cities that preceded it have always because of their isolation engaged in more municipal spending to provide services they feel ought to be available.  In this regards, part of the difference between Thunder Bay and other cities lies in municipal utilities given that the City of Thunder Bay essentially owns TBayTel- its own municipal telecom utility.


In some sense, neither explanation is terribly flattering in explaining why Thunder Bay’s municipal public sector can be nearly twice as large as that in some other southern Ontario cities.  We have a weak economy which despite all efforts continues to be weak and our municipal government plays the role of an economic stabilizer.  Or, ownership of TBayTel aside, we may simply like to spend more than other cities and are quite comfortable with the City of Thunder Bay being as large an economic driver as it is.  One suspects both these explanations are potentially inconvenient truths no one in Thunder Bay really wants to hear.

Saturday 27 January 2024

Ranking Thunder Bay's Tax Levy and More...


It is municipal budget season in  Ontario and Canada and this year’s proposed budget increases appear to be quite large.  Toronto, for example, has proposed a 10.5 percent tax increase while Hamilton initially was looking at a 14 percent increase. Vancouver is going up 7.5 percent while Montreal seems set to go up 5 percent which while seemingly modest given the comparisons described here is nevertheless Montreal’s largest increase in 13 years. And then there is Thunder Bay which for 2024 is proposing a 6.1 percent increase in the total tax levy which “after growth” will be 5.5 percent. 


While one might argue that Thunder Bay's increase seems modest compared to these other metropolises, much like the case of Montreal, the more apt comparisons are with the past rather than other cities.  Even in the case of Ontario municipalities, there are differences in municipal structure with Thunder Bay as a single tier municipality not always directly comparable to other cities – the famous apples versus oranges argument city administrators usually bring up at budget time.  Ultimately, one needs to look at how Thunder Bay’s tax levy and proposed levy increase stacks up against past ones.


Figure 1 plots a two-axis chart of the total tax levy as well as the dollar change in the levy from year to year going from 1990 to the proposed 2024 figures.  In 1990, the tax levy was 63.4 million dollars while today the proposed amount for 2024 is 231.7 million dollars.  And of course, this is just the tax levy and not the total budget which is funded by both tax levies and government grants and comes in including operating and capital at a combined total of approximately 538 million dollars.  The trend has been upwards with an increase every year with the exception of 1995 which appears to have seen a drop in the levy of 1.3 million dollars.  The proposed increase for 2024 is 13.3 million which is well above the average annual increase for the 1991 to 2024 period of 4.95 million dollars.


How does this year’s percentage increase in the tax levy stack up to past ones? Figure 2 plots each percent increase in the total tax levy from 1991 to 2024 ranking them from highest to lowest and at 6.1 percent, the proposed 2024 levy increase is the 5th highest in over thirty years (but second highest in strict absolute dollar terms). The increases range from a high of 21.8 percent in 1998 to a low of -1.7 percent in 1995.  All other things given this year’s proposed increase is at the higher end of the range in percentage terms.


Of course, it is often argued that the reason taxes go up apart from new needs or mandated responsibility increases from the province is a general rise in costs driven by inflation. Inflation certainly has been in the headlines the last year, so it is worth checking out the correlation between the CPI inflation rate for Thunder Bay and the percent change in the tax levy.  Oddly enough, when a linear trend is fitted to the scatter plot of tax levy increases versus the inflation rate, the relationship appears to be slightly negative – that is, higher inflation rates were correlated with lower tax increases. 


However, one could argue that these results are driven by 1998 with its 21 percent levy increase (If you recall the late 1990s was an era of municipal restructuring with changes in how taxes were allocated between residential and business and also local education and of course social service downloading).  However, if you omit that year as an outlier, what you get is essentially a flat curve.  That is, the rate of inflation does not seem to drive the rate increases.  They are being driven by other factors and since we don’t know what we don’t know, those factors are best left up to city administrators who are in the know about what they may or may not know.  Nevertheless, do not expect a straightforward answer as the factors over and above inflation are indeed complicated.


Many people find the budgeting process of the City of Thunder Bay (and indeed municipal governments in general) rather arcane and overly complicated.  Indeed, even those of us with a public finance background find municipal budgets particularly confusing and exasperating as they are indeed laid out in a manner that does not inspire clarity.  They look nothing like a federal or provincial budget which a least provide a one- or two-page table easily summarizing revenues and expenditures.  Now one may argue that this is not good for local democracy if ratepayers do not understand municipal finances because they are not readily transparent. 


This is where the ratepayer errs.  This is actually not about democracy.  It is about the needs of the corporation and corporations are perpetually lived entities with limited liability and interested in their own financial preservation.  They respond more often to the money rather than to voter pressure.  The phrase “You Can’t Fight City Hall” does not exist for no reason.  Remember, like other municipalities, our city government is The Corporation of the City of Thunder Bay.  Despite popular sentiment and belief, municipalities in Canada are not independent tiers of government but creatures of the provinces.  Local service provision has essentially been contracted out by provincial governments to municipal corporations.  The democratic accountability for municipal government ultimately lies in provincial elections rather than local ones. 


City councils are essentially boards of directors, and they serve to demonstrate responsibility for corporate direction but little else in terms of day-to-day finance and operations.  True, ratepayers engage with the corporation by selecting the board of directors in elections and participating in numerous surveys and public consultations but then any corporation worth its salt always is doing customer satisfaction surveys.  The real business and complex operations geared around the financial operations of the corporation is conducted by its officers and employees and generally behind closed doors. 


The members of the board - our councilors – are essentially a large focus group attempting to promote public relations engagement in a theatrical setting for the people the corporation ultimately derives its revenue from and provides services to. That usually explains why so much of council meeting’s time is usually taken up by discussion of minor manners that galvanize emotions (time to change street names again anyone?) and complicated large multi-million-dollar decisions seem to occur quickly on the advice of administration. There are exceptions when fate delivers exceptionally persistent and informed councilors - witness the turf facility debate to date - but corporate administrations play the long game and eventually wear out the opposition.


Even the current review of the size and structure of Thunder Bay City Council is largely designed to create a sense of public engagement with the process rather than any actual decision making.  Remember, Thunder Bay was created by an act of the provincial government.  Thunder Bay can certainly try and change its system of municipal representation and structure, but the province will have the ultimate say and the corporation will implement that.  Remember Toronto in 2018?  The number of wards  (and councilors) was reduced nearly 50 percent in the middle of a municipal election but not as a result of a grass roots consultation but by the provincial government because they wanted to and they could.


The point of all this?  The City of Thunder Bay needs a 6.1 percent in the total tax levy to fund its operations and tinkering around the edges aside, will get most of that increase.  And will we get a revamped municipal ward and councilor structure? Certainly. But only if the province goes along with it.

Sunday 1 October 2023

Thunder Bay, Burlington, Windrows and Civic Darwinism


Winter is approaching and it continues that compared to Thunder Bay, some southern Ontario municipalities are way ahead of the game when it comes to dealing with the lethal combination of climate change and aging populations.  In recent years, Thunder Bay has been getting heavier and wetter snowfalls which in the aftermath are quickly compacted into thick ice on residential streets.  Once the city snowploughs come through the neighborhood, usually several days after the snowfall, the result is a windrow at the end of one’s driveways.  Notwithstanding the snow already in one’s driveway, increasingly, we are not looking at six inches to a foot of snow left behind but massive walls of ice and snow which even a heavy duty snowblower is challenged to deal with.  The result for young and old alike is a period of massive exertion to exit one’s driveway which increasingly has been found to culminate in cardiac events not conducive to one’s longevity.


Now this blog has brought the issue of windrows up before but obviously to little avail in Thunder Bay.  A 2021 blog post noted that even Ignace Ontario was apparently getting its municipal snow grader outfitted with a “snowgate” while at the time it was noted that other cities in southern Ontario such as Richmond hill, Markham and even Toronto had windrow removal programs in place.  To this list can now be added the City of Burlington Ontario which according to a story in the Hamilton Spectator appears to have moved beyond a targeted windrow removal program (for seniors or people on disabilities) to a more general program that naturally comes at a charge.  As the story reads:


Burlington city council has approved enhancements to its program to clear snow left behind by plows, including increasing the number of available spots from 200 to 1,000 driveways.

In addition, service boundaries will expand to include all areas of the city.

As part of the city’s windrow program, crews will clear windrows within 36 hours of snowfall stopping and within 12 hours of residential road plowing. A windrow is the pile of snow that is left at the bottom of driveways by roadway plows.

Residential road plowing only occurs after accumulation of 7.5 centimetres or more of snow. Windrow-clearing services will run from Dec. 1, 2023, until March 31, 2024. A non-refundable fee of $125 plus HST per driveway entrance for the entire season must be paid at the time of registration.

In years past, the program was only offered to people with disabilities and individuals unable to clear their windrows. As part of the program’s expansion, the city now has the capacity to offer spots to any resident.

The city will continue to focus on providing spots to people with disabilities. Previous registrants will be contacted over the next week to secure a spot in the program. Following that, advanced registration for people with disabilities will open on Oct. 5 at 9 a.m. Registration for residents city-wide will open on Oct. 19 at 9 a.m.


Now, one is not asking for the city of Thunder Bay to provide free windrow removal.  After all, Thunder Bay has pretty clearly stated what its priorities are when it comes to tax funded or assisted municipal services.  While Thunder Bay does spend one of the highest per capita amounts of major Ontario cities, it has chosen to prioritize three things: general government, police, and fire services.  Indeed, of 27 major Ontario municipalities, Thunder Bay historically spends the most dollars per capita of its of its tax levy supported operating budget on these three items.   Indeed, historically nearly 60 percent of Thunder Bay’s operating tax levy is spent on these three items - again, the highest of these 27 major municipalities.  However, the City of Thunder Bay does not even appear interested in pursuing an approach like that of Burlington where one could essentially pay for the windrows to be removed so after the residential street is ploughed.  It is probably too entrepreneurial an approach for a gvoernmental body in Thunder bay to attempt.  On the other hand, given Thunder Bay’s municipal cost structure, one suspects that even if such a service were offered, it would be substantially more expensive than what Burlington is planning to offer.


So, there you have it.  Winter is coming and with it Thunder Bay’s survival of the fittest approach to retirement living.  


Monday 11 September 2023

Thunder Bay's Municipal Budget Woes


Well, Thunder Bay’s municipal budget opera season is now in full swing with assorted fiscal choruses and arias being played in lockstep as we move towards finalizing the 2024 budget.  Like many municipalities across Ontario, there is increasing budgetary pressure to raise taxes.  The narrative this budgetary opera season in Thunder Bay is a little more complicated because along with planning for 2024, there is also the matter of dealing with the remnants of the 2023 season.  This task has proven to be a bit more mettlesome than usual but the end result will probably be a fairly large tax increase in 2024.


Very often, the proposed budget generally includes a tax levy increase that is higher than what is eventually opted for as opposition mounts.  For example, the 2023 budget originally put forth 6.2 percent levy increase that went to 5.6 percent and then 5 percent but eventually passed at a 4.4 percent levy increase (after growth).  This before and after growth distinction is one that has always been a bit of a diversion because after all, a tax increase is a tax increase whether one factors in growth in the tax base or not.   One is indeed surprised that the recent increase in managerial salaries of 12 percent at the City of Thunder Bay was reported as a nominal increase rather than after growth or after inflation.


The last budget was a particularly vexing one mainly because the 2023 budget process was with a new council and they no doubt very much did not want to debut with one of the larger tax increases in recent history.  However, everything comes at a price and the price was taking one million dollars out of the reserve fund and the task of finding several million dollars more in terms of savings.


That process has not gone well, and one suspects behind the scenes municipal movers and shakers do not mind because they would be happier with a tax increase than cuts.  The initial round of cuts tended to deal with relatively high profile but small budget items such as cuts to fireworks, movie nights, and Christmas Day transit service as well as items like the sister cities program. As well, there were the controversial cuts to the Neebing Arena as well as outdoor rinks that in a hockey town like Thunder Bay generated more of a backlash.  Yet, the backlash was dealt with by delaying the cuts and taking a “survey” which is really not a survey at all. 


The survey site consists of a web page and link asking the question of whether you supported the proposed outdoor rink reduction and was really not a statistical survey but a consultation.  The over 80 percent opposition comes from the fact that there is a certain self-selection bias here in that the survey is voluntary and those opposed to the cut of 31 out of 39 outdoor rinks had a strong incentive to go on and register their opposition which explains the 80 percent opposition rate.  Needless to say, the odds are that after rousing public sympathy for the rinks, the next budget offering will be an orchestrated refrain about how we will have to raise taxes more if you want to keep the rinks open.


The reality is that the big money in the City of Thunder Bay budget is not to be found in hockey rinks or fireworks or movie nights but in two key areas: Public Safety and Public Works.  The accompanying figure has been constructed using the City of Thunder Bay’s own data and reveals that the Public Safety Category occupies nearly 40 percent of municipal spending while the Public Works Category is nearly 20 percent.  In other words, with nearly 60 percent of spending in these two categories, looking for cuts in the other 40 percent of spending is going to be difficult as a budget solution.  Even the claim that much of our spending is mandated by the “province” looks a little lame as the legislated programs category accounts for barely one percent of spending though some additional mandated spending is also internalized within some of the other categories.


In the end, the two largest potential sources of savings lie in Public Safety and Public Works, followed by Parks and Recreation, Contributions to Outside Boards and Agencies, Social Services and then Debt Charges. We are in a situation where without any serious attempt to sit down and examine them, the two largest categories are going to increasingly take a larger share of spending.  This will take money from quality-of-life categories such as Parks and Recreation (though oddly enough there is still interest in a new Turf facility on the part of the city administration but I guess that is the capital budget rather than the operating budget at least for now) and then contributions to associated community groups.  Cuts in these other categories will not be sufficient.


We are heading for a scenario where there will be higher taxes and fewer services.  It will be interesting to watch City Council and Administration sell that one.

Wednesday 5 April 2023

Urban Density and Taxation in Ontario


Thunder Bay has signaled that it wishes to increase urban density by enacting a new zoning bylaw in April of 2022 designed to encourage urban density through a process of infill.  One of the more controversial changes is that the urban low rise neighborhood designation now permits buildings that can contain one to four homes based on the size of the property.  Most buildings in such neighborhoods can now be permitted to contain two homes – mainly basement apartments or “mother-in-law” suites but backyard homes will also be allowed.  In some respects, this legitimates a process that has already been underway in many neighborhoods given the persistent housing shortage that seems to be present even in Thunder Bay - a city whose official population has not grown that much since 1971. And as part of the move to create new housing and urban density, there is now a move underway to consider reviewing surplus City of Thunder Bay land for the purposes of selling it for infill housing. Of course, there is the usual inconsistency in that while wanting to increase density in existing residential neighborhoods, Thunder Bay is expanding standard suburban developments at the same time which often reduce urban density.


Ultimately, the policy of allowing more units on a standard-lot or the renting of basement apartments is really an infill policy done on the cheap by piling more people onto existing infrastructure and services and not worrying too much about any disruption or other social costs.  In addition, more people living in current suburban residential areas removed from shops and services simply perpetuates a car intensive community.  True density housing should be built adjacent to or in the two main downtown cores with secondary core density areas being areas like perhaps  Westfort or the Bay-Algoma area.  True density housing is not a single detached home or duplex that accommodates renters on an existing lot in River Terrace or Vickers Park, it is two and three-bedroom apartments in 4 to 6 story buildings and sometimes even higher, situated adjacent to core areas with a lot of shops and services.  In this regard, even parts of intercity near shopping malls could be considered a location for an apartment building or condo though the swampy nature of the area probably militates against high rise construction.  If the city has surplus land and buildings in these core areas, that is what should be used to stimulate density.


And of course, just selling land and hoping  that if you sell it, they will build, is ultimately not enough. You probably need to streamline the permit and approval process as well as rebate those costs with the amount of the rebate tied to the speed with which the building is constructed and put on the market. In addition, you probably need to lower the property tax rate on such structures to make them more lucrative for developers to build density buildings.  This is a key point and a neglected one.  To start, take a look at figures 1 and 2.  Figure 1 plots population density as a proxy for urban density in Ontario’s thirty largest municipalities and Thunder Bay ranks fifth from the bottom.  Figure 2 takes those same municipalities and plots their multi-residential total property tax rate from highest to lowest.


 It turns out that Thunder Bay has the third highest multi-residential rate – just after Chatham-Kent and Windsor.  According to the 2022 BMA Municipal Report analysis, the average multi-residential rate in Ontario communities was 2.04% but in Thunder Bay it was 3.12%. Other examples include Brampton 1.56%, Hamilton, 2.73 percent, Burlington 1.45%, Sault Ste Marie 1.77%, Greater Sudbury 2.98%, and Guelph, 1.99%.  Elliot Lake is higher at 4.0%, Belleville at 3.24%, Port Colborne at 3.45%, and Timmins at 3.35%.  My point is larger cities - of which Thunder Bay is still considered one - tend to have lower rates but Thunder Bay taxes its multi-residential more like a much smaller town.  Why is Thunder Bay so spread out?  True density is penalized by its property tax structure.


Now it should be noted that a high multi-residential property tax rate in and of itself is not evidence that it is discouraging density development. In general, municipalities with weaker tax bases tend to have higher rates in general to provide the same range of services often mandated by the provincial government.  In this respect, Thunder Bay is in good company with other cities whose former lucrative industrial tax base has seen decline – Windsor, Sudbury, Hamilton, and St. Catharines.  Thunder Bay just has high rates in general and it also has the third highest residential tax rates of these thirty municipalities.


What is more relevant is not the multi-residential tax rate per se but the difference between the multi-residential rate and the single unit residential rate in a given municipality.  The greater the gap between the multi-residential rate and the residential rate applied to a given value of assessed property, the greater the incentive to build single residential housing units as opposed to multi-residential units.  While Thunder Bay has some of the highest residential and multi-residential total property tax rates in the province, it also has one of the highest differences between the two.  Relatively speaking, the larger the gap, one would expect a  greater tax disincentive to invest in large multi-unit residential properties, all other things given.  As a result, one would also expect to see a relationship between the size of the gap and the degree of urban population density with a larger gap correlated with lower population density.


Figure 3 tries to do exactly that.  It plots a scatter-plot for Ontario’s thirty largest municipalities of municipal population density as a function of the difference between the two rates.  The larger the difference -that is the higher the gap between multi-residential and residential property rates – the lower the population density, all other things given.  Of course, all other things are not given and there may indeed be other variables influencing urban density not just in Thunder Bay but other cities as well.  After all, robust economic growth that pours more people into a fixed geographic space is also a way to increase population and urban density.  However, parsing everything out would require a fairly expensive study – this is after all, just a blog – but that would mean paying a lot of money to consultants for answers Thunder Bay City Council and Administration probably do not want to hear. Namely, Thunder Bay’s municipal tax system and development policies discourage density and encourage sprawl.  Rule of Thumb. If you want less of anything, tax it more heavily.

Wednesday 8 February 2023

Policing and Crime in Ontario, Part 4: estimating needs

 This post originally appeared on the Fraser Institute Blog February 7th. This is the fourth and final post in the series.

In estimating policing needs across Ontario municipalities, one approach is to estimate the determinants of police resources then compute a predicted staffing level. Using the results for the police regression estimated in the third post in this series, we can construct an estimate of police resources per 100,000 for each community based on community characteristics such as available property tax resources, population density and regional variation, and then compare actual staffing with what would be predicted by the regression.

The chart and table below present the results of this exercise and plot the actual number of police per 100,000 versus the predicted for each municipality, and rank the results by the size of the difference between the two amounts.


Brantford has the largest difference with 182 actual officers per 100,000 and a predicted level of 163 resulting, for 19 more officers per 100,000 than the model would predict. It’s followed by Oakville (16 more), Windsor (14 more) and Thunder Bay (13 more). Indeed, of these 30 municipalities, about half have more officers per 100,000 than predicted, ranging from Brantford (19) to Niagara Falls and Hamilton (approximately 1 each). Toronto is also just above its predicted staffing at about one officer more per 100,000 than predicted. The remaining municipalities have staffing below what the model would predict, ranging from about one officer per 100,000 less for Ottawa and Richmond Hill to Oshawa (12) and Kitchener (14).

Of course, these are estimates and there can be other extenuating factors that affect police staffing and hiring in respective municipalities as well as the weight of historical staffing patterns. For example, Windsor is a border city, with cross-border demands and traffic, and an entry point into Canada that requires more policing while Thunder Bay has long-standing issues with high homicide rates, which absorb substantial investigative resources. One also wonders if the presence of casinos in some of these cities may lead to a need for more resources. Moreover, like the rest of the labour force, police forces are aging and some of the proposed hiring may reflect replacements of retirements rather than overall staffing increases.

And for those municipalities that are part of regional police arrangements, the results provide an interesting comparison of what their population sizes suggest their policing resources should be and what they’re getting via a regional arrangement.

For example, Oakville, Burlington and Milton based on the Halton Region staffing all are assigned 117 officers per 100,000 population by the statistics. The predicted staffing per 100,000 is 101 for Oakville, 120 for Burlington and 113 for Milton. Whether this is reflected in actual day-to-day operations or is simply a statistical artefact is an interesting question. It’s also interesting that even though some municipalities are near the bottom in terms of actual police officers per 100,000 population relative to other large Ontario municipalities, they still have more officers than predicted.

However, these results may assist in revisiting the cases of Toronto, Hamilton, Sudbury and Thunder Bay mentioned at the outset of this series. In the case of Toronto, there are long-standing narratives that the police force is either overstaffed or understaffed. Moreover, this debate has occurred against a background of recent rising crime and rising policing costs, more complicated policing needs, issues of racism and defunding, calls for alternate investment in areas like homelessness or mental health, and responses to evolving events such as the recent violence on Toronto public transit. Hamilton has issues similar to Toronto and in the evolving debate over its proposed increases in the policing budget there’s the recent news that Hamilton had a historic drop in homicides in 2022. Does this mean that Hamilton’s police force is so effective that it does not need more officers? Or that Hamilton just got lucky in 2022 and crime rates are more random than one might imagine?

Making resource decisions in a heated, emotionally or politically charged debate environment driven by the events of the moment is not always the best policy approach. While empirical evidence is but one piece of the decision-making process, both Toronto and Hamilton appear to be very close to what the determinants in the models would predict their staffing levels to be, suggesting that other factors notwithstanding, at the very least, better deployment of existing resources may be something worth considering.

Sudbury, on the other hand has eight fewer officers per 100,000 population than the model would predict while Thunder Bay already has 14 more officers per 100,000 than one might expect. A simplistic interpretation of these results given their size would be that Sudbury should go ahead and hire more while Thunder Bay should not. However, if Sudbury is currently able to achieve its policing goals with fewer resources, then it should not automatically feel compelled to ramp them up. As for Thunder Bay, the picture there’s probably more complicated than even a regression equation can possibly imagine, but that still does not mean better deployment of existing resources should not be a complement to whatever else is deemed necessary.

The takeaway from all this is that policing and public safety is complex and complicated and more effort should be made to acquire evidence to support decision-making. The types of results are simply one piece of evidence that can go into resource allocation decisions at budget time, and municipal ratepayers and their city councils should make wise use of all available information. This is especially the case given the large increases in tax rates that seem to be marking municipal budget season in Ontario this year.


Policing and Crime in Ontario, Part 3: statistical relationships

 This post originally appeared on the Fraser Institute Blog, February 7th.


Crime rates and severity, as well as policing resources per person, can differ substantially across Ontario municipalities. Naturally, Ontarians want to know the relationship between crime and police resources, particularly when police forces are asking for more money.

The first chart below plots the number of police officers per 100,000 against the Crime Severity Index (CSI) in Ontario’s 30 largest municipalities. As illustrated, there’s a positive relationship between crime severity and police levels, which some might find counterintuitive as one would think that more police means less crime. However, as has been noted, it’s sometimes difficult to sort out if more police officers result in less crime or whether more crime leads to a call for more police resources and an increase in police officers. Or even if more officers and more crime are positively related because of more effective reporting and control of crime.


While one could interpret this as evidence that more crime requires more police, it remains that we must account for the aforementioned bidirectional nature of the relationship and this ultimately requires controlling for confounding factors before attempting to answer the question as to whether the crime severity in these communities supports the policing numbers.

The table below presents regression estimates of the determinants of crime severity and policing using data for the 30 largest Ontario municipalities in 2021 and with a methodology similar to other studies. The regression models first estimate a regression of the CSI on police officers per 100,000, average household income in the municipality, and regional variables placing the municipalities in either Northern, Eastern, Western, Central/GTA or the Niagara Peninsula (with Central/GTA as the omitted regional comparison variable). Northern municipalities are Thunder Bay and Sudbury. Eastern municipalities are Ottawa and Kingston. Western municipalities include London, Windsor and Chatham-Kent. The Niagara peninsula includes Hamilton, St. Catharines and Niagara Falls. The remainder are in the Central/GTA region.


To account for bidirectional or simultaneous effects, this regression was used to estimate a fitted CSI from the estimated coefficients, and it was then used in the police officers per 100,000 regression as the crime variable. The remaining determinants in the police regression were average residential property taxes for a three-bedroom bungalow as a measure of potential community resources, population density (persons per square kilometre), and then again, the set of regional variables, which are included to capture regional differences that might uniquely affect not only crime rates and severity but also the operation of police services. For example, Indigenous peoples comprise a larger population share of Northern Ontario and according to self-reported information from the 2009 General Social survey (GSS), aboriginal people were two times more likely than non-aboriginal people to experience violent victimization such as an assault, sexual assault or robbery (232 versus 114 incidents per 1,000 population). The approach is essentially a simultaneous equations technique and also uses weighted regression where observations were weighted by municipal population size thereby providing greater weight to larger population size municipalities.

The results show that variables significantly affecting crime severity positively include police officers per 100,000 population and the regional variable with Northern and Western Ontario demonstrating higher crime rates relative to the Central/GTA municipalities. As well, crime severity is negatively and significantly related to average household incomes in the municipality. Crime severity is also positively and significantly related to police officers per 100,000, which can be interpreted either as having more police officers per person results in more crime being reported and dealt with, or more crime requires more police officers.

In the police determinants regression, police officers per 100,000 is positively and significantly related to crime severity (fitted) and population density. The only regional variable that’s significant here is Western Ontario and that variable shows that Western Ontario has fewer police officers per 100,000 in relation to the Central/GTA region, all other things given. Both regressions explain a high proportion of the variation in the dependent variables.

Having established a statistical relationship between policing resources and crime rates after accounting for a number of confounding factors, the next step (in the fourth and final post of this blog series) is to use these results to see what predicted police staffing levels are like and how they compare to actual levels.


Tuesday 7 February 2023

Policing and Crime in Ontario, Part 2: severity and levels

 This post originally appeared on the Fraser Institute Blog on February 6th.

While crime in Ontario has been rising recently, it’s still at comparatively low levels while the number the number of police officers per person is also relatively low. However, there are sometimes rather large differences across Ontario’s cities both in terms of police staffing, crime rates and crime severity. The reasons for these differences can be complex ranging from historical and institutional factors to geographic spread of municipalities and local policing environments rooted in different crime rates and types of crimes.

The chart below plots police officers per 100,000 population in 2021 for Ontario’s 30 largest municipalities by population and ranks them from highest to lowest. (Note that a number of these municipalities have regional police services and in the chart the per-person policing number for the regional service has been assigned to the municipality.) The average across these 30 municipalities is 144 officers per 100,000, which is below the provincial level of 176 per 100,000 reflecting higher police per 100,000 population in more rural or remote areas with large geographies and sparser populations.


The level of policing ranges from a high of 200.4 officers per 100,000 in Thunder Bay to a low of 117 per 100,000 for the set of communities in the Halton region—a substantial difference. The four highest number of officers per 100,000 are for Thunder Bay, Windsor, Brantford and Toronto, ranging respectively from 39 per cent to 17 per cent above the 30-municipality average of 144. Conversely, the four lowest communities of Milton, Burlington, Oakville and Waterloo (which incidentally are all part of regional forces) are respectively 12 per cent to 18 per cent below the average.

The second chart plots the ranked Crime Severity Index (CSI) for these 30 communities. The CSI is a relatively new tool that complements existing measures of traditional crime rates by taking severity and the volume of crime into account (Statistics Canada, 2009). All Criminal Code offences, including traffic offences and other federal statute offences, are included in the CSI. In the calculation of the CSI, each offence is assigned a weight, derived from average sentences handed down by criminal courts with more serious sentences on average for the crimes resulting in a higher weight for that offence. Thus, more serious offences (for example, homicides versus traffic offences) have a greater impact on changes in the index.


The results again show a substantial range in overall crime severity ranging from highs of 105 and 98 for Windsor and Thunder Bay to lows of about 23 for the Halton region communities of Oakville, Burlington and Milton with an average CSI across these 30 communities of 57. While there’s a wide range in crime severity across these Ontario cities, given that the CSI is standardized with Canada equal to 100, Ontario cities generally rank lower in crime severity than some other parts of Canada such as Manitoba, Saskatchewan and the Territories.

Again, it should be noted that a number of these municipalities have regional police services and the crime severity index as reported for the regional service has been assigned to the municipality. The communities with the highest crime severity are Windsor, Thunder Bay, Brantford and Sudbury, which range from 84 per cent to 54 per cent above the average crime severity. Meanwhile, for the communities at the bottom—Brampton, Oakville, Burlington and Milton—they are 35 per cent to 60 per cent below the average crime severity. Notably, the per cent differences from the average for crime severity across these communities is larger than the difference in policing resources.

Of course, when examining what crime is like in these same communities and ultimately what relation the municipality may have to policing resources, it’s important to bear in mind that the relationship between crime rates, crime severity and policing is bidirectional or somewhat murky. On the one hand, one would expect that more police, all other things given, should result in lower crime rates as more resources are brought to bear on the problems. At the same time, one might also find that higher crime rates spur calls for more police resources, which in turn results in the hiring of more police. Put another way, it’s sometimes difficult to sort out if more police officers result in less crime or more crime also leads to more police officers.

In the next post in this blog series, we’ll take a more in-depth look at the relationship between policing resources and crime severity in these Ontario communities.