The 2025 CIHI National Health Expenditure trends are out with the key national findings being that total health care spending in Canada is expected to reach $399 billion in 2025, or $9,626 per Canadian with that expenditure representing 12.7% of Canada’s gross domestic product (GDP) in 2025. Total health care spending in Canada is expected to grow by 4.2% in 2025 following a 6.1% increase in 2024 and 7.4% in 2023. I will be dealing with the national numbers elsewhere but my interest in this post is Ontario provincial government health spending which for 2025 is estimated at $93 billion up 3.3 percent from the year previous and not as large an increase as 2024 at 6.3 percent. While the provincial government makes much of its spending increases being at historic levels, a 3.3 percent increase does not keep up with inflation and population.
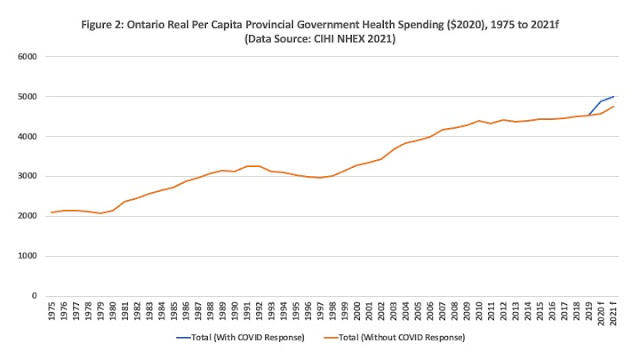
Figure 1 plots real per capita Ontario government health spending in 2025 dollars (deflated with the CIHI’s Total Health Care Implicit Price Index) along with the spending to GDP ratio for the 1975 to 2025 period and while the overall trend is upwards, the period since the pandemic is particularly noteworthy. After the pandemic surge in real per capita provincial government health spending of 8.5 percent in 2020 and 4.9 percent in 2021, each subsequent year has seen negative growth with 2025 declining just over one-fifth of one percent. However, at $5,750 per capita ($2025), spending in 2025 remains nearly 10 percent above the 2019 amount of $5,233 ($2025) implying average spending growth since 2019 of approximately 1.7 percent annually.

What is more interesting in Figure 1 is that while real per capita provincial government health spending has been trending down since 2021, its share of provincial GDP has been going up. How can that be? As anemic as provincial health spending growth has been relative to inflation and population, it turns out Ontario’s economic growth has been even more anemic. This is not the greatest news.
Figure 2 illustrates that despite slightly negative real per capita growth in provincial government health spending; there is considerable variation across categories that may signal what the government’s priorities are. Real per capita hospital spending declined 3.5 percent in 2024 but is expected to rise 0.5 percent in 2025. After a 5.3 percent increase in 2024, real per capita other institutions (i.e., long term care) will decline one fifth of one percent with a similar pattern for physicians at 5.1 percent in 2024 but -1.4 percent for 2025. Other professional (e.g. optometrists) drugs, public health and administration are being hit with consecutive declines in real per capita spending. Other health spending including home and community care is seeing an increase in 2025 while real per capita capital spending will rise nearly 20 percent in 2025. While renewing capital infrastructure in provincial government health spending is welcome, all that shiny new equipment and buildings will need hospital and physician services as well as drug spending down the road.

And if you are interested in something different, Figures 3 and 4 present provincial government health spending by age categories to look at what an aging population has been doing to provincial government health spending. Figure 3 plots per capita provincial (nominal dollars) government spending by age group for four years spanning the 2000 to 2023 period and they show the typical expected u-shaped cost curve with spending highest at the very early ages of birth to about 4 years, then rising gradually and growing more dramatically after the late 50s. In 2023, the per capita spending for a person under 1 year of age averaged $17,591 dollars, for a 25–29-year-old it was $2,594, for a 55–59-year-old it was $5,037 and for an 85–89-year-old it was $29,415. Indeed, health care costs can rise dramatically over the later years of the life cycle.

However, the astute gentle reader will note that the profiles by age have been shifting upward over time. That is, spending has been going up for all the age categories and figure 4 plots the percent changes in per capita provincial government spending from 2000 to 2023 by age category. While spending per capita is highest for the elderly, growth over time has been the greatest in much younger demographics. The greatest growth was in the age 10-14 category at 207 percent, followed by the below 1-year category at 204 percent, then 194 percent for those aged 5-9, 172 percent for those aged 15-19 and 169 percent for those aged 1-4 years. After that come 35–39-year-olds at 153 percent, 40–44-year-olds at 151 percent, and 45–49-year-olds at 145 percent.

The smallest increases over the 2000 to 2023 period? At the bottom are 80–84-year-olds at 90 percent, next highest are 75–79-year-olds at 94 percent and then 70–74-year-olds at 96 percent. Health spending does rise with age, and much more is spent per capita on the elderly than the young. However, in percentage terms, the greatest increases have been in the population aged 19 years and younger followed by the population aged 30 to 64 and 90 plus. Lowest increases are in the 20-29 age groups and the 70-89 age groups. This is an interesting and somewhat counter intuitive results given the conventional wisdom is that health care costs are being driven largely by an aging population. It would appear the drivers of provincial government health care spending are more complicated than one might imagine.
Note: Livio Di Matteo is a member of the CIHI NHEX Advisory Panel.