Northern Economist 2.0

Friday, 20 December 2024

Federal Finances in Review


The last week has been a chaotic one in Ottawa given the resignation of the finance minister on the eve of the Federal Economic and Fiscal Statement (FES), the turmoil over the Prime Minister’s leadership and the ongoing verbal assaults of President-elect Trump on Canadian sovereignty.  Nonetheless, lost in all of this is that after a considerable delay, there has finally been an update to Canada’s Fiscal Reference Tables (FRT) and Figures 1-4 here provide an overview of both the past (1966-67 to 2023-24) as laid out in the FRT and the future (2024-25 to 2028-29) such as it is laid out in the FES. 

Figure 1 provides a nice snapshot of the federal fiscal footprint – the federal spending to GDP ratio. Over the period of this chart, the federal footprint reached a  maximum of 25.6 percent in 2020-21 during the pandemic. This was of a course an outlier year and if one takes this out, one nevertheless notices that from a low of 13.9 percent in 2013-14, the federal fiscal footprint has gradually drifted upwards notwithstanding the pandemic and in 2022-24 stood at 17 percent.  While not at the level of the 1980s when it exceeded 20 percent, it remains that the federal fiscal footprint both in 2023-24 and going forward to 2028-29 is the largest it has been since the late 1990s and marks a calculated expansion of federal public sector size relative to GDP.


 Part of this rising expenditure has been financed via borrowing and in 2023-24 the deficit stood at nearly $62 billion.  From 2023-24 to 2028-29, Canada is forecast to accumulate another $242 billion dollars in deficits bringing the national net debt to $1.549 trillion by 2028-29. Figure 2 plots the deficit to GDP ratio, and it stands at nearly 2 percent for 2023-24 and is forecast to drop to 0.7 percent by 2028-29 – assuming of course that given the deficits projected, nominal GDP growth proceeds at 4 percent annually.  Given the slowdown in the economy that appears to be underway and the likely imposition of US tariffs in 2025, this would appear to be an exceptionally rosy GDP growth forecast.


 Figure 3 plots the net debt to GDP ratio, and it began to take a definite upward path starting in 2019-20 when it went to 37 percent from 33 percent the year previous.  It peaked at just over 44 percent in 2022-23 and is only going to come down slowly to about 42 percent by 2028-29.  Now, while up by recent standards, it is nowhere near where it was during the federal fiscal crisis of the 1990s.  Yet, the debt is mounting, and interest rates are higher than they were during the debt and spending spiral of the pandemic and so debt service costs have gone up.


 In 2019-20, debt service costs were $24.4 billion representing about 7 percent of federal revenues that year.  For 2024-25 they are anticipated to be more than double at $53.7 billion or 10.8 percent of federal revenues.   By 2028-29, it is projected that annual debt service costs will reach $66.3 billion or 11.3 percent of federal revenues.  As Figure 4 illustrates, we are again nowhere near the numbers of the federal fiscal crisis when well over 30 percent of federal revenues went to service the debt. At the same time, we appear to have settled at a plateau over 10 percent for the foreseeable future and that is money better spent on programs.


 In her resignation letter, the outgoing finance minister appeared to have a fiscal epiphany as she noted the need to keep our fiscal powder dry to face the economic challenges coming down the pipeline.  The trends of the last few years suggest that there has been a certain dampness to federal fiscal powder for the last few years that is expected to persist into the future.  While there is still fiscal room to manoeuvre, a large recessionary shock will quickly erode that room given the gradual enrichment of long-term  federal spending via assorted initiatives over the last decade as illustrated by the federal expenditure to GDP ratio. This suggests that dealing with a major recession will be more challenging that it would have been a decade ago.


Tuesday, 21 March 2023

Ontario Budgets: The Long View


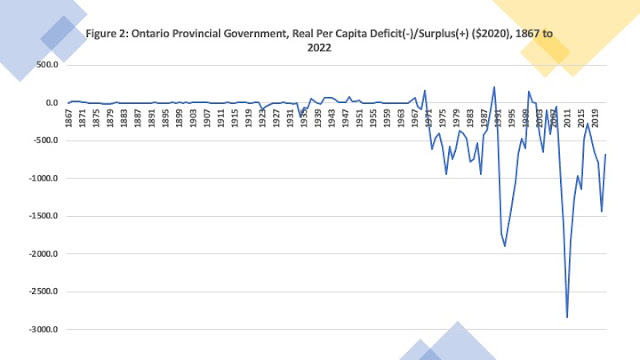
As we get ready for Ontario Budget Day, its always fun to look at the long-term picture to see where Ontario has been.  And by long-term, I mean the entire period in which Ontario has been a province of Canada – 1867 to 2022.  Figure 1 uses data from historic Ontario Budgets for the and from the Finances of the Nation fiscal and macroeconomic database to construct and plot real per capita Ontario government revenues and expenditures in 2020 dollars for the period 1867 to 2022.  Real per capita revenues have grown from about $40 per person in the 1870s to reach over 10,000 dollars today.  Expenditures have followed a similar pattern.  Much of the growth in per capita spending has occurred since the mid 1960s with the expansion of public health care as well as education spending.  From 1868 to 1965, real per capita expenditures grew from $22 to $1468 and since then has grown to reach $11,470.  Indeed, the implied annual growth rate of real per capita spending over this entire period works out to about 4 percent.


Figure 2 weighs in with a long-term picture of fiscal balance – deficits and surpluses.  Needless-to-say, a better measure would be a deficit to GDP ratio but Ontario GDP pre-1960 is more difficult to acquire though one day constructing estimates going back to 1867 is possible.  Over the entire 155-year period covered by this data, there has been a deficit in 87 years – 56 percent of the time.  Deficits were less common prior to 1945 with deficits only 46 percent of the time whereas since 1946 there has been a deficit two-thirds of the time.  However, the post-World War II period can be divided into two periods – one of consistent surpluses and one of consistent deficits.  The longest consecutive run of surpluses in Ontario history is from 1941 to 1967. In the period since 1967, Ontario has run a deficit 93 percent of the time. 


And there you have it. Happy Budget Day.

Monday, 21 September 2020

Deficits, Inflation and Interest Rates: A Very Simple Analysis


The immediate impact of COVID-19 on Canada’s economy - like many others - has been a drop in GDP and a massive ramping up of government deficits given the collapse in revenues and in increase in emergency spending and benefits.  At the federal level, the deficit for 2020 is anticipated to be closer to $400 billion. In the wake of Wednesday’s Throne Speech there should be a fiscal update or budget that will provide further fiscal details.  In the meantime, it is worth thinking a bit about what the ultimate impact of such large deficits will be not just in Canada but on the world economy.


The traditional aggregate demand(AD)-aggregate supply(AS) framework for looking at fiscal and monetary policy suggests that large deficits will shift AD to the right and raise price (P) and output (Y).  The increase in prices then triggers inflationary expectations which shifts the aggregate supply curve upwards starting a wage-price spiral.  Bringing inflation under control ultimately then requires tighter monetary policy that raises interest rates and brings down aggregate demand and inflationary expectations. It all seems simple enough except since 2008-09, the massive deficits incurred around the world do not seem to have done any of this.  Indeed, inflation is low and interest rates have gone lower.  The world is awash in cheap money.  And, Modern Monetary Theory (MMT) has been gaining ground with arguments that we can stimulate demand practically forever by having sovereign governments with their own currency increasing the money supply.


I think if we had to draw a picture of the global economy under the current situation, it looks something like this (Figure 1):


If we think of the world economy as a giant AD and a giant AS curve, the AD curve has a traditional downward slope, but the AS curve is flat rather than upward sloping or vertical.  That is, world aggregate supply as a result of integrated international supply chains, trade, increasing capital mobility, technology and digitization – essentially the results of globalization since the 1990s – has become perfectly elastic.  As a result, even with deficits and cheap money shifting that aggregate demand curve repeatedly to the right, there has been no inflationary pressure.  Supply has expanded to accommodate demand and hence inflation has stayed low and there has been no upward pressure on interest rates.


This means that in a sense we are going to be able to both have our cake and eat it for some time.  Inflation will probably not rear up its head anytime soon and interest rates are going to stay low and probably below the rate of economic growth meaning that governments will not face immense debt service or debt burdens from their massively expanding debt.  However, I think eventually, the global economy is going to more likely start to resemble Figure 2 down below:


While one can argue that the economy has always been global, modern economic history has been marked by two distinct periods of globalization: 1870 to 1914 and 1990 to 2016.  The first great globalization coincided with the hegemony of the Pax Britannica, the  industrial age and the liberalization of the world economy which came to a crashing halt with World War I and which then took decades to resume.  After the shocks and trauma of trade restrictions, world wars, political extremism and the Depression, the post-World War II era saw slow steps to more trade and the fall of the Berlin Wall marks the start of the second age of globalization and trade liberalization which moved together with the internet and rapid technological change in communications, and China’s rapid industrialization and development. Much of this growth of trade occurred under the hegemony of the Pax Americana and included shifting of production to lower labour cost environments.  This age was dealt a blow by the 2008-09 recession and came to an end with the rise of populism and trade restrictions which officially begin with the election of Donald Trump in 2016 and the American retreat from a more global role.


The second great globalization essentially flattened the aggregate supply curve which is why inflationary pressure has been muted.  Because of technological change, improved transport and communications, the shifting of production to the cheapest spot with integrated supply chains, and freer trade – the aggregate supply curve became perfectly elastic and able to accommodate rising AD at an almost infinite pace.  However, we are now in a volatile  transition period that has been aggravated by the pandemic. Since 2016, there have been more trade disputes, concern and push back against China’s seeming unwillingness to play by the rules of a more liberal-democratic world economic order, and trade disruption by populist politicians.  The end result of this will be an AS curve marked by higher costs of production with output expansion – in other words, more of an upward sloping curve. 


The result of expanding demand with an upward sloping AS curve will be rising prices and hence the return of inflation.  Combine this upward pressure on prices with eventual competition for borrowers to take on more and more government debt and there will be a rise in interest rates.  The events of the last five years have ensured that interest rates will rise – it is not a question of if but when.

Thursday, 1 February 2018

Ontario's Fiscal Paradox

My latest on Ontario's public finances...

Ontario has wrapped up its 2018 pre-budget public consultations as it prepares to deliver its next provincial budget. Ontario Finance Minister Charles Sousa confirmed in the fall fiscal statement that Ontario’s 2018 budget will be balanced, as will budgets over the next two years. However, the average Ontarian may be confused by the fact that despite a future of projected balanced budgets, the provincial net debt will continue to increase.

Indeed, recent years have seen the provincial debt grow by amounts exceeding that year’s deficit. For example, in fiscal year 2014-15, Ontario’s budgetary deficit was $10.315 billion but the net debt rose by $17.386 billion. In 2015-16, the deficit was $3.515 billion but $10.796 billion was added to the net debt. In 2016-17, the deficit was $0.991 billion but $6.276 billion was added to the net debt.
So how can this happen? See here for the rest of the post on the Fraser Blog...

Wednesday, 22 November 2017

Bigger Deficits in 2016


Statistics Canada has released its 2016 Consolidated Government Finance Statistics and the combined deficit of all three levels combined – federal, provincial-territorial and local – was $18.1 billion in 2016 which was up from $12.9 in 2015.  According to Statistics Canada, the increase in the combined deficit was attributable to expenses rising faster than revenue.  Government spending in Canada in 2016 was up by 2.6% while revenues were up by 1.0 percent.  The accompany chart from Statistics Canada summarizes the picture nicely.

 
The federal government saw an especially pronounced deterioration.  The net operating balance deficit for the federal government was $10.0 billion in 2016, compared with a $2.1 billion surplus the previous year. Total federal expenses grew 4.2%, due to an increase in social benefits (old age and family allowances) and grants to provinces and territories expenses, while revenue actually was down 0.1%. A big component of that revenue drop incidentally was from income tax revenue – despite the increase in personal income rates on higher earners that kicked in.  For a longer term take on federal finances, you might want to check another post of mine here.

As for the provinces, net operating balances in deficit were reported in 9 of 13 jurisdictions with Alberta (-$9.9 billion), Manitoba and Ontario (each -$1.7 billion) having the largest deficits in 2016.  While still in deficit, Ontario's net operating balance improved the most, due to higher revenues from corporate income taxes and taxes on goods and services – but then Ontario’s economy in 2016 did see an improvement.  As for the largest surpluses – meet the new poster children for fiscal responsibility in Canada in 2016:  British Columbia (+$4.9 billion) and Quebec (+$4.4 billion).

Thursday, 16 March 2017

A Brief History of Federal Budgets


The following op-ed appeared in the Waterloo Region Record, March 16th, 2017 and the New Brunswick Telegraph-Journal, March 13th, 2017.

The upcoming federal budget comes in Canada's 150th year — an important milestone for what is perhaps the most successful country in the world. The evolution of federal finances since 1867 reflects a changing economy and offers important lessons regarding the perils of persistent deficit spending and growing indebtedness.
Canada's federal government has indeed grown. In 1867, it had a budget of $14 million, an expenditure-to-GDP ratio of approximately five per cent, a net debt of $75.7 million, and a net debt-to-GDP ratio of 20 per cent. Transportation, communications and economic development accounted for a quarter of federal spending, and transfers to other governments 20 per cent. Meanwhile, debt service charges were 27 per cent due the newly formed federal government assuming provincial debts. There were no transfers to persons.
By comparison, total federal government spending in 2017 is estimated at $331 billion with an expenditure-to-GDP ratio of nearly 16 per cent and a net federal public debt of $760 billion, resulting in a debt-to-GDP ratio of 36 per cent. Assorted transfers to persons and other levels of governments now account for nearly two-thirds of federal government spending.
Until the First World War, customs duties dominated federal government revenue. The war effort sparked the search for new revenues leading to the creation of the first personal and corporate incomes taxes and the first federal sales tax. Over time, the importance of these three new revenue sources grew, and in 2017 it's anticipated that the personal income tax alone will make up 51 per cent of federal government revenue, with corporate taxes comprising 13 per cent and commodity taxes (GST, excise taxes and customs duties) making up 17 per cent.
The 150 years since Confederation have seen the federal government's primary focus transition from the active economic development of a country grounded in liberal economic principles to an activist role partly aimed at bringing about a more egalitarian society via social spending. Despite the benefits, expanded federal spending in the post-Second World War era — given the subsequent slowing of economic growth, rising interest rates and the absence of more concerted fiscal discipline — ultimately resulted in the 1990s federal debt crisis.
Prudent government spending is useful, such as the construction of the transcontinental CPR railway where subsidies encouraged the building of a risky transportation project. However, the same strategy also saw over-subsidization of the CPR and substantial subsidies to two other less-successful rail lines. More government spending is not always better, and that also applies to deficit financing.
Over the period 1867 to 2017, Canada's federal government ran a deficit nearly three-quarters of the time, with the largest deficits-to-GDP ratios during the two world wars and the great divergence between revenues and spending leading to the 1990s debt crisis. Large deficits and interest rates greater than the economy's growth rate during the 1970s and 1980s lead to a rising debt-to-GDP ratio and the federal fiscal crisis of the early 1990s.
The important policy decisions when it comes to spending are when to spend, what to spend, how much, and how to pay for it. The wrong answer to any of these questions has negative fiscal implications.
Given the surge in federal deficit financing in the wake of the 2016 budget, one wonders if the lessons of the 1990s have already been forgotten. While interest rates remain at historic lows, economic growth is also low, making a case for fiscal prudence given the dynamics of deficits and debt. The progress made in reducing the federal net debt-to-GDP ratio below 40 per cent will be largely squandered if we allow debt to once again grow uncontrollably.

Livio Di Matteo is a senior fellow at the Fraser Institute and professor of economics at Lakehead University. He is the author of “A Federal Fiscal History: Canada, 1867-2017.” Distributed by Troy Media