
As we get ready for Ontario Budget Day, its always fun to look at the long-term picture to see where Ontario has been. And by long-term, I mean the entire period in which Ontario has been a province of Canada – 1867 to 2022. Figure 1 uses data from historic Ontario Budgets for the and from the Finances of the Nation fiscal and macroeconomic database to construct and plot real per capita Ontario government revenues and expenditures in 2020 dollars for the period 1867 to 2022. Real per capita revenues have grown from about $40 per person in the 1870s to reach over 10,000 dollars today. Expenditures have followed a similar pattern. Much of the growth in per capita spending has occurred since the mid 1960s with the expansion of public health care as well as education spending. From 1868 to 1965, real per capita expenditures grew from $22 to $1468 and since then has grown to reach $11,470. Indeed, the implied annual growth rate of real per capita spending over this entire period works out to about 4 percent.

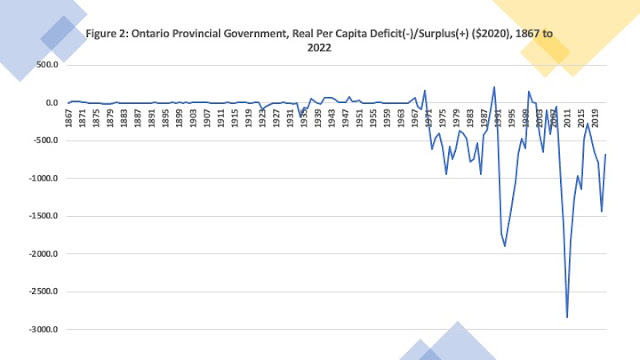
Figure 2 weighs in with a long-term picture of fiscal balance – deficits and surpluses. Needless-to-say, a better measure would be a deficit to GDP ratio but Ontario GDP pre-1960 is more difficult to acquire though one day constructing estimates going back to 1867 is possible. Over the entire 155-year period covered by this data, there has been a deficit in 87 years – 56 percent of the time. Deficits were less common prior to 1945 with deficits only 46 percent of the time whereas since 1946 there has been a deficit two-thirds of the time. However, the post-World War II period can be divided into two periods – one of consistent surpluses and one of consistent deficits. The longest consecutive run of surpluses in Ontario history is from 1941 to 1967. In the period since 1967, Ontario has run a deficit 93 percent of the time.
And there you have it. Happy Budget Day.