Northern Economist 2.0

Wednesday, 15 December 2021

Analysis: Federal Economic and Fiscal Update Fall 2021


Yesterday’s federal economic and fiscal update has been lauded as showing an economy doing much better than expected as well as improved federal finances relative to the spring 2021 budget.  In the end, the recovery from the depths of the pandemic has been much better than was anticipated and this has resulted in federal government revenues much greater than was forecast last spring.  Figure 1 shows that revenue is expected to be billions of dollars higher in each fiscal year up to 2025-26. – as much as 20 billion dollars more in some of the years.  Indeed, over the six years from 2020-21 to 2025-26, total additional revenues are expected to total about $106 billion.


However, as Figure 2 illustrates, that is being accompanied by a parallel process on the federal expenditure side.  Aside from 2020-21 which has turned out to have about $6 billion less spending than expected, the other years will see higher additional expenditures than originally forecast ranging from $7 billion to $15 billion.  Over the entire six-year period, the federal government will be spending an additional $54 billion than was laid out in the spring budget.  So, about half of the new revenues are going into additional spending while the other half enables the government to have a smaller deficit than planned in each of the years ahead.  


Whereas the spring 2021 budget saw a deficit (including actuarial losses) in 2021-22 of $154.7 billion, it is now forecast to be $144.5 billion.  By 2025-26, the deficit (including actuarial losses) is now expected at $13.1 billion whereas before it was going to be $30.7 billion.  Naturally, smaller deficits down the road will result in a smaller net debt and smaller net debt to GDP ratios given the projected GDP growth.  So rather than a net debt of $1.529 trillion by 2025-26, it should only be $1.359 billion.  The world should last so long.


Two things have been left unsaid about the updated numbers.  First, when all is said and done and the COVID-19 spending bubble wound up circa 2022-23, spending will be about 22 percent higher than it was in 2019-20.  Put another way, COVID-19 aside, federal spending will have grown at just over 7 percent a year.  The pandemic in classic Peacock-Wiseman fashion has provided an opportunity for the federal government to expand its spending and there has been an upward shift or displacement that is going to remain permanent. 


Second and more disturbing is if one accepts the average federal government inflation forecast over the next five years of 2.6 percent and adds in population growth of just over 1 percent annually, then the average nominal GDP growth of 4 percent from 2022 to 2026 is eaten up by inflation and population growth such that real per capita GDP after the post COVID rebound is essentially going to be flat after 2022.  If inflation turns out to be higher at say in the 4 to 5 percent range, then we are looking at a decline in real per capita GDP over the same period. There is not going to be any real growth.  That is the disturbing aspect of this update.  There is going to be a permanent enrichment of federal spending but not in the actual real economic growth of the economy. 

Sunday, 5 December 2021

Inflation and Unemployment

 My most recent post on the Fraser Institute Blog dealt with an international comparison of inflation and unemployment. Enjoy.


Unemployment and inflation—Canada’s worrying numbers


With the inflation debate in Canada focusing on whether this inflation is transitory or not, we’ve seen little discussion about how our inflation compares with other advanced economies.

The International Monetary Fund released its update of the World Economic Outlook Database in October and there are now updated estimates for 2021 and beyond. While monthly consumer inflation in Canada (according to Statistics Canada) is currently pushing 5 per cent, our consumer inflation for 2021—as estimated by the International Monetary Fund (IMF) using consumer prices—is expected to be closer to 4 per cent.

For the major 35 IMF advanced economies, consumer inflation in 2021 is expected to average 2.8 per cent, putting Canada well above the average. The rates are expected to range from highs of 7 per cent for Estonia and 5 per cent for the United States to lows of just under 1 per cent for Switzerland and Japan. At 3.8 per cent, Canada’s inflation rate for 2021 is expected to rank 6th highest of the 35 IMF advanced economies.

Of course, some might argue that a little inflation might be just the lubricant needed to help pandemic-stricken economies rebound given the traditional macroeconomic relationship (provided by the Phillips Curve) between inflation and unemployment, which posits an inverse relationship between the two variables. That is, high inflation rates have been associated with low unemployment rates whereas lower inflation rates have often been accompanied by higher unemployment rates.

This would suggest that across these countries, if Canada has a higher inflation rate, then it should also have a markedly lower unemployment rate.

However, that does not appear to be the case. Again, the IMF estimates for 2021 reveal an average unemployment rate for the 35 IMF advanced economies at 6.2 per cent with Canada again above the average at 7.7 per cent. The highest rates are just over 15 per cent for Greece and Spain while the lowest are expected in Japan and Singapore at just under 3 per cent. Indeed, Canada is expected to have the 8th highest unemployment rate of these advanced economies.

Higher unemployment and higher inflation—once termed “stagflation”—is a truly miserable macroeconomic outcome. Indeed, the sum of the inflation rate and the unemployment rate has been dubbed the Misery Index and a quick calculation of this index for these advanced economies puts Canada in the 6th highest spot. As the chart below illustrates, the most “miserable” advanced economies in 2021 are expected to be Spain, Greece, Estonia, Latvia, Italy and Canada with the combined sum of the inflation rate and the unemployment rate ranging from 17.9 per cent to 11.5 per cent.


At the bottom in terms of misery are Taiwan, Singapore, Switzerland and Japan ranging from 5.4 per cent to 3.5 per cent.

For Canadians, the adage that misery loves company will be cold comfort given the higher costs of food, energy and rent that have marked the last few months. While many might argue that our inflation is not as severe as that of the U.S., with our unemployment rate remaining higher than other countries (including the U.S. at 5.4 per cent), Canadians are indeed left wondering if 2022 will be better or worse.


Monday, 22 November 2021

IT's Back....Again! The Turf Facility Project


Like a zombie that keeps coming back to life, the multi-use indoor turf facility project is back on the agenda at Thunder Bay City Council this evening as a report is received on the eight outside proposals that were commissioned.  And in an apparently blatant disregard for transparency, the details of the discussion will not be shared with the public.  However, the decision has been further complicated by a new application for federal funding on which the City awaits an answer with the funding apparently tied to building a facility that conforms to green and inclusive community building conditions.  This of course raises the question as to what the actual price tag for such a facility will ultimately really be.


This application is for approximately $22 million dollars and that is expected to cover about half of the costs so we are looking for a total price tag of about $44 million of which half would supposedly come from federal funding.  And yet, the question is whether the costs of the new building will now change substantially given that it must conform to the requirements of the federal funding program.  City council rejected the proposal to build the facility when it was $39 million so getting it for substantially less in terms of City dollars may be attractive to those on council who like to pay lip service to the Zeller's Rule - the lowest price is the law. 


At the same time, the application process for the new funds is competitive and Fort William First Nation has also asked for $25 million from the fund to build a long-term care home.  As elastic as the federal budget constraint seems to be these days one suspects it is unlikely Thunder Bay’s cabinet representative is going to be able to swing both projects.  After all, Minister Hajdu’s star seems on the wane given what some might interpret as a demotion from Health. 


The minister was not even able to use her clout to secure a return to international flight status for Thunder Bay’s airport for the coming winter getaway travel season meaning no return to direct flights to places like Cuba and the Dominican Republic in January and February.  And as Indigenous Services Minister, it would be awkward to say the least to have funding for the turf facility approved in her hometown while the needs of indigenous long-term care are neglected. 


So, Thunder Bay seems to be about to embark on another divisive and argumentative round of talks over a project that many in the community are now opposed to in the wake of numerous other city issues with good odds that nothing is going to happen.  Even if a project is approved, often it does not happen as those waiting for the transitional housing project on Junot Avenue have discovered. 


Still, the fact that this project still resurfaces and has its proponents begs the question of why so many members of council are so devoted to seeing it go ahead and staking so much political capital on the project considering the other problems this city faces.  There is a lot going on here. There are homeless encampments in the city, there are homeless people wandering the streets of major thoroughfares at peak traffic times soliciting funds at intersections, there are hundreds showing up for meals at the local soup kitchens.  Homes are still having their front lawns dug up in the wake of the sodium hydroxide leaky pipes fiasco that has affected thousands of homeowners.  And tax rates having been rising over the last few years well in excess of the amounts necessary to fund City services.


With so much on its plate and an election coming soon, who benefits from continuing this discussion?  Good question.


Thursday, 18 November 2021

COVID-19 Wave Score: Ontario 4, Thunder Bay 1


It has been a while since I have plotted the COVID-19 daily case counts for both Ontario and the Thunder Bay District but with the gradually mounting numbers of recent days, now is as good a time as any to look back at the big picture for both the province and our region. The evidence suggests that for the time being matters are well in hand likely the result of Ontario’s high double vaccination rates as well as the gradual easing of restrictions with the maintenance of mask wearing in public indoor spaces.


Figure 1 plots Ontario’s daily cases since the start of the pandemic and there have indeed been four waves with the second and third waves the most severe. Our fourth wave is underway, but it is subdued relative to the second and third waves.  Yet this fourth wave seems to have two components based on Figure 1 – a first upswing that appears to have peaked about mid-September and followed by a short decline and then a second upswing that does seem to coincide with the broader reopening of Ontario in mid-October.  Figure 2 does a better job of separating out these two components of the fourth wave with the current upswing starting at about day 640 which corresponds to the last week of October – several days before Halloween.


Similar charts are presented for Thunder Bay District in Figures 3 and 4.  Figure 3 reveals that over the course of nearly two years, Thunder Bay only had one very long wave that started circa Day 250 (around the first week of October 2020) and then rose over the course of the next four months to peak during the first week of March 2021 before starting a gradual decline to the current daily levels.  However, Thunder Day district also appears to be in the process of seeing a gradual upswing as Figure 4 illustrates with numbers over the last few weeks distinctly higher than they were in August. Still, over the course of the long haul, Ontario has had four distinct waves while Thunder Bay's relative isolation in the end resulted in only one.


So, going into the Christmas season and the winter, the current trends show there is likely to be a continued increase in cases though we should hopefully be spared the surges of previous waves provided vaccine provided immunity does not wane, school children begin to be vaccinated in large numbers, and booster shots make their way into the older population in a timely manner.  Many recent cases are in the school age population and given that COVID-19 is generally not very severe in the very young, that has also spared hospital ICU capacity.  So, for the time being this is what the pandemic looks like – ever present and persistent- but likely to stay in abeyance provided new and more lethal variants do not emerge.

Thursday, 4 November 2021

City Council's One Percent Solution


After projecting a positive variance of $3 million for the 2021 budget year, it would appear the final tally for a budget surplus for 2021 will be coming in at $5.6 million.  Thunder Bay will have its seventh consecutive positive budget variance making for accumulated variances of $26 million over seven years.  Much of the savings will come from lower-than-expected COVID costs for which the city has received a lot of federal and provincial support.  While Thunder Bay budgeted for a $7.2 million cost from the COVID-19 pandemic this year, a third quarter variance report now forecasts COVID costs at $5.5 million, based on trends to the end of September.


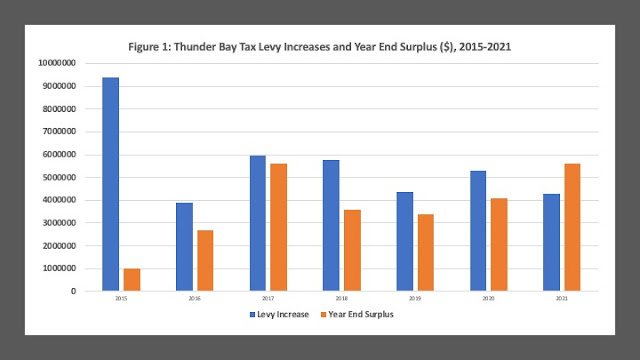
Figure 1 plots the annual tax levy increase since 2015 against the corresponding surplus at year end.  For example, in 2015, the tax levy increase was $9.4 million – a 5.7 percent increase on a $164.7 million levy the year previous. The year’s end saw a positive variance of about $1 million which on $174 million tax levy was just over one-half of one percent.  Since 2015, however the size of the surplus has increased substantially, often coming close to matching the size of the tax levy increase that year.  In 2017 for example, the levy increase was $5.96 million – a 3.3 percent increase – but the year-end surplus came in at $5.6 million – almost 95 percent of the value of the original levy. For 2021, we have a first – a surplus of $5.6 million – which is larger than the original levy increase of $4.3 million. 


The surplus is generally put into city reserve funds which in general is a prudent strategy.  However, the fact that there are consistent surpluses means that there has been a consistent practice of overestimating expenditures and underestimating revenues.  Given that the tax increases have been much larger than what was required given the ultimate need, one can only conclude that this has become a sort of forced savings strategy.  The City of Thunder Bay raises the tax levy more than is needed with the goal of boosting its reserves for whatever long-term plans they might have for spending from those reserves. 


Thunder Bay has been raising taxes consistently more than it has needed to for some time now and that money comes out of the pockets of its residents.  During the pandemic, while other cities were trying to keep tax increases at zero, Thunder Bay managed an increase of 2.7 percent in 2020 and 2.1 percent in 2021.  Accompanied by generous provincial and federal COVID-19 support, the result has been large and growing surpluses.


One could pose the following counterfactual.  If Thunder Bay had been able to anticipate the surplus each year and implement a tax increase incorporating the surplus and balancing the budget, what would have the alternate tax levy increase have been? Figure 2 plots the actual percentage tax levy increase since 2015 and the alternate increases.  In 2017, for example, the budget could have been balanced with an increase of 0.2 percent but instead there was an increase of 3.3 percent.  Last year – 2020 - saw an increase of 2.7 percent but all that was needed is an increase of 0.6 percent.  Meanwhile, if 2021 continues on this track, it means that rather than a 2.1 percent levy increase, there could have been a levy reduction of nearly 1 percent.


 So, here is the thing.  Over the period 2015 to 2021 the actual tax levy increase has averaged 3.1 percent.  The average levy increase required to meet expenditures has been 1.1 percent.  City council for 2022 has directed administration to prepare a municipal budget with a 2.25 percent levy increase.  I would suggest that based on the City’s financial performance to date that they could easily cut that in half.  One percent sounds about right.