Northern Economist 2.0

Thursday, 1 April 2021

Yes Councillor! Municipal Costs in Thunder Bay Are Higher But Let Us Explain...


Thunder Bay spends one of the highest per capita amounts of major Ontario cities.  Moreover, it has chosen to prioritize three things: general government, police, and fire services.  Indeed, of 27 major Ontario municipalities, Thunder Bay spends the most per capita of its tax levy supported operating budget on these three things as illustrated in Figure 1.  Indeed, nearly 60 percent of Thunder Bay’s operating tax levy is spent on these three items.  Naturally, what it also implies is that there is less to spend on everything else and in fact, while Thunder Bay spends one of the highest amounts per capita and the most on general government, police and fire, it actually spends a lot less on everything else compared to these other cities.


Now, if I were a Thunder Bay city administrator tasked with addressing  the above statements in response to a query by a municipal councillor, I would naturally respond by saying that yes indeed, councillor, the numbers are higher but they really do not tell the entire story because in Thunder Bay ‘general government’ is a broader and more encompassing term of innumerable complexities compared to other municipalities that are located in more densely populated and less policy challenged parts of the province.  As well, I might even venture that perhaps Thunder Bay includes costs in general government that other cities do not as part of its own diverse and unique circumstances reflecting its special position as a northern municipality with serious social and economic issues of the utmost seriousness that in the fullness of time must be very seriously addressed.


Of course, that begs the question as to why the composition of the numbers that have been used in the above comparisons - which come from the BMA Municipal Report – would be so different given that they are supposed to be constructed and provided to allow for some type of standardized comparisons?  Needless to say, at this point as a City Administrator I would probably respectfully argue that these are complex questions beyond the pale of the councillor's valuable time given their plethora of pressing duties and ultimately requiring further study by knowledgeable and qualified individuals with intimate knowledge of local realities.  If pressed for details on the composition of general government spending in Thunder Bay, I would certainly take the request into consideration and get back at some future date as providing the data requires substantial resource expenditures given its all-encompassing complexity.


So, we are left to our own devices. In addressing the higher costs of certain municipal expenditures in Thunder Bay, perhaps we can focus on something more specific and better defined rather than something as amorphous as ‘general government’.  Why not policing or fire?  Figure 2 provides a first ranking of policing by presenting the number of police officers per 100,000 population obtained from Statistics Canada for 15 major Ontario centres in 2019 (with Hamilton only available up to 2017).  It turns out that Thunder Bay does not have the highest numbers of officers per capita of these 15 cities. It is tied with Windsor at about 205 officers per capita.  


No doubt there are extenuating circumstances as to why Windsor has so many officers. -perhaps there is more crime in border cities with a lot of casinos.  Thunder Bay is a border city – well almost – but it is very close to the border.  And we have a casino too.  Lo and behold, Thunder Bay, also has a lot of crime so we must be like Windsor after all.   And as for Ottawa which has so many fewer officers, it is the seat of government and also has innumerable other security forces such as our military and the RCMP which allow the municipality to spend less on policing.  If only Thunder Bay could be blessed with a Canadian Forces base or perhaps a branch office of CSIS, we would be a more secure place.  Moreover, Ottawa is inhabited largely by peaceful civil servants and government sector workers so it must be a more law-abiding town, right?  But wait, Thunder Bay has over 30 percent of its employment in the broader public sector – not as high as Ottawa but still very high by provincial standards - so why no spillover into crime statistics?


Of course, the number of officers may be correlated with cost but perhaps policing resources in Thunder Bay are abundant because we pay officers less and therefore, we are getting more bang for our buck?  Well, Figure 3 looks at the cost of policing for these same 15 major Ontario centres using cost measures from the BMA 2020 Municipal Report.  The cost measure is what is available – the cost of policing in terms of dollars spent on policing per $100,000 of tax assessment.  Using this measure, Thunder Bay comes in third place – behind Windsor and Timmins – at $439 per $100,000 of taxable assessment.  Put another way, in Thunder Bay, if you have a $250,000 home, you are probably paying close to $4,000 in property taxes on that home.  Of that amount, $1098 (2.5 times 439) is going to pay your share of police services – about 28 percent of your taxes.  In other words, in Thunder Bay, one-quarter of the tax levy goes to provide policing services. A good question is how this might compare to other cities but good luck conveniently getting the data for that.


Are there good reasons why we spend a lot on policing in Thunder Bay. Yes, councillor, maybe.  Or, maybe not. However, relying on the City of Thunder Bay to make the case rather than a more impartial source probably results in a predetermined answer. It still does not change the fact that we are at the top of the list both in terms of policing numbers per capita and in costs as measured by the publicly available data.  Does that mean we need do nothing about it? No. We can always do better.  That does not mean spending more on policing, it means finding ways to achieve current outcomes with less money.

Friday, 26 March 2021

Ontario's Partial Post-Pandemic Employment Rebound


Like just about everywhere else in the world, Ontario was hit hard by the job losses that resulted from the assorted lock-downs and coronavirus containment strategies of the COVID-19 pandemic.  Figure 1 presents seasonally adjusted monthly employment data from Statistics Canada for Ontario from 2006 to the present.  From February 2020 to June 2020, Ontario lost 990,000 jobs or 13.2 percent of its employment. These losses, however, were not uniform in size across the major urban centers of the province.  


Figure 2 plots the ranked employment losses from the start of the pandemic in February when the monthly employment losses began to June 2020 when the rebound begins and going  from worst to best performers.  Hardest hit with a 25 percent drop in employment was Belleville, followed by Windsor at 18 percent and then Thunder Bay at 16 percent. The three lightest hit cities were Ottawa with a 10 percent drop, Brantford at 7 percent and Guelph at just below 7 percent.  


With the exception of Barrie, all of these cities have managed to bounce back since June as Figure 3 illustrates.  The largest rebound as was the largest drop happened in Belleville.  Belleville saw employment rise 25 percent and was followed by London at 16 percent and Kingston at 15 percent.  The smallest rebounds aside from Barrie which appears to have continued to shrink were Guelph at 6 percent, Sudbury at 5 percent and St. Catharines-Niagara at 4.5 percent.  


Despite the rebound, only two of these urban areas have managed to recover enough employment to be at more employment than the start of the pandemic drop in February – Kingston and London – though not by much.  Others still have a gap and it varies substantially.  Ontario as a whole is currently at about 96 percent of its February 2020 level of employment. Figure 4 ranks the cities by their employment in February 2021 as a percentage share of their February 2020 employment.  Thunder Bay, Windsor, Sudbury, St. Catharines-Niagara and Barrie have recovered the least.  Thunder Bay is only at 93 percent of its pre pandemic level of employment followed by Windsor at 92 percent, Sudbury at 91 percent, St. Catharines at 88 percent and Barrie at 84 percent.  On the other hand, after Kingston and London, Brantford and Guelph are at just over 99 percent of pre-pandemic employment.  


Overall, Ontario has seen a remarkable 12 months with massive employment losses and a rather large rebound, but which only puts it back at about 2018 levels in terms of employment.  There is still  a lot of recovery to go.

Thursday, 25 March 2021

Ontario’s Spring 2021 Budget: The Future Looks Bleak for Health Care


Well, the Ontario 2021 budget came out yesterday and it is rightly preoccupied with the COVID-19 pandemic.  COVID-19 funding and support will continue to flow for the next couple of years and along with the $20.1 billion of support in 2020-21, there will be an additional $6.7 billion and $2.8 billion in the subsequent two years before the government anticipates a return to  some type of normalcy. 


For 2020-21, the deficit is estimated at $38.5 billion and for the 2021-22 fiscal year it is expected to be $33.1 billion and then $27.7 billion the year after.   However, the government has actually proposed a fiscal plan for getting to a balanced budget –but it is very long-term.  Deficits are projected to continue falling until 2029-30 when there will finally be a $900 million-dollar surplus – assuming the projections for economic growth and spending take shape and indeed, that the world should last so long.


Figure 1 presents the numbers for total revenues, total expenditures and the deficit out to 2029-30 but also puts them into historical perspective.  The numbers are from the Fiscal Reference Tables for the 1990 to 2019 period with GDP numbers from Statistics Canada and the Ontario 2021 Budget for the years after up until 2029. If these projections come to pass, Ontario will have run since 2008-09 a total of 21 budget deficits before reaching “balance” in 2029-30 resulting in accumulated deficits of $284.9 billion.  By 2029, Ontario will be taking in $210.1 billion in revenues – up 35 percent from 2019-20 – and then spending $209.1 billion- up 27% from the same reference point. The net debt that will rise from $397.2 billion in 2020-21 to reach an astounding $585.3 billion by 2029-30 and a net debt to GDP ratio that will remain just short of 50 percent for an entire decade.  Moreover, as the stock of debt rises, so does debt service and its rises from $12.5 billion in 2021-21 to $20.6 billion in 2029-30 – an increase of 65 percent.


It indeed will be the roaring twenties when it comes to the growth of net debt and debt service costs in Ontario.  Ontario’s fastest growing expenditure category from 2021 to 2920 will be debt service costs.  The average annual growth rate for nominal health spending is expected to be 2.6 percent.  Education will grow at an annual average of 1.1 percent, post-secondary education at 1.2 percent, children and social justice comes in at 0.6 percent annually (so much for children as the future) and interest on the debt at 5.1 percent. 


The results for health care spending are particularly at odds with the Ford government’s commitment to increasing hospital capacity and long-term care.  While base health spending – that is not including the short-term COVID-19 bump -  is projected to grow at 2.6 percent a year, it means that given population growth of about 1 percent annually and inflation of 2 percent, real per capita spending on health will at best stay flat and even decline somewhat.  


This will come after nearly a decade of relatively flat real per capita provincial government health spending in Ontario and it seems to conflict with government claims it is going to boost health and long-term care. We do seem to be heading for a rather dire fiscal future in which the budget is not going to be balanced, the public finances are not sustainable and spending on important things like health will actually decline in real per capita terms.  It is indeed a rather bleak looking future for health care in Ontario despite all the government spin.

Wednesday, 24 March 2021

What Ontario Needs to Do In Today's Budget


The Ford government will table Ontario’s 2021 budget on March 24, at a time when there’s an overflowing plate of pressing policy issues. Along with continuing the fight against COVID, sorting the ongoing fallout in long-term care, promoting economic recovery and addressing solvency issues in the university sector, there’s also the matter of the province’s finances.

Indeed, there are probably not enough hours in a day for the government to deal with the onslaught of policy issues and their cost-benefit calculations. So, one must prioritize.

First is COVID-19, which is seeing a renewed rise in cases. Given the public fatigue with restrictions, it’s now a race between the virus and vaccinations. The vaccination process is ramping up, but speed is the question. To vaccinate 14 million Ontario residents (with just one dose) by the end of June requires dispensing nearly one million shots a week effective immediately. Ontario usually orders enough flu shots to vaccinate 30 to 40 per cent of its population every year with five to six million flu shots dispensed in just a few months. As such, it should be well within the province's technical ability to effectively double that rate in an emergency. Indeed, Premier Ford has affirmed the province’s ability to administer 4.8 million vaccine shots a month. Yet it’s currently running at about a quarter of that rate—or about 1.2 million shots a month—because in the end, you still need a consistent and abundant vaccine supply.

Second, there’s the economic recovery, both short and long-term. According to the Financial Accountability Office of Ontario (FAO), the broad-based lockdowns have resulted in a 5.9 per cent drop in Ontario real GDP in 2020, the largest annual decline in economic output on record. However, assuming vaccines are distributed to the general population over the course of 2021 and government lockdown restrictions are progressively eased (and this third wave does not spiral out of control), Ontario’s economy should rebound 
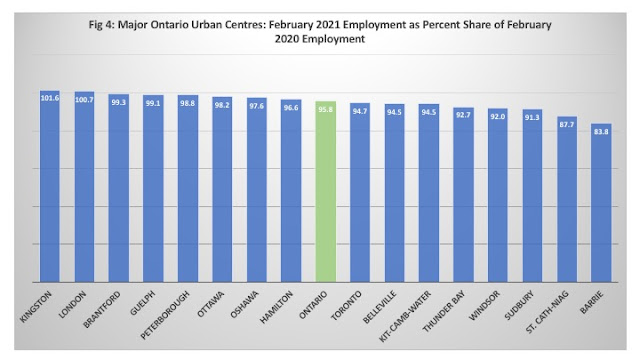
strongly. The latest labour force numbers from Statistics Canada suggest employment is rebounding, with 100,000 jobs created in February and the unemployment rate falling a full percentage point to 9.2 per cent.

However, most of Ontario’s February employment gains were in part-time work with notable increases in accommodation, food and retail trade. These are fragile gains for an economy that seems to always be teetering on the brink of yet another lockdown. Moreover, the long-term picture is more ambiguous. On the one hand, the U.S. economy is recovering robustly, and given Ontario’s integration of exports and production with American business and supply chains, one might expect smooth and sustained growth prospects once the pandemic is behind us. The province’s northern resource sector will certainly benefit from the uptick in commodity prices for minerals and lumber.

At the same time, the Biden administration is sending mixed signals on its degree of economic engagement with its traditional partners. One of President Biden’s first actions was an executive order imposing strict new made-in-America rules for U.S. government spending with limited exceptions, meaning the spillover from the U.S $1.9 trillion stimulus program could cut Canadian companies out of the procurement process.

And third and finally, there’s the elephant at the cabinet table—Ontario’s fiscal picture. According to figures released in the fall, the 2020-21 fiscal year was expected to see a $38.5 billion budget deficit followed by $33.1 billion in 2021-22 and $26.2 billion in 2022-23. This would see Ontario’s net debt climb to $472.9 billion from $335.2 billion in 2019-20. While one could opine that the scale of deficits and pace of debt accumulation is mainly a function of the short-term rise in spending needed to fight the pandemic and the short-term collapse in revenue, the government must provide some plan to balance the budget over the medium term. Next week’s budget is a good place to start.

In a sense, these three policy problems are all related. End the pandemic and the economy will recover. Once the economy recovers and growth resumes, government revenues will recover and it’s reasonable to expect the deficit to shrink. The problem is, this has been the standard way to deal with Ontario’s budgetary shortfalls—hope you can grow your way out of it. One might term it faith-based fiscal planning, and its track record has not been successful.

According to figures from Finances of the Nation, the last time Ontario’s budget yielded even a small surplus was in 2000-01. Since then, there’s been a budget deficit every single year with nominal net debt rising from roughly $130 billion to reach nearly $400 billion by 2020-21. Apparently, there’s never a good time to deal with Ontario’s long-term structural gap between revenues and spending. If its not a recession, it’s a global financial crisis. If it’s not a financial crisis, it’s weak economic growth. If it’s not weak growth, it’s a need to invest in the future given low interest rates. And now, with a pandemic, one does not have to be very imaginative to see where this is going.

In the absence of a concerted effort to address its structural fiscal gap, the pandemic will pass but Ontario’s net debt will continue to grow.

This originally appeared in the Fraser Institute Blog, March 22nd, 2021.

Tuesday, 23 March 2021

Paying Municipal Councillors

 Last evening's Thunder Bay City Council Meeting was notable for a number of items - the shelving of the Multipurpose Turf Facility tender but not the project, the lack of a major and substantive discussion on the city's growing tax arrears problem - but especially for the operatic self-flagellation of councilors as they reluctantly approved their pay increase in a scene oddly reminiscent of the coronation scene in Mussorgsky's Boris Gudonov.  The councilors finally convinced themselves to vote in favor of giving  themselves a pay increase that in the end will add about $3000 to a $200 million 2021 operating budget.  The crowning moment was the vote when 12 councilors voted in favor, but the Mayor in a grand gesture of fiscal rectitude and atonement for the increase in costs of the Turf Facility project to $46 million, voted no.  It was all really patently quite silly on a number of levels and perfect evidence that in the end, you get what you pay for even with municipal councilors.  

A couple of points.  First, at a base salary of $31,852 the salary paid to a City Councilor suggests that the job is really not very important and is something best taken up by people who either  have time on their hands, are desperate to supplement their income, perhaps are looking to make connections for their own private business interests, or are political careerists looking for a stepping stone to higher public office.  The purpose of being on Thunder Bay City Council should not be as a recruiting farm team for local political parties seeking provincial and federal candidates.

It is not that running for office is about the money but public office does involve a sacrifice of time, career and family and the current compensation is insufficient given the opportunity cost of what you need to give up to do the job effectively.  This means that in the end, while public service and commitment should be the main drivers of running for office, it is difficult to attract the best candidates especially given the character assassination involved that passes for a political campaign these days. If anything, the problem with Thunder Bay City Council is that for a city of just over 100,000 and twelve Councilors plus a Mayor, there is too much quantity and not enough quality.  A smaller council of eight councilors plus a Mayor would allow for compensation that better reflects the responsibility of the position and attract the caliber of person needed to make decisions on a municipal corporate budget of hundreds of millions of dollars.

Second, is the interesting message that City Administration has sent regarding what they recommend as an appropriate increase for councilors.  As it stands, the City Administration basically recommended that the raise should be tied to half the rate of inflation in the City for 2020 which was calculated at 0.55% based on an inflation rate of 1.1%. It is interesting that when putting forth budget proposals to the councilors, this same rule is not adhered to by City administration as historically the initial budgets proposed  have been well above the rate of inflation in the Thunder Bay.  Indeed, municipal employee pay increases in Ontario have even managed an exemption from current provincial legislation limiting public sector salary increases to 1 percent annually. In the end, why pay more to attract better candidates? City Administration in some respects has a vested interest in keeping the quality of city councilors where it is, as their lives would definitely become much more difficult if the quality of councilors increased.  

It really is a classic case of the bureaucracy completely capturing the legislative and policy process.  No doubt, the local community cable channel borrowing from the BBC would be well advised to produce and air a sitcom called Yes, Councillor.  The first episode could feature amusing discussions on staffing and pay increases between city managers and the councilors. On the other hand, this pretty much already occurs every Monday evening on the local cable channel.  We should look into getting Netflix to air the meetings -  as a revenue generating reality show.