Northern Economist 2.0

Monday, 1 October 2018

Municipal Election 2018: Spending in Northern Ontario Cities

We are about three weeks out from the municipal election and across northern Ontario, voters will be looking for information on which to base their decisions.  Inevitably, some of that decision making will be based on comparisons of how municipal ratepayers feel they fare relative to other similarly sized cities.  Taxes are often the basis of such comparisons, but municipal property taxes are a function of what municipalities spend so another basis for comparison is expenditure.

Among the many municipal statistics provided in the annual BMA Municipal Study is fairly detailed comparisons of spending on municipal services.  The aggregate number on which any comparison can begin is what is known as the net municipal levy per capita (NMLPC).  This is an estimate of what the spending need for a municipality is to provide its services – as determined by the city administration and elected council – and ultimately is what feeds into required tax revenues.

Now the BMA reports are quite explicit in qualifying what a NMLPC measure can and cannot do and what its limitations are.  Spending per capita can vary as a result of different service levels as well as type of service.  There are also demographic and socio-economic reasons why spending may vary across cities and per capita spending is simply an aggregate and not an indicator of value for money.  However, the BMA maintains that changes in per capita spending reflects changes in total spending relative to population and “Increasing per capita expenditures may indicate that the cost of providing services is outstripping the community’s ability to pay, especially if spending is increasing faster than the resident’s collective personal income.”

So, the accompanying figure 1 shows the NMLPC for the five major northern Ontario cities for the years 2007 and 2017. In 2007, the NMLPC was highest in Thunder Bay at $1,216 and lowest in Sudbury at $1,041.  By 2017, spending was highest in Timmins at $1,651 (with Thunder Bay second at $1,641) and lowest in Sault Ste. Marie at $1,434.  If one compares the growth rates in the per levy, they were actually highest in Timmins at an average of 4.6 percent annually and lowest in Thunder Bay at 3.5 percent annually.
 

However, in all of these cities, per capita spending grew faster than population suggesting that there was a deepening of per capita spending.  That could be the result of a desire to improve services or it can reflect a weakening economic base and the spreading of costs across fewer people.  Over the last ten years, population actually shrank in four out of five of these cities – the exception being Sudbury which saw its population rise 2.3 percent over the last ten years.  Yet even in Sudbury, spending rose faster than population given t per capita expenditure is growing.
 

More interesting, is figure 2 which plots the average annual growth rates of the net municipal levy per capita (from 2007 to 2017) and average household income (2010 to 2017). In all of these cities, per capita municipal spending has been rising faster than average household income.  So, it would appear that in all of these cities, municipal spending has generally risen faster than both population and income.  This suggests that recent years have seen municipal spending outstrip the resource base in these communities as measured by population and income.  Indeed, sustainability for sub-national governments has been outlined as a key concern in a recent federal PBO reportMunicipal ratepayers in all five of these cities should be asking how candidates for their ideas on how they plan to address the fiscal sustainability of their cities?

Sunday, 23 September 2018

Thunder Bay Municipal Election Issues: Crime


The October 22nd municipal election in Thunder Bay should start heating up as we move into the final four weeks of the campaign.  There are indeed quite a few campaign signs sprouting up and in a sign that the race has intensified there is even some campaign sign vandalism.  On the one hand, having a large number of candidates should make for an interesting race but on the other hand with so many candidates, any real debate is going to be unwieldy to manage and I expect the final outcomes will largely favour incumbents with name recognition.  This means that despite what seems to be an enormous appetite for change, there will be very little come the day after October 22nd.  Still, one would be remiss on not trying to highlight some of the issues.

In my August 8th post, I did a brief summary of what the main issue categories  in the coming election should be and today I want to focus on one specific issue in particular – crime in Thunder Bay.  There is a lot of social media discussion as well as media reporting on crime in Thunder Bay and also a lot of informal chatting among people and concerns have been expressed about what seems to be substantial drug driven gang activity.  There are also statistics that measure crime and Statistics Canada has reported recently that Thunder Bay in 2017 leads Canadian cities in their murder rate for a second year in a row.

The police response to this news by the Acting Police Chief acknowledged the high homicide rate but the media report also noted that “Despite having the highest murder rate per capita for Canadian metropolitan areas and the second highest in terms of severe crimes, the overall crime rate in the city of Thunder Bay is down.”  The response of the Acting Chief accentuated the positive with the comment that “"Those numbers are great to see," Hauth said. "I think it’s continued work internally and working with outside agencies. We’ve made great strides in terms of doing things in the community."”

So what do the numbers look like?  Well, there are specific traditional crime rates for assorted offenses and incidents with the overall crime rate in terms of incidents per 100,000 of population actually down in 2017.  There is also what is known as the crime severity index which uses a weighting method to account for both the number of crimes and their severity.  There sometimes is confusion in media reports between the crime rate and the crime severity index and the confusion mounts if one goes up while another goes down.  However, if one looks at longer term trends, both sets of number tell a similar story.  Crime overall has come down in Thunder Bay over the last 15 years, but certain types of crime have actually gone up.  In particular, violent crime and homicides in particular.

In the case of Thunder Bay, the overall crime rate in 2017 declined from 6,771 incidents per 100,000 in 2016 to 6,576 incidents per 100,000 – a drop of 2.9 percent.  Since 1998, the overall crime rate in Thunder Bay has declined from 10,911 incidents per 100,000 to the current 6,576.  However, the homicide rate has exhibited an opposite trend going from 2.6 homicides per 100,000 in 1998 to 6.04 per 100,000 
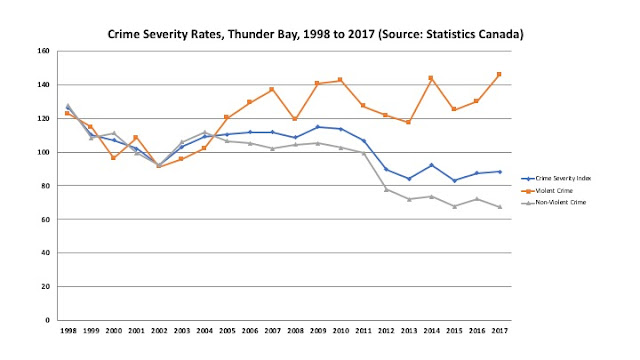
in 2017.  When it comes to crime severity, the accompany figure sums it all up quite nicely. 

 
The overall crime severity rate (with everything relative to a base of 100) was quite stable from 1998 to about 2010 and then fell and has stabilized since 2012.  For 2017, the crime severity index is up from 87.48 to 88.25- an increase of about 1 percent.  The decline in the crime rate however is being driven by the fall in the rates of non-violent crime.  What is more alarming is the increase in violent crime which in 2017 is the highest it has been since 1998. 

We can argue that crime rates are down overall, but the concern of the public is that violent incidents – homicides, assaults, etc… seem to be on the way up.  Drug possession or a vehicle theft is a problem, but the public is more perturbed by gang and drug related violence and homicides. The issue facing municipal candidates is what solutions can be offered to deal with the rising rates of violent crime in Thunder Bay?  And to help frame the discussion in a simple manner amenable to most municipal candidates, should solutions involve more resources to police or more effective use of existing resources and what should those solutions be?

Tuesday, 18 September 2018

Wealth and Debt Accumulation in Early Financial Markets Stockholm Conference

I had the privilege of attending along with nearly 50 other participants  the "Wealth and Debt Accumulation in Early Financial Markets" conference that was held at the Stockholm School of Economics September 13-14.  The conference was organized by Elise Dermineur (Umea University/Stockholm School of Economics) and Håkan Lindgren (Stockholm School of Economics) who are both affiliated with the EHFF Institute for Economics and Business History Research at the Stockholm School. The conference united researchers working with a variety of historic sources of data on credit, wealth and debt but with very strong representation from probate inventories - an area that I have spent nearly thirty years working with.  


Conference attendees were welcomed by Lars Strannegard, the President of the Stockholm School of Economcs and keynote addresses were by Carole Shammas (USC)  titled "Why Did Finance Professionalize" and Phil Hoffman (CIT) titled "Dark Matter Credit".  Along with paper sessions, there were also two round tables.  On the Thursday, there was "The 'Market' as a Concept" which was moderated by Kristina Lilja (Uppsala) and the Friday afternoon saw "Women and Early Financial Markets" moderated by Ann McCants (MIT).  The conference wrapped by with a discussion and plans for future collaborative international research moderated by Anders Perlinge (Stockholm School of Economics).  

It was a lively, well organized and well attended conference with a lot of participation and interaction.  It was frankly rewarding to see so many researchers working in areas similar or parallel to mine and with similar types of data.  The strong resource base provided by Swedish probate records was particularly impressive and it is due to the hard work and initiative of Swedish researchers as well as generous research support.  The research into probate inventories as well as support for the conference comes from the Handelsbanken Research Foundation, the Wallenburg Economic History Foundation, the Marcus Wallenburg Foundation for International Scientific Collaboration, the Jacob Wallenburg Foundation, the Ebbe Kock Foundation, the Gunvar and Josef Aner Foundation, and the Swedish Foundation for Humanities and Social Sciences.  

Let me conclude with a warm thank you to our hosts and research supporters or as they would say in Sweden - tack så mycket - and end with a few pictures from the conference.


Sunday, 9 September 2018

What's Wrong With This Picture?


Well, Northern Economist is in Northern Europe on the way to a conference in Stockholm later this week. It is a lovely Sunday afternoon here with families out strolling enjoying the mild September weather in a major European city – Copenhagen to be precise.  The number of people out today in Copenhagen has been augmented by the holding of a Every Step Counts walk for the environment and the paths along the canals are packed with walkers as well as tourists.

What is also interesting about the canals is scenes like the one below:


Numerous boats are out with groups of people sitting around a table enjoying snacks and the passing scenery as they boat along.  Notice anything interesting about this picture?  Well, it turns out that Copenhagen seems to be a lot like Vegas when it comes to open carry alcohol.  Not only can you walk the streets while enjoying a beer but you can drive a boat while partaking in wine and beer also.

It is very important to drink responsibly but I do not think that responsible drinking is incompatible with drinking in public.  You certainly could not get away with drinking and boating in Canada but one wonders how it is that Denmark - and indeed much of Europe - can handle this but we in Canada cannot despite our socially liberal pretensions.  The canals in Copenhagen are quite crowded and yet here we have groups of people enjoying picnic lunches and wine while boating along. I won’t even get into a discussion of why Denmark has tons of people on bikes and yet no one seems to be wearing a helmet.

Perhaps Danes and Europeans in general are more mature and able to take more personal responsibility when it comes to personal safety?  It is certainly something I will think about some more over the next few days. However, in the absence of truly innovative change we in Canada will just have to bear with things the way we are.


Monday, 27 August 2018

Northern Ontario Economic Forecasts: Conference Board Forecasts Slower Growth for Thunder Bay and Sudbury


The Conference Board of Canada recently put out its Summer 2018 Metropolitan Outlooks for Thunder Bay and Greater Sudbury.  Greater Sudbury’s real GDP growth is expected to be 1.2 percent in 2018 and 1.1 percent in 2019 while its employment growth will be  -0.4 per cent in 2018 and rise 1.1 percent in 2019.  Meanwhile, Sudbury’s unemployment rate will rise from 6.7 per cent in 2017 to 7.0 per cent for 2018, before falling to 6.6 per cent next year.  Thunder Bay’s real GDP is expected to grow 1.2 percent in 2018 and 1 percent in 2019 with employment expected to rise 2.2 percent in 2018 but fall -0.7 percent in 2019.  The unemployment rate is expected to be lower than Sudbury’s at 5.1 percent in 2018 compared to 5.6 percent in 2017 but is expected to be 5.4 percent in 2019.

As the accompanying figures show, Thunder Bay and Sudbury have been growing more slowly and are expected to grow more slowly than Canada or Ontario.  Sudbury’s economy has been described as “unsettled” with a steady string of employment losses over the last few years.  Its primary hope is the current rebound in nickel prices given the employment losses have been hitting its mining sector.  


Thunder Bay saw a very good employment growth performance in 2017 that basically helped recover from the 3 percent drop in 2015 – its economy currently can be characterized as “moderate expansion.”  What seems to be driving things at the moment in Thunder Bay s a stronger construction sector with numerous small non-residential projects as residential demand is weak.  Indeed, the housing forecast for 2018 is 155 units – the lowest number of starts in 15 years.  As well, there has been some upturn in manufacturing and transportation.  

So, moving forward.  It appears that both Canada and Ontario are expected to see slower rates of economic growth moving towards 2020 with Thunder Bay and Sudbury even lower.  In terms of employment growth, Sudbury’s recent string of low employment growth is expected to end in 2019 if nickel prices continue their rebound while Thunder Bay in 2019 is expected to see negative employment growth again before resuming growth.  Thunder Bay’s economy has been performing marginally better than Sudbury’s recently as it is somewhat more diversified as in 2017 it had a higher economic structure diversity score of 0.78 compared to Sudbury’s 0.71.