Northern Economist 2.0

Thursday 24 May 2018

Wealth Inequality in the North Atlantic Anglosphere

I have been working on historical wealth and wealth inequality for most of my career and have put together a lot of my thinking and long-term analysis together in one spot - a new book published by Palgrave MacMillan in their Pivot series.  The ebook edition was released several days ago and is available on the Palgrave site.  The hard cover version should be available at the end of June or early July. If you want a short overview of the book, I put together a post for the Palgrave Exploring Economic History Blog that provides a nice summary of the book and some of its main ideas. An excerpt from the blog:

"Before 1750, wealth inequality was higher in the United Kingdom than the United States, but American inequality grew rapidly to match the United Kingdom by mid-nineteenth century. The preindustrial period was marked by lower wealth inequality in both the United States and the United Kingdom. The subsequent era of industrialization is marked in all three Anglosphere countries by rising wealth inequality. Wealth inequality declined in the twentieth century with redistribution away from the top one and ten percent. The decline in wealth inequality halted in the 1970s but with a rebound in American wealth inequality.
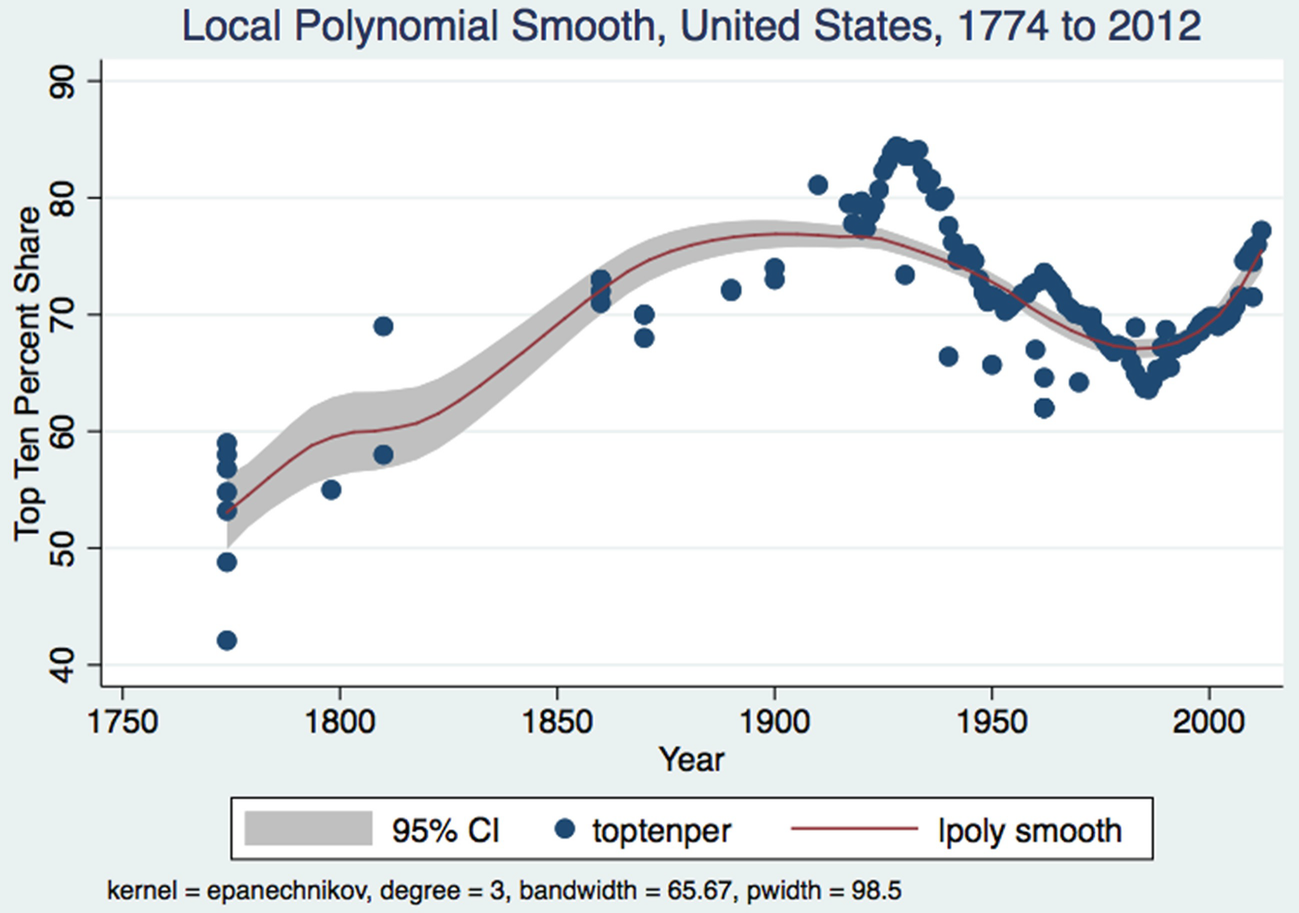
For the United Kingdom, the top 1 percent wealth share rose from an average of 25 percent in the pre-1850 period to 64 percent for the 1850 to 1900 period. More remarkably, the average share of wealth held by the top ten percent of the wealth distribution in the second half of the nineteenth century was just over 90 percent in the United Kingdom, approximately 72 percent in the United States and about 56 percent in Canada. By the early 21st century, Canada and the United Kingdom have their top ten percent with approximately 50 percent of wealth and the United States over 70 percent. Meanwhile the top one percent own just under 20 percent in Canada and the United Kingdom while in the United States the share is closer to 35 percent.
The twentieth century mitigation of wealth inequality correlates with several factors: rates of economic growth closer to the rate of return on capital, increased unionization rates, rising public spending on health and education, larger public sectors, increased home ownership rates, the onset of substantial estate taxation, more progressive income tax systems and in the case of the United Kingdom a housing policy that resulted in the disposition and dispersion of much public housing into private hands. A reduction in the strength of unions as measured by unionization rates as well as the end of estate taxation and less progressive income tax systems is associated with more economic inequality since the 1970s especially combined with lower economic growth rates relative to the return to capital."

You can also get quite a few bits of the book on Google Books if you want a free preview.   The book surveys the evolution of wealth inequality as measured by the Gini Coefficient and the wealth shares of the top 1% and top 10% for Canada, the United States and the United Kingdom.  A quick sample of one of the figures below on the wealth share of the top 1 percent in the United States from 1774 to 2012.

Anyway, it has been great working with Palgrave MacMillan and its staff in putting this project together and seeing it through.  Am glad to see the book out.

Tuesday 28 November 2017

Is Income Inequality Responsible for Thunder Bay's Deteriorating Social Fabric?


Thunder Bay has seen a number of deteriorating social indicators over the last few years which include rising homicide rates, tragic deaths of indigenous people and increasing use of foodbanks.  In looking at the causes of what appear to be increased poverty and violence, one might consider that these trends are the result of rising income inequality.  Income inequality in both Canada and the United States has been rising over the last few decades and researchers have been drawing links between health status and economic inequality as well as the role of inequality in fostering environments conducive to crime and violence.

We had a talk last week at Lakehead University from Martin Daly whose book Killing the Competition makes the case that most homicides are the result of competition between males over goods that are distributed inequitably.  In other words, economic inequality drives the homicide rate and all things given one would expect more unequal societies to have higher crime and homicide rates.  Of course, this raises the question as to what income inequality has been like in Thunder Bay over the last few years and whether it too has trended up.

Needless to say, information on income inequality at a CMA level is not easy to obtain or construct.  However, there is tax filer data available from Statistics Canada obtained from Revenue Canada and it is possible to obtain annual data on median total tax filer incomes for the top 1 percent as well as the bottom 50 percent and construct a ratio. One can construct a simple dispersion or inequality measure by taking the ratio of the median income of the top 1 percent to the median income of the bottom 50 percent on the tax filer total income distribution.  If this ratio goes up over time, it implies increasing income inequality while if it goes down it implies decreasing inequality.

The figure below plots this measure of income inequality for the period 1982 to 2015 for Thunder Bay as well as Greater Sudbury and Ontario.  The results are intriguing.  In 1982, the median total income of the top 1 percent of tax filers in Thunder Bay was 11.9 times that of the median for the bottom 50 percent - $78,200 versus $6,600.  By 2015, the ratio was 12.34 - $236,900 versus $19,200. While income inequality in Thunder Bay has gone up somewhat over time, much of the increase was actually between 1982 and 2001 when the ratio rose from 11.9 to 14.2 and has actually moderated since.


Given that homicide rates in Thunder Bay trended downwards from the early 1980s to 2007 and surged since 2007, there does not seem to be much correlation here.  Moreover, Figure 1 also plots the same inequality measure for Greater Sudbury as well as Ontario as a whole.  Since the late 1990s, Greater Sudbury has actually been more unequal with respect to this inequality measure than Thunder Bay and yet its homicide rate is now lower.  As well, both Thunder Bay and Sudbury have a much more equal distribution of tax filer income than Ontario as a whole which saw its ratio rise from 15.3 in 1982 to peak at 24.9 in 2006 before declining to 22.2 in 2015.

So whatever is disturbing the social fabric of Thunder Bay, income inequality does not appear to be the obvious culprit.