Northern Economist 2.0

Wednesday 24 July 2019

Winston Churchill on Boris Johnson and Brexit


Boris Johnson is now the United Kingdom’s Prime Minister and he has promised to lead the UK out of the European Union by October 31st.  He insists that he can get the European Union to renegotiate the deal even though the Europeans are adamant that the deal negotiated with Teresa May is a take it or leave it proposition.  And if they do not renegotiate, then Johnson is also quite strident that Britain will leave no matter what. As a result, all of this will likely lead to a quite disruptive and erratic next few months as Britain and the EU try to sort out the remainder of Brexit.

Based on these positions, it would appear that the outcome by October 31st is assured – Britain will leave the EU without a deal and sail off on its separate way.  On the other hand, politics is a strange process with a lot of dramatic posturing and one could very well see a new deal emerge.  Or, in what could be a really bizarre turn of events, Britain could very well stay in the EU.  Just as only Nixon could go to China, only Boris could actually keep Britain in the EU.

Much of the discussion of the entire Brexit issue has focused on how chaotic and disruptive it has been and how damaging it is to Britain’s long-term economic and political interests.  However, there may be some reason behind this madness if one is to take the writings of Winston Churchill on foreign policy and extrapolate them to the present.  In his first volume of his epic history of the Second World War, Churchill writes the following:

For four hundred years the foreign policy of England has been to oppose the strongest, most aggressive, most dominating Power on the Continent, and particularly to prevent the Low countries falling into the hands of such a Power…we always took the harder course, joined with the less strong Powers, made a combination among them, and thus defeated and frustrated the Continental military tyrant…Thus we preserved the liberties of Europe, protected the growth of its vivacious and varied society, emerged after four terrible struggles with an ever-growing fame and widening Empire…Here is the wonderful unconscious tradition of British Foreign Policy…Observe that the policy of England takes no account of which nation it is that seeks the overlordship of Europe…it is concerned solely with whoever is the strongest or the potentially dominating tyrant.”

Well, there you have it.  Britain’s elites and particularly those in the Conservative Party appear to be - borrowing from the words of Keynes - the unwitting slaves of some now defunct foreign policy prescription that guided the rise to empire.  Boris Johnson and the Brexiteers do not view the dominant European power as Germany, France or Spain but the grand project of European union and its bureaucracy in Brussels is now the continental tyrant.  By leaving the EU, they see themselves as safeguarding the freedom of Britain and sowing disruption that might lead to the eventual breakup of the EU. 

Of course, one might ask why they joined?  Well, as the European Project was coming together after 1950, it gradually became apparent that it was not falling apart and would continue.  So, being on the inside would have been the best way to keep an eye on things and steer things according to Britain’s interests.  Indeed, being on the inside and “unconsciously” provocative or disruptive could be seen as a potential policy direction given hundreds of years of British foreign policy geared towards keeping Europe apart.  Indeed, French President Charles De Gaulle’s opposition to British membership can be viewed as a realization of this.

Why leave now? Well, the “unconscious” hope was that given the strains the EU was undergoing in the wake of the 2008-09 financial crisis and the migrant crisis, leaving now might be the final push leading to its break-up.  However, the miscalculation here was that it is no longer 1789 or 1913 or 1939.  It is the early 21st century and Britain’s actions have interestingly enough galvanized the Europeans at least for the time being into working harder to stay together.  Boris and the Brexiteers and their “unconscious” policy formulation may backfire big-time.
 

Thursday 6 December 2018

Long Run Economic Performance: Comparing China, the UK and USA


In light of my recent contributions on China’s economic performance which have appeared in The Hill and on the Fraser Institute Blog, I thought it might be useful to provide the figures which underpin the longer-term analysis of their performance.  The data I used is from the Angus Maddison Database – the 2018 update – and the data is summarized in the accompanying Figures 1 and 2.

Figure 1 plots total real GDP from 1820 to 2016 in 2011 USD for the United States, the United Kingdom and China.  In 1820, China had a vastly larger economy than either the US or the UK with a real GDP of $325 billion compared to $69 billion for the UK or $21 billion for the USA.  Indeed, for much of economic history, China has always been the biggest economy in the world as a result of its massive population.  In 1820, China had a population of 381 million people compared to 10 million for the United States and 21 million for the UK.  However, the 19th century was not kind to China and by 1870, China’s economy had shrunk to $270 billion but it was still larger than the United States at $150 billion and the UK at $179 billion. 


Total GDP of both the US and the UK grew quickly as a result of late nineteenth century industrialization with the US matching the UK in 1878 and then pulling ahead in terms of total GDP.  By 1887, the US economy at $306 billion was larger than China at $274 billion and the UK at $228 billion.  By the eve of the First World War in 1913, the US economy at $791 billion was nearly twice the size of both the UK and China at $368 billion and $344 billion respectively. In the period since WWI, the United States grew rapidly and by the mid 1970s was over five times the size of the UK economy and about five times larger than China’s economy.

China had a Communist revolution in 1949 but economic performance in its aftermath - while substantial - was not as robust when compared to the last forty years.  From 1950 to 1975, China real GDP grows from $348 billion to $1.2 trillion – a tripling of output.  However, things for China really take off with the first economic reforms and liberalization of the 1970s and from 1975 to 2016, its economy expands from $1.2 trillion to $17.3 trillion.  Over the 1975 to 2016 period, the US economy expanded from $5.6 trillion to 17.2 trillion while the UK expanded from $1 trillion to $2.5 trillion.

In 2016, China re-assumed its historical role as the world’s largest economy.  Yet, as I pointed out in my oped pieces, this is not the end of the story.  Despite its impressive and rapid economic growth in terms of total output, China still lags when it comes to per capita output. As Figure 2 shows, over the entire 1820 to 2016 period, China has always had a lower per capita GDP than either the UK or the US and the relative gap has not changed all that much despite the rapid growth of the last 40 years.  In 1820, per capita GDP in China was about 26 percent that of the UK and 41 percent that of the USA.  By 1975, its per capita GDP was 7 percent that of the UK and 5 percent that of the United States.  After the robust growth of the post 1975 period, by 2016 per capita Chinese GDP now stands at 34 percent that of the UK and 24 percent that of the US.


So, China has done very well but it still has a long way to go.  Its rapid extensive growth masks the fact that large swaths of its population are still quite poor.  Its economy is showing signs of economic and political fragility given its aging population, large debt levels and economic inequality and this has global implications.  Such fragility is probably a reason for its more authoritarian turn in recent years under President Xi Jinping.  After the rapid growth and improvement in living standards of the last few decades, any economic slowdown may create a politically volatile domestic mix of discontent.

Thursday 24 May 2018

Wealth Inequality in the North Atlantic Anglosphere

I have been working on historical wealth and wealth inequality for most of my career and have put together a lot of my thinking and long-term analysis together in one spot - a new book published by Palgrave MacMillan in their Pivot series.  The ebook edition was released several days ago and is available on the Palgrave site.  The hard cover version should be available at the end of June or early July. If you want a short overview of the book, I put together a post for the Palgrave Exploring Economic History Blog that provides a nice summary of the book and some of its main ideas. An excerpt from the blog:

"Before 1750, wealth inequality was higher in the United Kingdom than the United States, but American inequality grew rapidly to match the United Kingdom by mid-nineteenth century. The preindustrial period was marked by lower wealth inequality in both the United States and the United Kingdom. The subsequent era of industrialization is marked in all three Anglosphere countries by rising wealth inequality. Wealth inequality declined in the twentieth century with redistribution away from the top one and ten percent. The decline in wealth inequality halted in the 1970s but with a rebound in American wealth inequality.
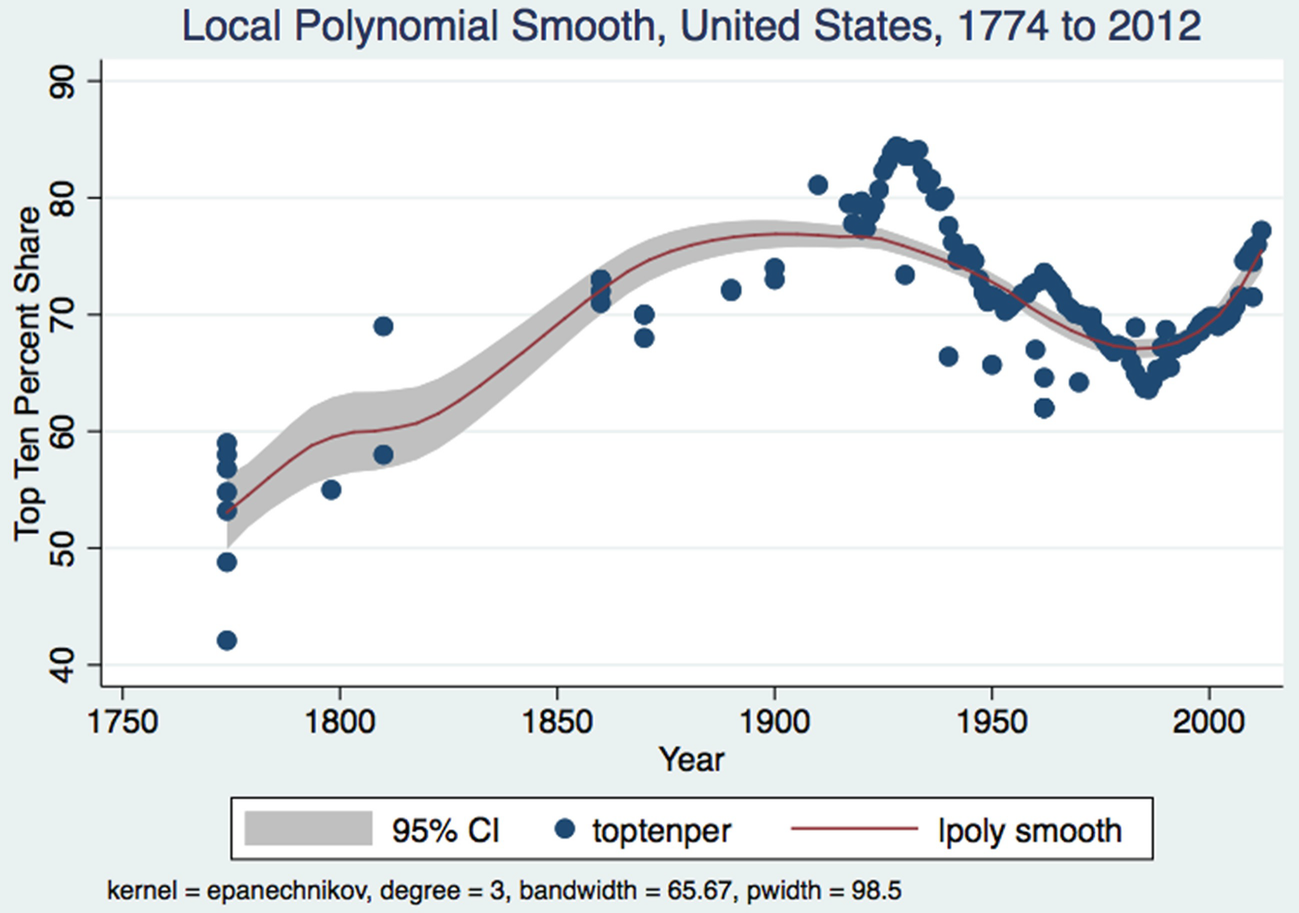
For the United Kingdom, the top 1 percent wealth share rose from an average of 25 percent in the pre-1850 period to 64 percent for the 1850 to 1900 period. More remarkably, the average share of wealth held by the top ten percent of the wealth distribution in the second half of the nineteenth century was just over 90 percent in the United Kingdom, approximately 72 percent in the United States and about 56 percent in Canada. By the early 21st century, Canada and the United Kingdom have their top ten percent with approximately 50 percent of wealth and the United States over 70 percent. Meanwhile the top one percent own just under 20 percent in Canada and the United Kingdom while in the United States the share is closer to 35 percent.
The twentieth century mitigation of wealth inequality correlates with several factors: rates of economic growth closer to the rate of return on capital, increased unionization rates, rising public spending on health and education, larger public sectors, increased home ownership rates, the onset of substantial estate taxation, more progressive income tax systems and in the case of the United Kingdom a housing policy that resulted in the disposition and dispersion of much public housing into private hands. A reduction in the strength of unions as measured by unionization rates as well as the end of estate taxation and less progressive income tax systems is associated with more economic inequality since the 1970s especially combined with lower economic growth rates relative to the return to capital."

You can also get quite a few bits of the book on Google Books if you want a free preview.   The book surveys the evolution of wealth inequality as measured by the Gini Coefficient and the wealth shares of the top 1% and top 10% for Canada, the United States and the United Kingdom.  A quick sample of one of the figures below on the wealth share of the top 1 percent in the United States from 1774 to 2012.

Anyway, it has been great working with Palgrave MacMillan and its staff in putting this project together and seeing it through.  Am glad to see the book out.