Northern Economist 2.0

Thursday, 13 February 2020

Thunder Bay's Population Growing

Statistics Canada has just released its population estimates for sub-provincial areas as of July 1, 2019 and it appears that Thunder Bay's population -  while one of the slowest growing of Canada's CMAs - is nevertheless growing.  On July 1st 2019, Thunder Bay's Census Metropolitan Area reported 127,201 people which is an increase over the previous year of 0.7 percent.  Of the 36 major CMAs, Thunder Bay ranked 32nd and its growth rate was larger than the other major northern Ontario city on the list - Sudbury - which came in at 0.4 percent.  Population growth rates ranged from a high of 2.8 percent for Kitchener-Cambridge-Waterloo to a low of -0.1 percent for St. John's with the Canadian CMA average being 1.7 percent.  The accompanying chart presents the population growth rate rankings for all of the CMAs.  So, as far as things demographic go, this is pretty go news.  Thunder Bay is not shrinking.

Sunday, 9 February 2020

A Very Brief Survey of Northern Ontario Economic History


I have been working on an article surveying the economic history of northern Ontario and thought a summary overview draft of where I am going with it would be a worthwhile post. The entire article is going to be much more detailed but this excerpt below provides a pretty good overview of the direction it is going. Enjoy.


 A Very Brief Survey of Northern Ontario Economic History
Livio Di Matteo
 Northern Ontario’s economy began in the 19th century as a booming resource frontier as a result of favourable international market demand for natural resource commodities which were supplemented by government policy initiatives in transportation and protectionism. Export-led growth approaches to development suggest that such a growth process can ultimately expand population and market size leading to self-sustaining economic growth, but Northern Ontario never made that transition and in the latter part of the twentieth century and early twenty first century can be viewed as having undergone arrested development. 
Northern Ontario is a vast region of over 800,000 square kilometers covering about 90 percent of Ontario’s land mass.  While long the home of a substantial and well organized indigenous and First Nation population[1], industrial economic development of northern Ontario under European settlement began in the 19th century as a booming natural resource frontier driven by rising international market demand for natural resource commodities – mainly forest and mineral products – combined with government policy initiatives in transportation infrastructure and economic protectionism via what was known as the Manufacturing Condition.
In defining the region, it is important to note that is geographically, geologically and biologically a distinct region traditionally defined as the area of Ontario north of the French River – Lake Nipissing – Mattawa River system.  It is essentially Precambrian shield made up of some of the oldest rocks in North America and as a result of glaciation scraping its soil consists of shallow soils with some alluvial soil deposits in areas such as the Clay Belt regions and a mainly boreal forest ecology consisting largely of coniferous forest.[2]
In defining the region there is the question of borders as some include the Districts of Muskoka and Parry Sound in northern Ontario – as indeed they are for the purposes of federal and provincial regional development policies – while other might consider them not as the north but the ‘near’ north.[3]  There is also the question of thinking about the north as a region given that it is a very diverse area that in many respects is not one north but ‘many’ norths.[4] 
Geographically, there is the Northwest consisting of the Districts of Thunder Bay, Rainy River and Kenora while the other two-thirds of the region is the Northeast consisting of Cochrane, Timiskaming, Algoma, Sudbury, Nipissing and Manitoulin.  There is also the vast sparely populated area north of 50 which in some respects does not fit into either the northeast or northwest except by government fiat.  And of course, there is a rural remote north of small towns and Indigenous reserves as well as an urban north consisting of the five major cities – Thunder Bay, Sault Ste. Marie, Timmins, Sudbury and North Bay.  And the Northeast is also marked by a strong francophone population component while the region as a whole has a large Indigenous population.
The themes of Northern Ontario’s economic development are three-fold: natural resources, transportation and government.[5]  Northern Ontario’s economic development can easily be discussed within the framework of economic staples – products with a high natural resource content – given the importance of fur, lumber, pulp and paper and mineral products to the north’s economic history. As for transportation, this is a key theme given the importance of the Canadian Pacific (CPR) and Temiskaming and Northern Ontario Railway (TN & O) in providing access to northern Ontario resources in the 19th and early 20th centuries as well as providing the means for them to exit the region to world markets.  Finally, government is important given the federal role in providing transportation infrastructure that accessed and served the North such as the CPR, the Trans-Canada Highway and the St. Lawrence Seaway as well as the Ontario government given its parallel regional development program in the 19th century consisting of the building of the TN & O as well as the protectionist Manufacturing condition and its own agricultural land settlement policy.
Given the importance of natural resources to northern Ontario’s economy, the analytical framework best-suited to outlining the causal relationships of the development process is the Staples Approach or more generally, models of export led development.  The Staples approach sees a region’s natural resource base as the most important determinant of both the pace as well as the patterns of economic growth with the classic exposition provided by Harold Adams Innis who viewed economic development as springing from the interplay between an industrial heartland and a resource reducing hinterland.[6]  In the case of northern Ontario, it can be viewed as a resource hinterland not only to the industrial south but also the rest of the world economy given the international market for its mineral and forest products.  More modern versions of the Staples Approach see economic development as the process of diversification around an export base with the degree of diversification a function of what are termed economic linkages.  These linkages involve producing inputs for the resource export sector or investing in industries that use the output of the export sector as an input as well as the final demand for domestically produced consumer products.[7]   
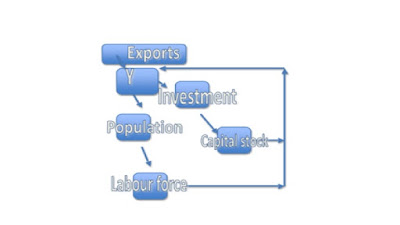
Figure 1 outlines the export led/Staples growth process with an increase in exports generating an increase in the regional economy’s output/income (Y).  The presence of rising income and economic opportunity in the resource sector leads to population increase both via natural increase but also migration into the region.  This leads to an increase in the labour force which feeds back into the generation of income.  As well, the increase in income leads to an increase in regional saving which fuels investment as well as external investment flowing into the region to provide the capital stock needed to expand production of the resource export.  This process continues in a circular fashion until both the income and population become large enough to provide a market for regionally produced goods and services on top of the export sector and it is this expansion of regional manufacturing production as well as services to meet local needs and substitute for imports that becomes the process of diversification.  A failure to grow and develop beyond the initial export industries that powered development can be seen as incomplete or arrested development.[8]

 Figure 1: A Model of Export-Led Growth


 The economic history of northern Ontario can be divided into a number of stages.  They are: 1) Pre-European Settlement to 1867, 2) Boom, Colonialism and European Settlement, 1867 to 1913, 3) Consolidation, Depression and War, 1914 to 1945, 5) Post-War boom, 1946 to 1969 and 6) Arrested Development: Economic Dependency and Decline, 1970 to the Present. 
The economic development of northern Ontario followed a process of export-led growth fueled in particular by the export of mineral and forest products.  International demand and private sector exploitation of the region’s resource abundance starting in the 19th century was also accompanied by investment in transportation networks to bring resources out to market and government policies and initiatives designed to help facilitate development as well as take advantage of the public sector revenue potential of these resources.  Within this framework then, the three major engines of northern Ontario economic development are natural resources, transportation and government. 
During each of northern Ontario’s development periods outlined here, economic growth was most robust during eras where all three engines came together to provide the impetus for economic growth and employment creation.  The most robust economic growth and development occurred during the eras from 1867 to 1913 and 1946 to 1969.  Both of these eras coincided with good global economic conditions which fostered a demand for resource products and led to private capital investment in production facilities and transportation networks.  Both of these eras also saw a large spending and policy role for government which facilitated development.  The first era also saw northern Ontario as a major source of provincial government revenue.
Growth was poorer in the 1914 to 1945 as a result of erratic global markets, private sector weakness and the retreat of government involvement in northern development after the onset of the Great Depression and yet this was still an era of substantial population growth.  Economic growth since 1970 in the region has essentially stagnated along with population growth as a result of long-term technological change which reduced the labour intensity of natural resource extraction in the region.  While government did undertake more interventionist activity in an effort to arrest northern decline, it has failed to reverse the slow growth nature of the region given the absence of supporting private sector investment. 


[1] By the 17th century, the mainly Algonkian culture Anishnawbe and Cree indigenous population had developed a seasonal woodland economy and lifestyle centered on hunting and trading. See Bray and Epp (1984: 8).
[2] See Robinson (2016: 8-9) for a fuller description of the region.  The glaciers of the various ice ages periodically scraped topsoil off in northern Ontario and deposited it further south ironically enough making nature responsible for the first set of “resource transfers” from Ontario’s north to the south. According to Louis Gentilcore (1972: 7-8): “The acid nature of the podzols, the slower breakdown of the vegetable matter, and the prevalence of peaty soils create problems in the utilization of the soils of northern Ontario for commercial agriculture.”
[3] The 2011 provincial Growth Plan for Northern Ontario (2011) for example includes Parry Sound.
[4] For one point of view, see Miller (1985).
[5] See Di Matteo (1991, 1999) for overview of these themes.
[6] Innis (1930/84).
[7] These are generally known as backward, forward and final demand linkages.  See Watkins (1963).
[8] Part of this process of arrested development could also be referred to as a Staples Trap whereby an economy is not able to move beyond its initial export sector activities.  For a discussion of the Staples Trap see Watkins (1963).

References

Bray, M. and E. Epp, eds. (1984) A Vast and Magnificent Land: An Illustrated History of Northern Ontario. Ontario Ministry of Northern Affairs.
Di Matteo, L. (1991) “The Economic Development of the Lakehead During the Wheat Boom Era: 1900-1914,” Ontario History, LXXXIII, 4, December, 297-316.
Di Matteo, L. (1999) “Fiscal Imbalance and Economic Development in Canadian History: Evidence from the Economic History of Ontario,” American Review of Canadian Studies, Summer, 287-327.
Innis, H.A. (1930/1984) The Fur Trade in Canada, Toronto: University of Toronto Press.
Miller, T. B. (1985) “Cabin Fever: The Province of Ontario and its Norths.” In D.C.D.C. MacDonald, ed., The Government and Politics of Ontario. 3rd ed. Scarborough:Nelson, Canada, 174-191.
Ontario (2011) Places to Grow: Growth Plan for Northern Ontario.  Toronto: Ministry of Infrastructure and Ministry of Northern Development, Mines and Forestry.
Robinson, D. (2016) Revolution or Devolution?: How Northern Ontario Should Be Governed. Northern Policy Institute. Research Paper No. 9, April.
Watkins, M. (1963) “A Staple Theory of Economic Growth,” Canadian Journal of Economics and Political Science, 29, 141-158.

Wednesday, 29 January 2020

Thunder Bay City Budget Deliberations 2020: The Plot Thickens


Well, things should be quite interesting this evening at Thunder Bay City Council as they have their final budget deliberation meeting. Councillor Mark Bentz has staked out his position. In remarks reported in the local media, he is of the position that levy hikes are not sustainable given that tax levy increases are more than double the consumer price index over the last decade. In a very stark graph provided in the Chronicle Journal, Councillor Bentz asserts that since 2011, the tax levy has grown by 32 percent while the CPI has gone up 14 percent and the assessment base only 7 percent.  This is of course a pretty classic interpretation  of sustainability in that the tax levy is growing faster than the tax base meaning that the tax burden is essentially deepening on ratepayers.

The key question is what is the solution?   Part of the debate this evening is going to be over the list of items totaling 2 million dollars in cuts that have been produced by administration as part of getting the levy increase down from about 6 million to about 4 million dollars.  Some of the items mentioned include ending residential weekend snowplowing and closing the Conservatory and even reducing library hours.  It is quite interesting that all of these proposals entail direct service reductions to current ratepayers.  Your taxes will still go up, but you will be getting less. So there.

The fundamental problem is that the key expenditure component on the operating budget is wages and salaries.  The total wage and salary bill functions as a combination of both price and quantity – that is the salary per employee multiplied by the number of employees.  These are ultimately the items that also need to be addressed.  It can probably start with a hiring freeze given that despite a flat economy and a population total that has not budged in 20 years, there are more employees on the municipal payroll than there were 20 years ago. 

If one looks at the accompanying graph, one can see that since 1999, the number of employees of the City of Thunder has grown.  The actual number of FTEs (Full time Equivalent positions) rose from approximately 1,568 positions in 1999 to 1,840 in 2009 but by 2019 had declined to 1,715 and are now scheduled to rise to 1,724 in the 2020 budget.  The dip between 2009 and 2019 is the result of the City getting out of some of its homes for the aged obligations in 2016 so the pre-2016 figures includes more staffing for homes for the aged.  The other thing is that these total FTEs actually do not include police which in 2016 were an additional 333 FTEs.  It is possible to estimate an adjustment that removes homes for the aged staff prior to 2016 but adds police and the results show a steady increase and flattening out of employment.  


Between 1999 and 2019, employment as measured by these “estimated” adjusted FTE numbers may have grown from 1,642 to 2,040 – an increase of 24 percent.  Given that population in the City of Thunder Bay has been flat over the same period, the per capita numbers of municipal employees has grown substantially.  There may indeed be very good reasons why this has been the case but it needs to be discussed.  At minimum, a hiring freeze is not an unreasonable thing to do while numbers like this are discussed.  More to the point, perhaps Councillor Bentz can actually get the numbers from 2011 to 2020 on employment from administration given that in the end my numbers are only “estimates” as such data is not easily obtainable.  I would be interested in seeing the resulting charts.

Friday, 17 January 2020

Why Hospitals (And Long-Term Care) in Ontario Need More Funding


When it comes to provincial budget season, Ontario’s health sector invariably will lobby for more funding.  As part of the string of posts I have been doing on health care spending in Ontario starting in November dealing with the four “ages” of Ontario spending, I want to explore the case for more funding for one aspect of the Ontario health care system in particular – hospitals.  In the lead up to the 2020 budget, the Ontario Hospital Association has made the case that with Ontario’s aging and growing population, there are too many patients waiting for beds.  Given that Ontario spends less per capita than any other provincial government in Canada, it needs this year an increase of $922 million for hospitals – a 4.85 percent increase – simply to maintain access. 

While the shortfall compared to other provinces is a good point, the case for hospitals is evident even if one looks at Ontario hospital funding on its own.  Figure 1 plots both nominal and real (in $2019) per capita hospital spending in Ontario from 1975 to 2019 using data from the Canadian Institute for Health Information’s National Health Expenditures (NHEX) database.  Real per capita nominal spending has grown from $210 in 1975 to reach a peak of $1,494 in 2019.  This may seem impressive until one adjusts for inflation and reveals an increase from $1,118 to $1,494 instead.  Indeed, real per capita spending has essentially declined since 2010 when it peaked at $1,583.  In other words, Ontario hospital spending has not kept up with the combination of both inflation and population growth since 2010 and has actually declined by 6 percent.


Things look even worse when you look at the average annual growth rate of real per capita spending that compares hospitals to the other categories as done in Figure 2.   

 
The capital category – which of course means new or expanded facilities such as hospitals and long-term care homes as well as equipment has dropped on average -4.8 percent annually.  So much for all of that infrastructure money at both the federal and provincial levels.  Where has it gone is a good question.  After capital, the next largest declines average annual declines are for other professionals at -2.3 percent (i.e., provincial funding for things like eye exams are a factor here),  hospitals at -0.6 percent and then other institutions – which include mainly long term care homes.  The increases are for physicians, drugs, and most dramatically public health, administration and “other health spending” which includes things like home care services.

Institutional care in Ontario – namely hospitals and long-term care – are one area that needs some spending revitalization (including both capital and operating spending) if there is to be any hope of dealing with both rising costs, as well as the greater service demands from a population that is both aging and growing.

Sunday, 12 January 2020

Declaring a Climate Emergency


On Monday evening, Thunder Bay City Council will be hearing from a deputation that will ask it to declare a climate emergency.  According to a front page story in the January 11th Chronicle-Journal: “Thunder  Bay’s  EarthCare  climate  adaptation  working  group, led by chairperson Aynsley Klassen,  is  set  to  make  a  deputation to council asking for them to declare a symbolic climate emergency.”  According to Chairperson Klassen, they are not asking for a declaration under the Emergency Management and Civil Protections Act that would include asking for actual resources but are simply asking for a symbolic message to be sent.  Thunder Bay City Councillor Foulds – who is the chairperson of the City’s EarthCare Advisory committee - is championing this cause and argues that: “Declaring a climate emergency is a way for governments to publicly acknowledge the need for urgent action.”

This is the kind of declaration Thunder Bay City Council will enjoy debating and making and will likely spend several hours on it as each Councillor voices their lengthy support for dealing with the effects of climate change, making sure everyone publicly knows that they are on the side of the environment and future generations by declaring a climate emergency.  Moreover, given that it is “symbolic” it means they will not have to ask the provincial government for any resources or better yet not have to commit any City resources to dealing with the “emergency.”  In many respects, they are simply doing what climate activist Greta Thunberg has railed against – the inaction against climate change.

As she noted in her address to the UN - “How dare you continue to look away, and come here saying that you are doing enough when the politics and solutions needed are still nowhere in sight,” … ““You say you ‘hear’ us and that you understand the urgency. But no matter how sad and angry I am, I don’t want to believe that. Because if you fully understood the situation and still kept on failing to act, then you would be evil. And I refuse to believe that.” I also refuse to believe politicians are evil when self-absorbed, opportunistic and short-sighted are much better descriptors. 

I would opine that simply declaring a climate emergency and not acting on it is simply paying lip service to climate change and trying to score some political points with climate change activists.  If Thunder Bay City Council really wants to do something to deal with a climate emergency, then they need to back up their “feel good” declaration with some concrete action. It is not about what they have done to date – such as the stated  reduction in greenhouse gas emissions by 25 percent since 2007 – it is about what they are going to do.

An emergency requires drastic action.  What will be done to expand use of Thunder Bay Transit in order to reduce reliance on personal automobiles?  Is not raising city transit fares by 11 percent - as proposed in the 2020 budget – contrary to bringing about a more sustainable economy?  Maybe City Council should aim to reduce the “footprint” of City government by pledging to reduce its employment via a process of attrition – that is through not filling retirements and exits – by 10 percent over the next five years and reinvesting the savings in climate initiatives such as planting more trees in the intercity area or expanding sewers to deal with heavier rainfalls?  Maybe there should be a permanent reduction in property tax rates for new homes constructed that are under 1000 square fit in order to promote more sustainable lifestyles with less “stuff”? Need I go on?

Enough with the political grand standing.  Where are the solutions? If you are going to declare an emergency, back it up with some action.  Words and symbols are not enough.  Thunder Bay does have a climate emergency – it is the climate at Thunder Bay City Hall.