Northern Economist 2.0

Tuesday, 18 July 2023

Population, Growth and Statistics in Thunder Bay


The City of Thunder Bay’s population according to the Census of Canada has remained essentially the same since the 1970s with some minor growth in the surrounding CMA.  This has occurred while elsewhere in the province and country, population soars.  Indeed, the city’s growth rate between July 2021 and July 2022 while positive at 0.2 percent, was actually the lowest in Canada for cities with populations above 100,000. 


With every census, there are the usual concerns with stagnation but despite the census evidence, there are actually two narratives when it comes to population in Thunder Bay.  One story is that given the city’s growth rate in population, there is a lack of economic growth and stagnation is a real concern given that population is attracted to economic opportunity.  When combined with the fact that the city and region appear to be aging faster than the rest of the province, the prospects for a more dynamic future look increasingly precarious.  However, the other story often voiced by local officals is that Thunder Bay’s population is much larger than the official population figures indicate.  In this narrative, Thunder Bay is an attractor for a transient regional population that comes in and makes use of its services. 


Even the current Mayor of Thunder Bay recently was quoted asserting that “he believes there are 15 per cent more people than recorded by Statistics Canada, adding that’s where a lot of the city’s financial problems come from, having to provide services for people that aren’t officially on the books, and hence aren’t counted when senior levels of government hand out transfer payments.” More directly, he said: ““We’ll ride with 120,000, but the police know, the hospitals know, the health-care system knows, and even the mercantile areas know it’s more than that. There’s more people around and if you spent one hour at city hall you’d know there are a lot more people wandering around the city than actually meet any census.” With an offical City population of 108,843 and a CMA/Metro population of 123,258, the mayor’s assertion suggests that Thunder Bay’s actual population range from City to CMA is from about 125,000 to 142,000.


Of course, such assertions would be useful if accompanied by time series data from police, paramedic, and hospital services though even that of itself is not sufficient.  After all, it is possible to have population growth flat, but usage rates rise.  With more use per capita, even with flat population growth, one could see paramedic or police services rise in total incidents.  Indeed, rising usage for hospital and paramedic services could be a function of a larger transient population or it could also be the result of an aging population.  However, without more detailed data, simply saying “if you spent one hour at city hall you’d know there are a lot more people wandering around the city than actually meet any census” is probably not going to cut it with the city’s governmental transfer partners. 


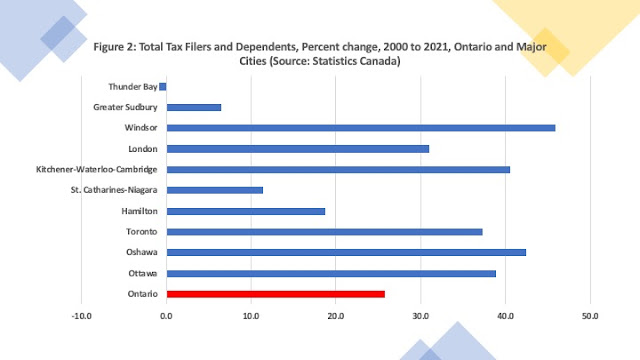
In the search for other approaches to the numbers, another way at looking at growth in a city is through federal tax filer data collected by the Canada Revenue Agency and disseminated through Statistics Canada.   The accompanying Figure 1 presents an index for the number of tax filers and their dependents for the period 2000 to 2021 for Ontario as a whole and a number of its major cities with the year 2000 set at a value of 100.  Over this period, the total number of tax filers in Ontario rose from 11,331,080 to 14,248,730 which when normalized with 2000 equal to 100 means Ontario went from 100 to 125.7 for an increase of 25.7 percent (See figure 2).  Over the same period, Thunder Bay went from 120,140 to 119,180 which when normalized goes from 100 to 99.2 for a decrease of -0.8 percent.  Indeed, of the cities on these two charts, Thunder Bay is the only one that sees a decrease in the number of total tax filers and dependents.


Does this mean that the mayor is wrong? Not necessarily. Given that the assertion is that these additional users of services are transient or temporary population, there is no reason that they would be registered with a residential address in Thunder Bay for income tax purposes.  All these figures do is confirm the official narrative from the Census and Statistics Canada that Thunder Bay’s population is essentially flat and has been for quite some time.  If there are indeed a large number of unofficial residents moving to and from the city using its services, then Thunder Bay needs to do a better job of presenting a credible statistical method of capturing that population.

Monday, 10 July 2023

A Primer for Premiers: Some Health System Metrics

 Canada's Premiers are meeting in Winnipeg July 10-12 and along with all the photo opps and media availability sessions, they are also expected to have some discussions on a number of pressing policy concerns including how to spend the forthcoming increases in federal transfers.  Given that none of them have yet submitted plans on the targets and timelines they will use to convert the increased funding into health system improvement outcomes, one suspects it will be some time before the funding increases have any impact. 


Of course, it remains that simply increasing funding alone will not necessarily solve the current chaos as emergency rooms close down during busy summer months, the rosters of people without family physicians grows as physicians retire and nursing shortages lead to delayed or postponed procedures.  As the premiers know, Canada already is one of the biggest spenders in the OECD on health and well above the OECD average both as a share of its economy (See figure 1) and in dollars per capita (See figure 2) .  Yet, as figures 3 and 4 illustrate, this larger amount of spending does not translate into more physicians per capita or more hospital beds per capita.  


Now these simple types of comparisons can be critiqued on a number of levels.  After all, while we have fewer physicians per capita, our nurses per capita match the OECD average.  Moreover, Canada's physician to population ratio has been rising in recent years and it has been noted that simple physician to population ratios are not always helpful.  Physicians in many other countries sometimes perform a broader range of functions than physicians in Canada which means having more of them per capita is not always an indicator of greater availability.  Yet, if you look at physician consultations per capita, in 2019 - just before the pandemic - Canada stood at 6.6 while the OECD average was 7.0.  

Canadian physician consultations per capita a decade ago were above the OECD average meaning that with fewer physicians per capita and higher consultations, Canadian physicians were seeing more patients than their international counterparts.  That appears to no longer be the case. The case loads of the average Canadian physician have been declining and part of that is a change in practice culture and the arrival of the desire for better work-life balance.  And there are other indicators where Canada does not perform as well - we are below the OECD average on diagnostics such as MRI and CT scans per million population. 

So, throw in the chaos of the pandemic era, and we can see that the current problems are a function both of long term trends in Canadian health system resources, practices and staffing combined with the short-term shock of the pandemic's disruptions.   We are already spending a lot more money than many other countries but we are definitely seeing less health service outcomes with that money.  The per capita statistics also in the Canadian case reflect the fact that there are a lot more people in Canada given recent population growth which when combined with an aging population has certainly resulted in demand side increases too.  The Premiers face quite the challenge.  They will have more money to spend and do need to spend more to deal with the short term supply shortfalls.  At the same time, they need to set up mechanisms to ensure that over the medium to long term, more money does not continue the recent trends of spending more and getting less.


Wednesday, 5 July 2023

It Really is About Housing Supply and Canada Needs to Get Building


The housing shortage, rising prices and rising rents continue to preoccupy Canadian public policy debates and with good reason.  As of June 2023, median rent for a one bedroom apartment in Vancouver stood at $2,700 and $2,400 in Toronto with rent across Canada up 20 percent over pre-pandemic levels.  Meanwhile, average housing prices in Canada reached $729,044 in May of 2023 – the highest they have been since April of 2022.  Since 2000, residential property prices in Canada have essentially doubled – per capita income have not.  


Needless to say, the response in the most Serene Kingdom of Canada has been predictable.  In the name of boosting supply, municipalities starting to chase multiple property owners for tax revenues  (who incidentally are probably renting out the properties they own and helping to alleviate the shortage). Then there is the typical passive-aggressive Canadian story about how seniors are not downsizing and are living in homes with empty bedroom but of course “Policy experts and large city mayors are not suggesting that seniors should rent out their rooms en masse to better use the extra space.”


There is indeed a supply issue in Canadian housing, but it is not because there are too many multiple owners who are hoarding empty apartments or existing homeowners who do not want to share their spare rooms.  It is because over the long term the supply of new residential construction has fallen behind the rate of population growth so that housing starts per capita are dramatically lower than they were during the 1970s and 1980s.  Incidentally, this era had even higher interest rates and inflation than today and still managed to keep up with construction.  The accompanying figure plots seasonally quarterly total Canadian residential housing starts (units) as well as the per capita index (with 1961=100) [Data Source: Statistics Canada] for the period 1961Q1 to 2023Q1.  The results are quite startling. 


In the first quarter of 1961, total housing starts in Canada were 34,225 units.  In the first quarter of 2023, they were 55,753 – an increase of 63 percent.  The problem is that in 1961Q1 Canada’s population was 18.1 million while in 2023Q1 it was 39.9 million – an increase of 120 percent.  As a result, when the number of starts per capita are converted into an index (with 1961=100) it becomes quite apparent that despite surging population, we are building fewer new units per person despite a slight upward trend in the total number of units. 


The most quarterly housing starts ever were actually  in first quarter 2021 at 73,738 with the average quarterly number of starts in 2021 at 68,612.  In 1973, the average number of quarterly housing starts was 66,883.  Total starts at present are not much different than the peak of the early to mid 1970s.  When you look at the per capita index, the overall trend since 1961 is downward but essentially it appears that after the housing bust of the late 1980s, housing starts per capita have stayed flat at about half of what they were in the 1970s.


The baby boom and tail of the boom that entered the workforce in the 1969s to early 1980s was a population surge that was accompanied by new and rising per capita housing construction.  The current surge in population is not being accompanied by rising per capita construction but with construction at the historical per capita rates in place since the 1990s.   That is why housing prices are high. Band-aid solutions that attempt to solve the problems by essentially redistributing existing supply is but another sign of a society that seems to find it increasingly hard to build new things and to get things done.  But then, this is the same society that is dealing with inflation by injecting more money into the demand side of the economy. In the end, government policy to fight inflation is still conflicted with higher interest rates to slow down the economy on one hand and stimulus on the other.  It would be more useful if some of that stimulus went to building housing.

Saturday, 1 July 2023

Canada 100 Million: The Pros and Cons


Canada’s population has been growing dramatically over the last few years as a result of boosting immigration targets designed in part to address an aging population and labour shortages.  A larger Canadian population in the long run has benefits and costs and there has been debate over how quickly and by how much Canadian population should be growing.  For example, the non-profit group Century Initiative, wants to see Canada’s population reach 100 million by the year 2100 and sees benefits to a larger economy and market size as well as more clout when it comes to a global world.  A book by Doug Saunders called Maximum Canada sees a larger Canada as a way to avoid global obscurity. 


Of course, as all economic historians know, while more population can be a source of economic growth, there is a distinction between extensive and intensive growth.  That is, if population rises faster than output then per capita income will actually decline.  Then there are the adjustment costs of such a large population influx and Canada at the moment seems particularly hard pressed to increase its social and physical infrastructure – particularly housing and health – in the wake of large population increases.  The result has been a rising cost of living when it comes to housing costs.


Economists Mikal Skuterud, Chris Worswick and Matthew Doyle make the point in that increasing Canada’s population while increasing its economic size can also reduce the average person’s standard of living if economic output does not increase faster than population. Rising population without accompanying business investment to raise productivity is a recipe for a lower standard of living and Canada has had a productivity problem for some time now.


Moreover, while a larger population may be correlated with increased global clout, in Canada’s case it would also help in today’s turbulent world if the increased size came with a larger share of GDP spent on defense and a couple of aircraft carrier task forces with at least one with Arctic capability.  After all, the Philippines and Ethiopia both have just over 100 million people and they are not exactly throwing their weight around globally.  As in the case of housing and infrastructure investment, Canada has also lagged in its security investment and more people alone will not create the international respect some people think it will.


Since 2013, Canada’s population has grown by nearly 5 million people – a 14 percent increase - and is basically now at the 40-million-person mark.  Figure 1 presents the percent growth ranked by economic region – with some artistic license for the regional groupings – and shows that Alberta, British Columbia and Ontario have grown the fastest.  The Territories and Saskatchewan-Manitoba have been next, and the Atlantic Provinces and Quebec have grown the least.  


What this means is that over time, as Figures 2 and 3 illustrate for the period 1991 to 2023, the relative share of the Canadian population living in Alberta, BC and Ontario is growing while the rest is shrinking.  In the case of Quebec, in 1951 it had 29 percent of Canada’s population and by 1991 it was 25 percent and 2023 sees it down to 22 percent which has no doubt raised the hackles of Quebec’s premier.  If one accepts that a growing Canadian population will increase our economic mass and clout in the world, then one also needs to accept that Quebec, the Territories, the Atlantic Region and Saskatoba – will see diminished clout within Canada. 


And within provinces, it is likely that some regions will do better than others.  In the case of Ontario – the Greater Toronto-Hamilton Area is where most of the population will concentrate while it is likely given current trends that cities like Thunder Bay or Sudbury will not be that much bigger than at present by 2100.  True, climate change and other shocks make such forecasts subject to considerable uncertainty, but it would take some pretty incredible economic, political, and social forces to put Thunder Bay over one million people by 2100.


Needless to say, while a much larger population may assist in growing Canada’s economy and may increase our global weight, the outcome is not assured given our productivity lag.  This is really the crux of the issue.  It is not that Canada would not benefit from being larger and cannot accommodate more people, but it needs to be accompanied by the investment spending needed to expand our infrastructure.  Moreover, increasing our population will also require an effort to deal with the regional anxieties and tensions it will produce within Canada.  There is a role for government here in either helping facilitate and coordinate the necessary investments or get out of the way to let those that can get things done do their thing.  Still, we would not want a future without challenges and opportunities for our descendants.  Happy Canada Day.

Friday, 23 June 2023

The Finances of the University: A Lakehead Update


My last update on Lakehead University’s finances was in October 2021 and at that time despite the pandemic, it was doing well according to its 2020-2021 financial statement. From 2020 to 2021, revenues did fall slightly from $200.2 million to $198.4 million – a drop of just under one percent.  However, total expenses fell even faster going from $198.7 million in 2020 to $187.6 million in 2021 – a drop of 5.5 percent.  As a result, there was an operating surplus of $10.691 million in 2021 which was up from a surplus of $1.542 million in 2020.  And this was before the unrealized gains from an interest rate swap are factored in which brought  the total surplus to $14.456 million.  In the end, the sky did not fall during the pandemic. Moreover, there has been a long period of good financial performance given that over the 2000 to 2022 period, there have only been six deficits with the remaining years seeing surpluses – that is about 75 percent of the time.


We are now in summer of 2023 and while financial statements for 2021-22 are up and available, those for 2022-23 have yet to appear.  However, this type of lag appears customary across Ontario universities as the 2022-23 statements do not seem to appear on other university sites yet either.   Nevertheless, it is possible to quickly update the figures provided in October of 2021 with an additional year of data. 


Figure 1 shows that for 2022, revenues were at $184.824 million, down by $13.6 million dollars while expenses were up $17,470 million reaching $205.227 million.  As a result, the previous year’s surplus of $10.691 million had become a deficit of $20.403 million. If one factors in unrealized gains on interest rate swaps, then the deficit falls to $16.729 million.  At first glance, it would appear that the end of COVID savings and the resumption of in person teaching was accompanied by both rising expenditures and falling revenues. 


However, while general government grants from 2021 to 2022 fell from 64.014 million to $61.611 million, restricted grants rose from $16.838 to $22.005 million.  As well, Student fees also rose from $84.460 million to $86.962 million while the sales of goods and services nearly doubled in value going from $6.621 million to $12.279 million. All in all, taken together, these should result in rising rather than falling revenues.  However, the crucial variable here is the inclusion of investment income which was $20.055 million in 2021 (hence the large surplus that year) and -$5.384 million in 2022 (hence part of the 2022 deficit explanation).  However, it should be noted that much of this deficit is due to investment performance and if the 2021 investment performance had replicated itself, one would have seen a balanced budget if not a small surplus.


Figure 2 plots the university’s long-term debt, and it declined slightly in 2022 going from $106.575 million in 2021 to $103.655 million.  Figure 3 plots the main revenue sources – general government grants and student fees - in longer-term detail.  Total student fee revenue has been approximately stable since 2019 ranging from $84.460 million to $86.962 million.  This is despite the fact that tuition fees for domestic students were cut 10 percent by the provincial government and then frozen during that same period.  Like many other universities, Lakehead is now more reliant on international students whose tuition is not subject to the same restrictions. 


General government operating grants in absolute terms have also been stable for quite some time but in real terms (after inflation) they have declined.  As a share of total revenues, student fees have steadily increased over time while government general grant revenue has declined as a share of revenue.  Student fees now account for nearly 50 percent of Lakehead’s total revenue with general government grant funding now at about one-third.  This makes Lakehead much more sensitive to enrollment fluctuations than it would have been two decades ago when students fees accounted for about 30 percent of its total revenues.


Fortunately, enrollment has held up (See figure 4).  Total headcount enrollment (number of full time and part time students) has grown nearly 30 percent since 2017.  In 2022  the total headcount (as of November 2022) grew nearly 1 percent.  While the university’s total headcount has seen ebbs and flows, the overall trend since 2000 has been upwards.

So, there you have the update. Looking forward to the 2022-23 Financial Statement release!