With all the focus on the US debt ceiling political debate, it is sometimes easy to lose focus on our own debt situation at both the federal and provincial levels. Taking a long-term view on Ontario’s net public debt of course requires data and as part of my ongoing efforts on putting together Ontario’s fiscal history, I have been able to get Ontario’s provincial government net public debt back to 1914. The data comes from two sources. First, there are the more recent numbers going from 1966 to the present which are obtainable from Finances of the Nation and the Ontario Financing Authority. As for the pre-1966 numbers, there are a number of provincial budgets from the early and mid-1960s which among other things contain a lot of historical data on revenues, expenditures, deficits and debt.
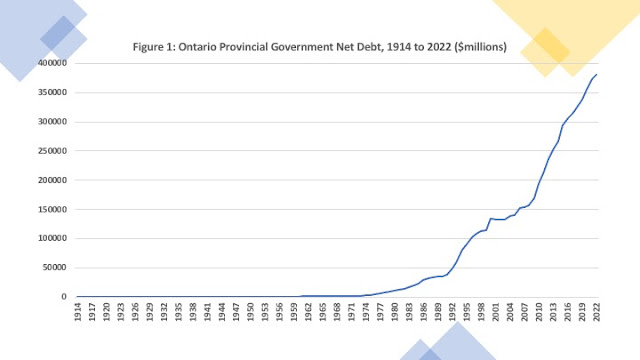
Ontario from 1867 and into the early 20th century generally ran surpluses largely due to the bountiful natural resource revenues from forestry and mining rents and royalties. The acquisition of large amounts of capital debt appear to coincide with northern Ontario infrastructure development of the early 20th century – in particular the advent of the Temiskaming and Northern Ontario railroad circa 1902. Further expansions of debt occur during and after World War I with the advent of the motor care and provincial highways as well as the expansion of the hydroelectric grid. And of course, there is the Great Depression which played havoc with public finances. Ontario’s net debt numbers begin in 1914 (See figure 1) at just over 6 million dollars and by1945 had reached 480 million dollars. Between 1945 and 1960, Ontario’s net debt grows to 994 million and in 1961 Ontario’s net debt tops one billion dollars. By 1980, Ontario’s net debt had reached nearly 11 billion dollars and grew to just over 35 billion by 1990. It is the period since 1990 that sees an even more rapid expansion of nominal net debt growing to 134 billion dollars by 2000, 194 billion dollars in 2010 and then about 380 billion dollars by 2022. Over 90 percent of Ontario’s net public debt has been acquired since 1990.
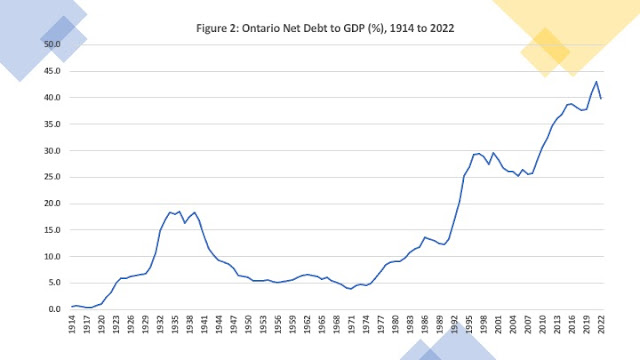
Of course, nominal numbers alone are not sufficient as it is the size of the debt relative to the economy - the net debt to GDP ratio – that matters more. Figure 2 illustrates this quite nicely. The Great Depression era sees a first peak of the Ontario net debt to GDP ratio in the 15 to 20 percent range. It then falls and levels off at about 5 percent going into the 1970s. After that it begins an overall rise with particularly steep jumps during periods of recession – in particular, the early 1990s, and the era of the Great Recession/Financial Crisis 2007 to 2010. As a result of fairly generous federal transfer support, the pandemic did not see as large a spike in Ontario’s net debt to GDP ratio as these other two periods.
In the end, while the size of the provincial debt in nominal
terms seems to shake a lot of people, it is debt relative to the size of the economy
that should generate greater concern.
The Great Depression Era aside, Ontario generally had a net debt to GDP
ratio at about five percent up
until the 1970s.
The period since the 1970s represents a period where the ratio has
generally trended upwards. If one
defines fiscal sustainability as a stable or declining net debt to GDP ratio,
then the period before 1970 can be seen as one where Ontario’s revenue and
expenditure structure was generally fiscally sustainable.
One cannot say the same with respect to the period since 1970. And yet, it would appear that despite
occasional fits of rhetoric, Ontario has not been stirred to action when it comes to
its net debt.