Northern Economist 2.0

Tuesday, 2 February 2021

Why Laurentian Has Filed for Creditor Protection and Not Lakehead


Yesterday’s news that Laurentian University is facing insolvency and has filed for protection from its creditors in the wake of a deteriorating financial situation brought about by the impact of COVID-19 is an important development in Ontario’s university sector.  Laurentian’s President Robert Haché said the move was necessary to put Laurentian on a firm footing after years of deficits and that: ““We are facing unprecedented financial challenges and our financial health is currently amongst the weakest in the province compared to other universities.”


Among the compounding factors to the impact of COVID-19 on the university’s finances were years of recurring deficits, the poor demographics in northern Ontario, the closing of the Barrie campus project and the Ontario governments decision to first cut and then freeze tuition fees.  Needless to say, the recent Ontario University application numbers showing a drop in first choice applications for nearly two-thirds of Ontario universities and surges in applications for the remainder – McMaster, Waterloo, Toronto, Western, Ottawa and York - has not helped matters.  Obviously, given the COVID situation, all the GTA students really want to stay in the GTA next year though how they are all going to be accommodated is beyond me.  There may be online recruitment opportunities for the smaller universities outside the GTA.


Of course, Laurentian’s predicament and that of smaller universities in Ontario in general is not that surprising.  As noted over a decade ago, one of the perils of being a small university was the bigger burden of debt acquired in the first decade of the 21st century as universities undertook massive capital spending projects to deal with rising enrollments, infrastructure renewal and program expansion even though long-term demographic projections suggested that enrollment growth would eventually ebb .  Long term debt as a percentage of total university revenue was higher in smaller Ontario universities though a decade ago, Wilfrid Laurier, Lakehead and UOIT seemed in worse shape than Laurentian.


So, why is Laurentian in trouble and not say Lakehead? Using data from annual financial statements, it is fairly easy to piece together some answers.  The two universities are fairly similar, in terms of their total enrollment, though Laurentian is slightly bigger at just over 9,000 students in total enrollment while Lakehead is just over 8500.  Total revenues and spending are shown in Figures 1 and 2 and they also show similar size total revenue and spending envelopes over time.    


They also now have similar stocks of debt.  On the surface, Lakehead has a bigger stock of long-term debt than Laurentian (see Figure 3) but the stock of debt has gradually diminished since 2011-2012 whereas Laurentian appears to have acquired its debt more quickly in recent years. 


 In a sense, Lakehead has had more time to deal with its debt stock in the wake of the rapid acquisition prior to 2006. Most of it is also the result of capital projects rather than cumulative deficits.  Since 2006, Lakehead has only run deficits three times (Figure 4) whereas Laurentian has managed to run one 11 times. Continual deficits have a nasty habit of adding up over time.


Given nonexistent growth in government grants, a big difference between the two institutions has to do with where the recent revenue growth.  Laurentian as a bilingual university has had difficulty maintaining and staffing the range of programs necessary to attract enrolment to offset weak grant revenues and the tuition freezes.  Offering programs in both languages in a sense has harmed potential economies and the cancelled Barrie campus was supposed to be an avenue for growth though how successful it might have been is an interesting question.  Lakehead on the other hand has been able to expand into international enrolment and particularly graduate international enrollment and attract them to their campus.  Unlike residents of the GTA, international students seem willing to try out Thunder Bay. 


As Figure 5 shows, Lakehead’s tuition revenue since 2006 has been consistently above Laurentian – even though it is the slightly larger university – and it has actually grown rapidly over the last few years.  Laurentian has not and its persistent deficits mean that it will need to take some steps to deal with its finances though advertising to potential students you are insolvent is probably not the best recruiting tool.  Given the application drops across the Ontario system for smaller universities, the Ontario government will be facing increasing issues in its university sector in the wake of it deciding to hamstring university revenues on the tuition front.  In the end, universities need to make sure that their costs are balanced by their revenues and that will be a challenge in the current environment.

Monday, 1 February 2021

The Zaniness Continues at Thunder Bay City Council


Canada’s longest running combination of basic income for politicians experiment and situation comedy continues with the weekly meetings of Thunder Bay City Council as they wrap up their budget reviews and deal with their usual business at hand.  For those of us of a certain vintage, the online meetings do look like a continually shifting combination of the Brady Bunch intro and Hollywood Squares and during the long meetings one can draw some amusement from deciding which councillor or administrator is playing the role of Paul Lynde, or perhaps Gladys, Marcia or Peter. 


Nevertheless, even the councillors themselves seem to be increasingly exasperated by the meetings with last week seeing one councillor complain out loud about accomplishing nothing after several hours of debate on the presence of hockey nets at city skating surfaces produced no solution.  Several weeks ago, the chair of the budget committee’s facial expression was priceless as one councillor for whatever reason went on a bit of a rant that the city budget was so complicated that it made him dizzy.  It would appear that fiscal vertigo is one of the job hazards of being a Thunder Bay City Councillor.


And last week’s meeting also dealt with the free transit fare proposal and produced a suggestion that given the cost of implementing a completely free fare system, that perhaps there should be one free day a month.  One is surprised that the more progressive minded members of council did not use this opportune juncture to  borrow from the collective wisdom of our current Prime Minister and recently departed Governor General to state that we all experience reality differently and that transit patrons should simply decide when boarding the bus if they thought it was a fare free day.  In the end, Council simply decided to freeze transit fares saving riders $68,000 as it would appear that the $115,000 cost of one free day a month was better spent on a new Thunder Bay waterfront sign.


There are of course more serious issues to be discussed but councillors in Thunder Bay prefer spending time on these digressions to avoid the more serious business at hand.  To use yet another colorful marine metaphor, it would appear they are simply a school of freshwater smelts who rather than swim upstream to perform their reproductive duty as nature and need mandate, prefer to linger in the shallows, dally around the shore and even go in the opposite direction by joining the flow downstream.   In the end, they do not accomplish what they should and all they manage is entangling themselves on hockey nets and other debris. 


Among the more serious issues are two in particular.  First, there is the matter of the 2021 budget which after several review meetings has done little to further reduce the levy.  Apparently, the few hundred thousand dollars in savings that have been generated by the ponderous line by line review is seen as sufficient given that the starting levy increase came in at about two percent.  Suggestions of making more substantial reductions were rejected by most councillors and the Mayor, because they have apparently already made so many and they have been keeping levy rate increases after assessment growth at an average of 2.39 percent since 2012. 

The selective mathematical analysis leaves out the point that the total levy increase since 2012 has actually averaged just over 3 percent annually.  Moreover, one wonders how they can continually say they have made reductions when the total tax levy continues to grow faster than the rates of population growth and inflation combined.  It remains that the councillors have yet to seriously deal with the spending and staffing reform necessary to reduce the tax levy to more sustainable levels.  As stated previously on Northern Economist, given that nearly 60-70 percent of the municipal tax levy is spending on wages, salaries and benefits, there needs to be a policy of reducing the staffing footprint via attrition with reallocation to priority services and functions. 


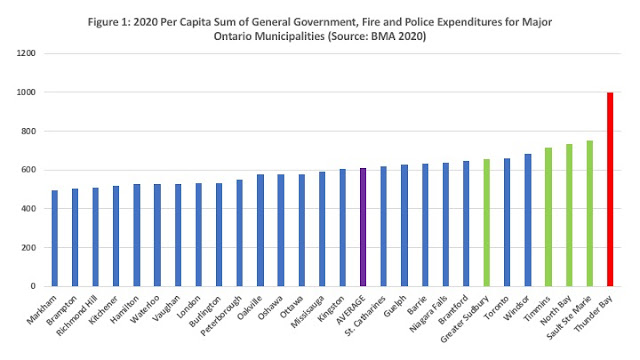
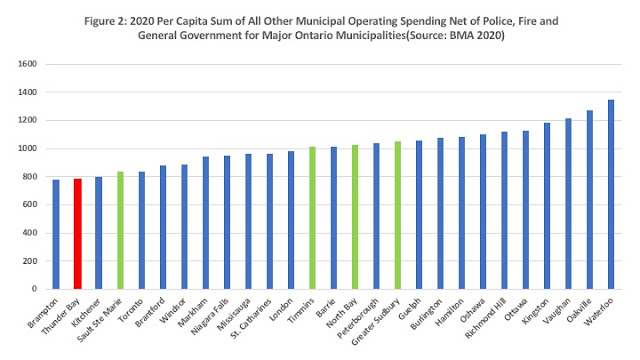
The hard work of making more lasting structural changes in spending, given that Thunder Bay spends substantially more than other municipalities particularly on protection services and administration, is too much for our councillors to handle.  Instead, as shown in last week’s meetings, the councillors prefer the parry, thrust, dodge, spin approach to policy debate with several councillors shedding crocodile tears for the taxpayer’s burden and then calling for tax reform at the federal and provincial level to reduce the reliance of municipalities on property taxation.  No doubt, they will next send a delegation to Belgium requesting Pfizer speed up vaccine deliveries to Thunder Bay because the High Council of the Lakehead has decreed it.  Of course, there is a certain irony in the fact that external powers often respond to our City councillors and administration with the same casual indifference that Thunder Bay ratepayers have come to know.


And speaking of casual indifference when responding to constituents, secondly, there is the perpetually pesky matter of the pinhole leaks in the wake of the addition of sodium hydroxide to the water supply.  Thunder Bay City Council and Administration have delivered their reply in court.  In response to the lawsuit filed by St. Joseph’s Care Group (SJCG), they simply deny any responsibility for the problem.  Indeed, their position is summarized by:


·       the city reasonably and in good faith exercised its power resulting from policy decisions concerning the management, maintenance and modification of the water system

·       the city denies that its acts or submissions caused or contributed to the presence of pinhole leaks in copper water pipes

·       the city lawfully carried on its responsibilities for the general benefit of the community at large

·       the city at no time made non-natural use of its water supply or infrastructure


None of this is surprising as the City has basically denied any responsibility all along, nor has it offered any assistance given the hardship thousands of homeowners and institutions have suffered in Thunder Bay.  Indeed, the real problem with the pinhole leaks issue is not only whether they followed an approved process but also the City’s reaction of doing absolutely nothing to assist property owners once the problems became apparent. 


What is more surprising is the assertion that: “The plaintiff knew that its pipes were old and beyond their reasonable life expectancy, yet they took no steps to replace them, nor did they install water leak detection systems.” What they are essentially saying is that if your house in Thunder Bay is more than 30-40 years old, you should go probably go out and replace all of your piping as preventive maintenance.  The building codes in Thunder Bay are so high quality that houses have a forty-year expiry date.  That should be an interesting addition to Thunder Bay’s marketing as a destination for prospective businesses and immigrant seeking to come and set up shop in Thunder Bay.


Moreover, while the SJCG is represented by Cheadles LLP of Thunder Bay, the city has used the tax dollars of the affected parties to hire the Toronto Law Firm of Theall Group thereby ensuring the leakage of water pipes is being supported by the leakage of spending power out of the local economy.  But then, the hiring of Toronto law firms to deal with local residents whether it is litigation or labour bargaining has become a feature of publicly funded institutions in Thunder Bay.  No doubt, councillors will assuage their consciences by intoning the importance of shopping local in Thunder Bay and asking for the rest of us to support local business as we select companies to replace our copper pipes.  If that does not stimulate the economy, then having your housing stock expire every forty-years should do the trick in generating new housing construction projects for a non-growing and aging population.


The zaniness continues and we are all paying for it.


Thursday, 28 January 2021

New CIHI NHEX Numbers Out: The Results Are Not What You Might Think


The annual Canadian Institute for Health Information (CIHI) National Health Expenditure (NHEX) data tables and report release was today and as a member of the CIHI NHEX Advisory Panel, I always look forward to the new report.  With 2020 being the year of COVID, the impact on health spending in Canada is of particular interest.  To say that there has been a lot going on is of course the understatement of the year.  The numbers for 2018 and 2019 have been updated with upward revisions with spending in those years reaching $254.6 and $265.5 billion respectively bring the health expenditure to GDP ratio for 2019 up to 11.5 percent.  Indeed, total health spending as a share of GDP in Canada has now been estimated at 11.5 percent for three years running. However, unlike the 2019 release which featured a forecast for 2019, the 2020 numbers do not provide a forecast for 2020.


The numbers for 2020 are a lot murkier as while there have been spending announcements totalling $29 billion across all levels of government, the net results on spending are still unclear.  As the report notes: “On one hand, there are significant spending implications associated with the treatment of a large number of patients with COVID-19 symptoms (often with prolonged stays in intensive care associated with high resource use), widespread testing and tracking

of the population, the creation of excess health system capacity and the purchase of personal protective equipment (PPE). On the other hand, health systems have observed a reduction

in overall health service delivery across the continuum of care…”


For example:


·      Visits to emergency departments (EDs) across Canada declined by almost 25,000 a day in mid-April 2020 — about half the usual number of patients. By the end of June 2020, visits remained lower than is typical for that time of year (about 85% of June 2019 volumes).

·      From March to June 2020, overall surgery numbers fell 47% compared with the same period in 2019, representing about 335,000 fewer surgeries.

·      In the 3 provinces where data is available (Nova Scotia, Ontario and Manitoba), the number of patient visits (in person and virtual) to all physicians dropped by 13% to 33% from March to June 2020.


So, the impact of COVID on health spending in Canada in 2020 appears to still be a work in progress.  While there have been unprecedented increases in announcements of spending on health and costs associated with treating COVID-19, at the same time there may have been a decline in spending on a lot of other things meaning the net impact for 2020 still has to be worked out.  If one were to add the $29 billion in spending announcements to the totals for 2019, one might obtain a potential upper bound spending estimate for 2020 of $294.5 billion which when applied to a GDP estimate for 2020 from the last Federal 2020 fall economic update of $2.183 trillion (avg of private sector forecasts), then the health expenditure to GDP ratio could be 13.4 percent. 


However, the examples of service volume reduction during the pandemic provided in the report suggest that there may be a significant decrease in spending in non-pandemic related health spending offsetting the increase in pandemic related spending thereby possibly even reducing total health spending from the 2019 level.  It is indeed an interesting possibility.


If total spending in 2020 stays at the 2019 level, the health spending to GDP ratio becomes 12.2 percent – not an outrageous spike from 11.5 percent at all given a pandemic year with hundreds of billions of dollars in deficit spending. If it goes lower than the 2019 level, one can expect a health spending to GDP ratio in 2020 not much different from 2019.   Again, this may be possible given the prospect that the provinces may have had some difficulty in spending all of the money the federal government has transferred to them for health and pandemic assistance as reported in this story in the Toronto Star.


Of course, one can understand why care has to be taken in making sure the right numbers for 2020 are calculated.  The pandemic response in Canada has been a year-long case of playing catch-up whether it was with recognition of the problem, deciding what to do and then implementing measures.  After a year we seem to still be debating travel restrictions. The erratic vaccine acquisition and rollout and the ongoing saga of testing or not testing at airports are just high-profile examples of how our governments – federal and provincial – just do not seem to be able to get things done either quickly or well.   If on top of all this health spending during the 2020 pandemic year actually goes down, then there will be yet another barrage of criticism for all governments – to say the least. 


Monday, 25 January 2021

Governments betting on low interest rates may experience rude awakening


Governments in Canada and around the world have run large budget deficits and greatly added to their debt loads due to their pandemic response and the accompanying economic downturn. Moreover, they are poised to add even more debt in coming year to provide further stimulus to kickstart moribund economies.

Indeed, the new Biden administration plans a $1.9 trillion economic package on top of the $2 trillion relief bill in March and additional $900 billion in December. As for Canada, the Trudeau government is poised to spend $100 billion in stimulus on top of a record deficit approaching $400 billion.

Clearly, governments worldwide went into the pandemic with large debt loads and will emerge with even bigger ones. However, the large deficits are justified on the grounds that we need to kickstart the economy and it’s a good time to do so because interest rates are at historic lows, making debt-service costs extremely manageable. In many respects, there’s a great gamble underway. We’re rolling the fiscal dice, anticipating that interest rates will not rise anytime soon and will remain below the growth rate of the economy, thereby ensuring sustainable debt burdens.

On the surface, the grounds for such optimism are supported by economic history. The long-term trend for interest rates over the last few centuries has gradually been downward as economic development and capital-labour ratios have grown, raising the return to labour (wages) and reducing the return to capital (interest rates). Indeed, this process has been documented by Jorda, Singh and Taylor with medieval interest rates of about 10 per cent falling to four per cent by the 19th century and now approaching one per cent.

In the wake of pandemics such as the Black Death and the Spanish Flu, the long-term downward trend has been amplified by further short-term depression of interest rates. Essentially, pandemics increase mortality, making labour scarcer, and also increase savings rates as people hunker down and spend less. Both effects make capital more abundant relative to labour and lower the return to capital. If the COVID pandemic is true to form, one might expect the next decade to also feature ultra-low interest rates, justifying the current debt acquisition gamble.

Yet, there are reasons why this time may be different.

First, the current low inflation environment may soon end. The large budget deficits worldwide, competing for funds and resources, may eventually put upward pressure on prices and interest rates.

Moreover, the rise in trade barriers may lead to rising costs as global supply chains become less smooth, further adding to inflationary pressure. Indeed, some think Canada may be among the first countries to start raising interest rates due to stronger commodity prices as economies recover despite Bank of Canada positions to the contrary.

Second, in historical pandemics, the mortality impact has been on much younger populations and as a result the labour force impact has been more severe. Unlike the Spanish Flu, for example, COVID’s mortality impact has been disproportionately felt by seniors as opposed to prime working-age younger demographics more engaged with the labour force. Indeed, the labour force disruption and reductions of COVID are mainly the result of measures taken to reduce the spread of the virus. Once the virus is contained, these reductions should abate.

Taken together, governments around the world should not bet big by taking continued low interest rates for granted as they add to their debt pile. One year ago, nobody was thinking about COVID-19 and its economic effects. Today, few seem to be thinking about potential interest rate increases. Governments may feel lucky as they boost deficit-spending in a game of fiscal roulette. But the real question we must ask ourselves is: do I feel lucky?


This appeared in the Fraser Institute Blog on January 20th, 2021.

Friday, 22 January 2021

Why Can Ignace Get Nice Things and Not Thunder Bay?


It turns out that Ignace is getting its municipal snow grader outfitted with a “snowgate”.  Essentially, the snow plough is going to have a gate on it that lowers at the end of the blade when in front of a driveway thereby preventing snow from blocking the driveway while snow on the street is removed. Needless to say, the thought of not having to deal with a foot high pile of crushed ice and snow at the end of a driveway after a major storm makes winter much more bearable. However, given it is budget season, one wonders how expensive this might be?


As noted in the CBC story: “The gate cost $15,000, and is easy to operate, Taylor-Hertz said. The operator of the grader flips a switch, and the gate lowers when going in front of a driveway. Once past the entrance, the gate comes up, pushing snow to the side of the road. ‘A couple of our department heads got together, and talked about getting a snowgate for the snowplow, or the grader attachment, and it has alleviated a lot of problems for our elderly residents in our community, by taking the windrow away at the end of the driveway’."


The “snowgate” is of course essentially a windrow prevention program as opposed to a windrow removal program but in Thunder Bay it is apparent our municipal government is capable of neither.  The possibility of windrow removal in Thunder Bay is not a new issue.  During the 2020 municipal budget season, this very idea was discussed in Northern Economist but to no avail.  As noted on their web site by the City:

"No, windrows across driveways will not be cleared by City Crews. Residents are responsible for the maintenance associated with their driveway, including the portion that is on City property. It is that portion of the City property which has been designed to provide snow storage during the winter. The City does not give up the right to store snow in that area of the boulevard when it allows the residents’ driveway to encroach across City property. It is important to note City crews have the important task of plowing snow on all City streets as quickly as possible. Snow removal from driveways is not a program offered by the City. "


Apparently, our driveways over the boulevard to access the street are an "encroachment" on City property so they can do whatever they want with the land.


And of course, it is not just Ignace that seems to be adept enough to cater to the needs of its municipal ratepayers.  Richmond Hill has the Cadillac of programs and now removes the windrows on all residential driveways.  Richmond Hill windrow removal was implemented in 2019 for all 55,000 households for a total annual cost of $4.4 million dollars. Markham also does windrow removal but for qualified registered applicants who must either be over 60 years of age or if under 60 have a medical note saying they cannot shovel snow.  Even Toronto has some windrow removal depending on where you live in the city. 


While one does not expect the Richmond Hill program, it remains that when it comes to windrow removal, Thunder Bay is not even trying. Why?  That is a good question.  After all, when it comes to municipal spending, Thunder spends one of the highest amounts per capita across major Ontario municipalities.  How onerous might the total cost of $15,000 per city plow be given a $200 million dollar tax levy supported budget?


The answer is it is all about priorities.  While Thunder Bay does spend one of the highest per capita amounts of major Ontario cities, it has chosen to prioritize three things: general government, police, and fire services.  Indeed, of 27 major Ontario municipalities, Thunder Bay spends the most dollars per capita (about $1,000)  of its tax levy supported operating budget on these three things as illustrated in Figure 1.  Indeed, nearly 60 percent of Thunder Bay’s operating tax levy is spent on these three items - again, the highest of these 27 major municipalities.  


However, as we all learn in first year economics, given a fixed budget, more of one thing results in less of something else.  As a result, as shown in Figure 2, once police, fire and general government are removed from its spending, Thunder Bay spends the second lowest amount of the same 27 major Ontario municipalities and the lowest of the five major northern Ontario municipalities.  That means relative  to other cities, less money is spent for snow removal, parks and recreation, public transit, environmental services and numerous other things.


How can this be?  In the wake of my last colorful comparison using marine metaphors, think now of the City of Thunder Bay as a Roman war galley.  The municipal taxpayers are the galley slaves at the bottom of the galley propelling the City forward with their property taxes while sloshing about in the cascading bilge water provided by innumerable leaky pipes.  On the top deck, along with the municipal council gathered around their decision table sitting comfortably on their high chairs, are the neatly arrayed officers of the ship – police, fire and administration standing between the elevated stern of a new Turf Facility and a prow marked by a new police station.  They are looking proudly forward as they steer the ship into the wild blue fiscal yonder. One can almost hear the beat of the budget drum as the municipal council intones to the ratepayers in their best imitation of Quintus Arrius that “We keep you alive to serve this ship. Row well and live.”


You would like a “snowgate” you say?  Don’t be silly.  The City of Thunder Bay has already decided what we need.  Keep rowing.