
Municipal ratepayers and property owners are most often concerned about increases in their property taxes. However, along with property taxes, there are also assorted fees and user charges that municipalities levy separately from property taxes which enable them to in a sense deflect from the increase in municipal property tax burdens on homeowners given that combined numbers are rarely if ever provided. Chief among those user fees in most Ontario municipalities is of course water and sewer/wastewater rates. The 2021 BMA Municipal Report provides an opportunity to look at recent levels of water and sewer rates as well as their recent growth. The levels are for an average residential household and a comparison is provided for 2015 and 2021.
As Figure 1 illustrates, the highest water rates in 2015 for 28 major Ontario municipalities are for Sudbury, Windsor and Thunder Bay and they range from $1,278 for Thunder Bay to $1,403 in Sudbury. At the bottom, are Timmins, Mississauga and Brampton which range from $590 for Brampton to $680 for Timmins. In the case of Thunder Bay, if you are an average bungalow and already paying nearly $4,000 a year in residential property taxes, the water and sewer rate is an additional 30 percent on top of your property taxes.
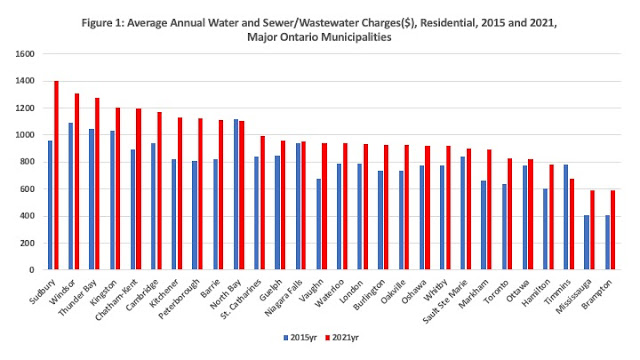
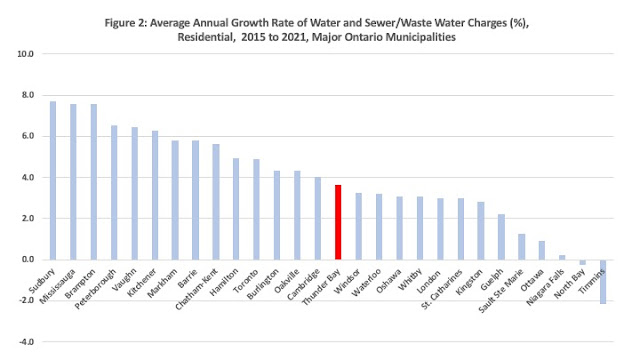
Figure 2 plots the average annual growth rate of water and sewer/wastewater charges in these same cities over the six years from 2015 to 2021 and also ranks them from highest to lowest. Whereas Thunder Bay is nearly at the top in terms of the level of the fees, it is mid ranked in terms of the growth rate since 2015 at about 3.6 percent annually. But then, over the period 2005 to 2015, Thunder Bay ramped up its water charges at an average of 9.5 percent annually - thereby bringing it up to the top of the level of charges in Figure 1. The current fastest growing eater charges are in Sudbury, Mississauga and Brampton while growth is currently the lowest in Niagara Falls, North Bay and Timmins - the latter two which have apparently seen a reduction in water rates. Mississauga and Brampton are of course currently at the bottom of the ranking in terms of levels and their infrastrucure is likely undergoing a catch up process given the rapid growth in both these cities.
In Thunder Bay, one does not expect water rates to decline anytime soon given the numerous water related issues that have plagued the city over the last decade ranging from massive flooding of the new water treatment plant about a decade ago combined with widespread flooding across the city as well to the current leaky pipe debacle affecting thousands of homes. In the end, both of these fiascos have generated lawsuits on the part of affected parties which if successful will generate costs for years to come.