Among the many
municipal statistics provided in the annual BMA Municipal Study is fairly
detailed comparisons of spending on municipal services. The aggregate number on which any comparison can
begin is what is known as the net municipal levy per capita (NMLPC). This is an estimate of what the spending need
for a municipality is to provide its services – as determined by the city administration and elected council – and ultimately is what feeds into required tax
revenues.
Now the BMA reports
are quite explicit in qualifying what a NMLPC measure can and cannot do and what its
limitations are. Spending per capita can
vary as a result of different service levels as well as type of service. There are also demographic and socio-economic
reasons why spending may vary across cities and per capita spending is simply
an aggregate and not an indicator of value for money. However, the BMA maintains that changes in
per capita spending reflects changes in total spending relative to population
and “Increasing per capita expenditures
may indicate that the cost of providing services is outstripping the community’s
ability to pay, especially if spending is increasing faster than the resident’s
collective personal income.”
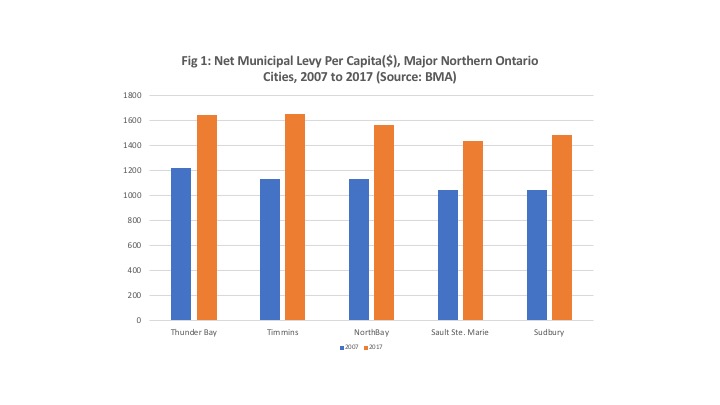
So, the accompanying
figure 1 shows the NMLPC for the five major northern Ontario cities for the
years 2007 and 2017. In 2007, the NMLPC was highest in Thunder Bay at $1,216
and lowest in Sudbury at $1,041. By
2017, spending was highest in Timmins at $1,651 (with Thunder Bay second at
$1,641) and lowest in Sault Ste. Marie at $1,434. If one compares the growth rates in the per
levy, they were actually highest in Timmins at an average of 4.6 percent
annually and lowest in Thunder Bay at 3.5 percent annually.
However, in all of
these cities, per capita spending grew faster than population suggesting that
there was a deepening of per capita spending.
That could be the result of a desire to improve services or it can
reflect a weakening economic base and the spreading of costs across fewer
people. Over the last ten years,
population actually shrank in four out of five of these cities – the exception being
Sudbury which saw its population rise 2.3 percent over the last ten years. Yet even in Sudbury, spending rose faster
than population given t per capita expenditure is growing.
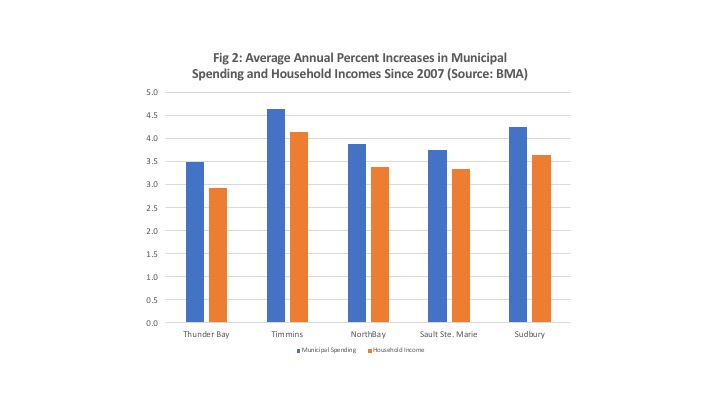
More interesting, is figure
2 which plots the average annual growth rates of the net municipal levy per
capita (from 2007 to 2017) and average household income (2010 to 2017). In all of these
cities, per capita municipal spending has been rising faster than average
household income. So, it would appear
that in all of these cities, municipal spending has generally risen faster than
both population and income. This suggests that recent years have seen municipal spending outstrip the resource base in these communities as measured by population and income. Indeed, sustainability for sub-national governments has been outlined as a key concern in a recent federal PBO report. Municipal
ratepayers in all five of these cities should be asking how candidates for
their ideas on how they plan to address the fiscal sustainability of their
cities?