Saturday 2 December 2023

Thunder Bay's Economy: The Year Forward and Back


As 2023 winds down and 2024 arrives, a retrospective combined with a look ahead on the economy is a timely exercise.  The economic indicators to date for 2023 suggest that Thunder Bay has had a very good year.  Average monthly employment in 2023 to date is up about 3 percent over 2022 – representing nearly 2,000 new jobs.  However, while average monthly employment appears to have recovered from the pandemic, it has yet to permanently surpass the 2018 level.  However, on the plus side, the accompanying figure suggests that Thunder Bay’s employment does appear to be on a modest longer-term upward growth trend after years of being seemingly flat.  As well, the seasonally adjusted unemployment rate remains around 5 percent and the average for 2023 is lower than 2022 which suggests that the local labor market does not have a lot of slack in it.  


Along with employment opportunities being generated in large public sector construction projects in both the city and the region, there is also substantial activity in the local retail and tourism /hospitality sector with the opening of new retail and food service outlets as well as a very successful cruise ship season.  The port has also seen growing grain shipments as Thunder Bay resumes much if its traditional role in Canada's grain transport network.  On the housing front, while starts are not at historic highs, there nevertheless has been substantial activity particularly in the multi-residential unit sector.  Overall, Thunder Bay has seen healthy economic activity despite the recent rise in interest rates.  This is the result of continued activity in its traditional sectors of construction, forestry and port activity combined with activity on the mining front. As a result, population can be expected to grow albeit at rates still well below provincial and national growth rates.

Perhaps the biggest impact locally is the construction of Thunder Bay’s $1.2-billion provincial jail which until completion in 2025 will drive Thunder Bay’s labor market and economy even if the Canadian economy slows down in 2024. At the same time, the massive project has complicated the availability of local trades people with lengthy waiting lists for electricians, plumbers and carpentry services for smaller projects and home renovations assuming that you can even get trades people to agree to come.  However, completion of the jail project will likely see a ramping down of economic growth in the economy and in the absence of equally large new projects some alleviation of a relatively tight labor market particularly in building trades.

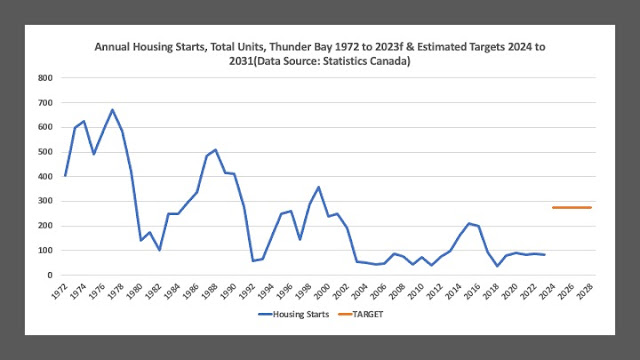
According to the Conference Board of Canada, housing starts in Thunder Bay are expected to grow but the numbers in their forecast seem unlikely to meet the 275 annual units required to meet provincial targets.  Nevertheless, Thunder Bay appears to be pressing forward with plans to apply for federal funding to build two thousand homes over the next three years - over 600 new units a year.  An average of 600 to 700 new homes a year is an amount that has not been seen in Thunder Bay since the baby boom years of the 1960s and 1970s.  Ultimately the success of such a grand scheme depends on local demand and this depends on what interest rates are like, what the state of the economy is and whether people have the incomes and purchasing power to pay for the housing.  Never mind if enough building trades people are available to actually do the work.

Going into 2024 and as noted in the most recent Conference Board Report, one can expect to see employment growth in construction, transport and warehousing, health care and social assistance, accommodation and food services and public administration.  Other sectors such as manufacturing, utilities, professional and scientific services, and educational services are expected to remain flat or even decline slightly.  Declines can particularly be expected in the areas of educational services given regional demographics and public funding levels, as well as the local FIRE sector (finance, insurance, real estate) given the rise in interest rates.  The post-secondary sector in Thunder Bay is also in uncertain territory given the dependence on volatile flows of international students and lack of clarity from the provincial government as to what directions in funding it may pursue in the wake of the Blue-Ribbon Panel Report. While the Blue-Ribbon Report called for increases in tuition and the provincial government grant to post-secondary institutions, the government’s response to date has been to continue to seek efficiencies which means the structural problems of university finances are unlikely to be resolved anytime soon.

Going forward there is also some economic uncertainty on several fronts.  It remains to be seen what the long-term outcome of the sale of Resolute Forest Products to Atlas Holdings will be on both local production and employment levels.  The future of the Alstom plant is also always precarious in the absence of a major transit project to generate longer-term employment.  As for the future of lithium refining in the region by companies such as Rock Tech Lithium, Toronto’s Avalon Advanced Materials and Green Technology Metals of Australia, there are positive expectations that these projects will finally trigger the long-awaited mining boom given the flurry of recent announcements and media stories. 

However, despite purchases of waterfront land, to date these are all plans, and the industry appears to be waiting for public money to assist their development.  It is unclear if any of these companies will be able to raise the necessary funds either publicly or privately to finance their activity in the face of international competition in the industry with other players with their infrastructure needs already in place.  As well, demand for fully electric vehicles – a key driver of the demand for lithium – has also been exhibiting weakness given the cost of the vehicles, their range, the availability of charging facilities and competition from alternatives such as hybrids as well as traditional gasoline powered vehicles.  As a result, the lithium refining industry in Thunder Bay and Canada while hopeful in its signs, may remain a work in progress for the foreseeable future.

Of course, in terms of what Thunder Bay can do to deal with all these changes and the economic uncertainty does not have a simple answer.  Thunder Bay, much like Canada as a whole, is a small economy unable to influence global economic and political trends beyond its borders.  Nevertheless, given the current buoyancy in the local economy, it is important to make hay while the sun shines.  Going forward, Thunder Bay must continue to make itself as attractive a jurisdiction for business investment as it can.  That means continuing to provide quality of life amenities, a range of useful and timely services for all demographic groups and a competitive local municipal service and tax environment.  Needless to say, at particularly at the municipal level, there will be a need to provide more while keeping the tax burden down – a tall order to fill at the best of times.

Wednesday 22 November 2023

What the Federal Economic Statement Did Not Highlight


Well, the Federal Fall Economic Statement for 2023 is out and soon to be relegated to the collections of fiscal and economic history.  There is a lot out there summarizing the economic and fiscal situation facing the federal government. Briefly, for 2023-24 it looks like revenues of $456 billion and expenditures of $489 billion for a deficit before actuarial losses of $32.5 billion and a deficit with actuarial losses of $40 billion.  Inflation this year will be about 3.8 percent and next year the outlook is for 2.5 percent while real GDP growth in 2023 is now forecast to end up at a lower 1.1 percent and for next year at a paltry 0.4 percent.  On the bright side, there are measures to create more housing, but they add up to perhaps 300,000 homes by 2031 which given the country apparently needs 3.5 million means the housing shortage is going to be around for some time to come. 


Two things the numbers on the fall statement do not highlight.  First, when one factors in population growth going forward at about 2.5 percent annually and the government's inflation and GDP growth forecasts, real per capita GDP is going to continue declining over the next five years.  As Figure 1 shows, by 2028, inflation adjusted output per person by 2028 will be lower than it was in 2014.  Given the anemic business investment in Canada and the resulting weak productivity performance of the Canadian economy and its inability to grow faster than population, falling real GDP per person means a declining standard of living.  We are looking at essentially a lost decade or more if nothing happens to ramp up growth.


Second, a fiscal anchor or guardrail set as a deficit to GDP ratio of 1 percent means that there will be perpetual deficits for years to come of at least 30 billion dollars.  Put more starkly as Figure 2 illustrates, federal revenues and expenditures will continue to grow in tandem like ships traveling alongside in the night but never actually meeting.  This will result by 2028 in a net federal debt of almost $1.5 trillion and debt service costs of about $60 billion annually which as a share of federal revenue will account for about 10 percent of revenue.


Needless to say, it is not surprising that these types of projections are not front and centre from the perspective of a government facing slowing growth and rising spending.

Saturday 18 November 2023

Solving the Homelessness and Housing Crisis


As rents soar in Canada and encampments spring up in cities across the country, it is evident that the country faces a housing crisis which to date seems intractable.  Even the recent slowdown in home prices does little to improve the situation given that average housing prices in Canada remain just shy of $700,000 with prices varying across the provinces. Average housing prices in Greater Vancouver are just shy of $1.2 million while Greater Toronto is slightly less at $1.1 million.  And while at an average of $322,000, Thunder Bay seems more affordable compared to Toronto and Vancouver all of these averages mask the variation in prices around the average that realistically means something half decent that you may actually like is always substantially above the average. 


However, the housing and homelessness crisis and what has been termed the housing shortage is not really just about the price of an average house.  There are a number of issues here.  First, there is actually not a “shortage” of houses and apartments per se as a glance at any real estate listing in cities shows that there are always houses for sale or apartments for rent.  However, the price or rents of those housing units are well above what individuals are either able or willing to pay especially given the recent rise in interest rates which has increased the cost of home ownership in particular. One could term this a crisis in affordable housing rather than a shortage of housing. Second, there is the issue of homelessness which has manifested itself with rising numbers of people in cities across the country living in tents and encampments.


Solving these issues requires a two-prong solution.  First, dealing with affordable housing.  The sudden drive to expand the supply of housing to make it affordable is certainly a potential long-run solution. However, in the end building more $1,000,000 homes in suburbs, which developers like to do because they can make a lot of money, really does not solve that problem. Moreover a $1,000,000 new build home program does not solve the housing affordability problem unless it is done so incompetently by the private sector that they create a glut that drives prices down which seems unlikely.  Developers across the country over the years have learned that you just do not build a couple of hundred homes in a subdivision and then sell them – you build on spec with a large deposit.  Basically, every new home built already has someone lined up for it.


The solution to the affordable housing is the building of either rent-geared-to-income housing or the building of standardized-government subsidized housing units (much like the Wartime Homes Program) whose design, construction and sale is also geared to income.  One example of this is the standardized house designs being put forth by the government of British Columbia which could serve as a template for other provinces. This will enable homes to be built more quickly but it could also serve as a model for lower cost housing designs. As for rent -geared-to-income, all new apartment builds should have portions of the building ranging from 10 to 20 percent of rent geared to low and middle incomes with government social housing subsidies providing the incentive to builders. This is preferable to simple erecting mega projects of low-income apartments in neighborhoods that essentially creates clusters of low-income individuals.


In a sense, the Ontario government’s current approach to increasing housing supply by providing incentives and powers to municipalities to simply expand housing stock does not follow either of the above approaches.  Take the case of Thunder Bay where the target is to build over 2000 homes by 2031 according to the provincial target but given that the target has been exceeded in 2023 it is now seeking to build (with federal funding of course) 2000 homes over the next three years.  The optics tout this as a success story and the start of a housing boom fueled by mining but the 167 units for 2023 (which exceed the target of 161) is largely driven by projects already planned or underway and 60 of the units (plus another 60 which have started) are apartments being marketed as “luxury” apartments.  It means the rents for the smallest units will easily be over $2000 a month.  This will not be ‘affordable” housing given the cost-of-living crisis that has gripped the nation and its media.  Moreover, the target going forward is ambitious given the past track record of housing starts in Thunder Bay to date which given the cities rate of population growth to date has been modest. 


The other housing crisis – homelessness. -will not be solved by new suburban housing developments, neighborhood infill, or luxury apartments.    It is an entirely different problem all together.  The solution here is best modeled on what has been done in Finland where a non-governmental organization (NGO) called No Fixed Abode founded in 1986 reduced the number of homeless in Finland from 20,000 to about 3500 at present. Note that Finland’s population is 5.5 million and there are currently 3500 homeless people estimated.  In Canada, just Hamilton Ontario with a population of 579,000 has an estimated 1,500 homeless.  As well, since 2008 Finland has also embraced another program called Housing First which creates flats in social housing complexes that along with serving as places to live also provide a fixed address for those requiring access to government services and supports.


Now, Finland is not Canada and simply grafting another country’s solution to solve your problem can generate all kinds of problems. However, there is something here that needs to be explored.  Some of all the money that is going to be thrown at simply increasing housing stock irrespective of whether or not people can afford it needs to be directed to what I would term Transitional Emergency Housing.  People living on minimum wage or are evicted from apartments and have no place to live need some place to get back on their feet.  Boarding houses with rooms to let used to be a place where people of limited means often ended up til they got back on their feet, but no such places really exist anymore. People who are homeless need to be housed and housed without questions being asked.  Creating a complex or dispersed network of complexes of transitional emergency housing with very small personal units combined with social support such as a community kitchen, social workers and even a nurse practitioner and mental health workers and basic security on site would be one way of dealing with the homelessness crisis. 


Where to locate such complexes?  They need to be built on a scale that reflects their local neighborhood and are close to where many homeless choose to locate because of amenities – often downtown cores.  Most municipalities own land in their downtown cores that could be used for such a purpose. They will not be cheap to operate but realistically what else is the solution?  Simply leaving the problem to grow does not solve the problem.  Throwing money on market rent apartments and suburban subdivisions does not solve homelessness, never mind, really create affordable housing. Using resources in a wise and targeted way is the solution to both housing affordability as well as homelessness. True, perhaps these are the ravings of simple economist who does not fully grasp the complexity or enormity of the problem.  On the other hand, perhaps not.

Friday 17 November 2023

House Prices Are Coming Down


The latest house price figures have been released by the Teranet-National Bank House Price Index for major Canadian metropolitan centres in Alberta, British Columbia, New Brunswick, Manitoba, Nova Scotia, Ontario, and Quebec. According to Teranet:


After adjusting for seasonal effects, the Teranet-National Bank Composite House Price Index™, which covers the country’s eleven largest CMAs, declined by 0.4% from September to October, the first decrease following five consecutive monthly increases. In October, four of the 11 CMAs included in the index experienced decreases: Toronto (-1.6%), Edmonton (-1.2%), Vancouver (-1.1%) and Ottawa-Gatineau (-1.1%). Conversely, notable increases were recorded in Montreal (+3.7%), Halifax (+1.1%) and Winnipeg (+1.0%). On the other hand, decreases were observed in 11 of the 20 CMAs not included in the composite index for which data are available in October. The biggest monthly decreases were seen in Saint John (-5.3%), Trois-Rivières (-3.3%) and London (-2.5%). Conversely, the biggest increases were in Moncton (+4.6% after a 2.3% drop the previous month), Kingston (+3.8%) and Peterborough (+2.6%).

The month over month figures for October show decline in most centres but the more interesting numbers are the declines from the peak price.  Peak price for most of these cities occurred in Spring of 2022 though Calgary and Saint John appear to have seen peaks in 2023. The accompanying figure shows that no one has seen a price increase since the peak though Sherebrooke, Quebec City, Moncton, Lethbridge, and Calgary appear to be perfectly flat since their peak.   


As for the remaining cities, the percent change since peak price range from -2.7 percent for Montreal to -18.6 percent for Brantford.  Thunder Bay is in the company of cities with relatively small declines coming in at -3.6 percent while Sudbury is a bit more coming in at -9 percent.  

Monday 13 November 2023

Tracking Thunder Bay’s Economy: Another View


As 2022 begins to wind up, it is worth taking a look at how Thunder Bay’s economy is doing using less traditional indicators to shed light not only on its economic performance but the perennial question of whether its population is growing or not.  One way of looking at Thunder Bay’s economy and making some comparisons to other centers is the use of Tax Filer data available from Statistics Canada. The number of T1 Tax Filers can be used as a correlate of not only population numbers but also incomes and economic activity.   


Figure 1 plots the number of tax filers by year from 2000 to 2001 in the Thunder Bay CMA with a linear trend.  There has definitely been some growth in the number of tax filers over the last few decades. From 88,240 T1s filed in 2000 to 92,660 in 2021, Thunder Bay has seen a 5 percent increase in the total number of tax filers between those two years though numbers do fluctuate from year to year.  Thunder Bay’s CMA population in the 2001 Census was 121,986 and its CMA population in the 2021 Census was 123,258 – an increase of 1 percent.  One would expect the number of tax filers reporting income is somewhat a more robust count than the number of people filling out the census at least in terms of compliance. 


If the 5 percent growth Tax Filer growth rate was applied to Thunder Bay’s population in 2001, then in 2021 one would have a CMA population of 128,085.  So, in response to the question of whether or not there are more people living in Thunder Bay than the official census count states, the answer it is perhaps so.  Even so, it is not the tens of thousands of people that seems to have seized the imagination of local politicians lobbying for more resources.  At least that is assuming that these tens of thousands of additional people have employment and are reporting an income.  Of course, if they are not working and therefore not reporting an income or are working and not reporting an income, well those are entirely different matters that should definitely concern the federal and provincial governments.


Delving deeper into the numbers, Figure 2 plots the average annual growth rate of the number of T1 Tax filers over the period 2001 to 2021 for Thunder Bay, as well as Toronto, Hamilton, Greater Sudbury, and Ontario as a whole.  It appears that Thunder Bay’s average annual tax filer growth rate is well below that for Ontario and Toronto but also Hamilton and Greater Sudbury.   Thus, another indicator that while we are growing, we are not growing as quickly as other population centres. 


Finally, Figure 3 plots average annual T1 Tax Filer Income and it illustrates that while average income has grown, Thunder Bay is below Ontario and also below the other three comparison cities in the chart.  As of 2021, average tax filer income in Thunder Bay is $53,289 compared to $56,691 in Greater Sudbury, $57,936 in Hamilton and $59,410 in Toronto with the average for Ontario at $56,893. Given that average rents and cost of living in Thunder Bay have grown to levels not incomparable to southern Ontario cities, this would suggest that many in Thunder Bay are currently quite stretched when it comes to their finances.


So, there you have yet another set of performance indicators on Thunder Bay’s economy. 

Wednesday 8 November 2023

Adam Smith and the Federal Carbon Tax


Canada’s modern tax system is really the result of over a century of impromptu tax policy driven by the events of the day.  After all, the modern system was hastily thrown together in about a five-year period from 1916 to 1921 in order to generate revenues for pursuing Canada’s role in the Great War and gave us the personal income tax, the corporate income tax, and the federal sales tax.  The most serious efforts at some type of over-arching and comprehensive tax reform driven by principles, theory and analysis were probably the Royal Commission on Taxation or Carter Commission (1962-1967) and the White Paper on Tax Reform Wilson Reforms (1987).


With respect to the Carter Commission, commentators of the day remarked it was “marked by lucidity of analysis, candor in exposing its presuppositions, fairness in the presentation, of alternatives, and modesty in disclaiming infallibility. It is, in short, not a White Paper designed to prop up a debatable fait accompli, but a work of scholarship, culminating in recommendations for action, that frankly acknowledges when it moves beyond the boundaries of objectivity and expertise, rather than seeking to blur or shift these limits” (Bittker).  The Carter Commission stressed simplicity, fairness and balance but opposition to the specific reforms proposed was intense and implementation was generally lacklustre though the current integrated approach to personal and corporate taxation was a long-term result (Norquay). 


The Wilson White Paper, despite the view of some that it was to justify a fait accompli, on the other hand was a much more successful effort at tax reform and it implemented the Carter Commission mantra that the base for income taxation be broadened and the rates lowered (Norquay) and created a three-bracket personal income tax system with lower rates than the previous system with many more brackets and higher rates.  Key principles underlying the reforms were fairness, equity, and incentives for work and investment.  However, the Wilson reforms were two pronged and along with income tax reform it also replace the flawed Federal Sales Tax known as the Manufacturer’s Sales Tax (MST) with the new GST.  The benefits of the income tax changes were quickly forgotten when the GST came along several years later with political repercussions for the governing party of the day that are now history.  While the GST was a well-designed tax that broadened the base, it was highly visible replacing the hidden MST which was built into the price of manufactured items and a millstone around the manufacturing sector’s competitiveness. Despite the analysis and principles, the Wilson Reforms ultimately paid a political price though they remain in effect for the most part today.


Which brings us to the current federal carbon tax or more specifically the recent federal intervention exempting home heating oil from the federal carbon tax in Atlantic Canada which has generated a wave of dissatisfaction a mare usque ad mare. The basic economic principles behind the current federal carbon tax were generally sound.  Most economists agree that if you want more of anything, you should subsidize it whereas if you want less of anything, you should tax it.  Public finance theory puts forth in the case of activities with negative external effects such as pollution, the Pigouvian tax which raises the cost of the offending activity and therefore internalizes the externality.  Now the federal carbon tax was designed to discourage the use of fossil fuels and help fight climate change and is generally a pretty good example of a Pigouvian tax though with the added twist of rebates primarily to lower incomes to help with the more regressive effects of consumption type taxes.


The decision by the Trudeau government to placate Atlantic Canada generally undermines the role of the current carbon tax as a tool against climate change and indeed threatens to unravel the whole thing.  Hell, hath no fury like a taxpayer not exempted from a tax when others are, and the federal government will likely reap a political price for what seems to be a pretty brazen attempt to shore up regional political support.  All of this would have been avoided if the federal government had paid just the least bit of attention to past efforts at tax reform and tax change offered by the Carter Commission or the Wilson Reforms.  Terms like “fairness and balance” or “fairness and equity” come to mind from those past forays into taxation changes.  Perhaps those efforts were too complicated for the current federal government?


One can go further back for tax advice, all the way to Adam Smith’s Wealth of Nations where he elucidates quite clearly and simply on what makes a good tax system and provides the four: “Maxims of Taxation.” Namely:


I.               The subjects of every state ought to contribute towards the support of government, as nearly as possible, in proportion to their respective abilities. (Equality)

II.              The tax which each individual is bound to pay ought to be certain, and not arbitrary. (Certainty)

III.            Every tax ought to be levied at the time, or in the manner in which it is most likely to be convenient for the contributor to pay it. (Convenience of payment).

IV.            Every tax ought to be so contrived as both to take out and to keep out of the pockets of the people as little as possible, over and above what it brings into the public treasury of the state. (Economy in collection).


The Trudeau government’s move to exempt home heating oil in Atlantic Canada but not all sources of home heating wherever they may be in the country adds porosity to the tax that will create a clamour for more exemptions given that many view the current exemption is both unfair and arbitrary.  One can debate whether it takes out of people’s pockets as little as possible.  If fighting climate change is as important as the government claims it is, then this exemption illustrates a retreat from core principles.  In the end, fighting climate change when necessary but not necessarily fighting climate change suggests not a principled government but an opportunistic one. 


Friday 3 November 2023

Ontario’s 2023 Fall Economic and Fiscal Statement: Some Thoughts


Finance Minister Bethlenfalvy released Ontario’s fall 2023 fiscal and economic update and a perusal of the numbers tells a number of stories.  First, the province is expecting the economy to slow down with consequent effects on its revenues though the current outlook for the current fiscal year 2023-24 shows tax revenues up just over 3 percent while 2024-25 and 2025-26 are currently projected at growth of 3.3 and 6.1 percent respectively.  Indeed, the period from 2022-23 to 2024-26 is expecting to see total revenues up 14 percent.  Over the same period total program spending is expected to rise  by 8.5 percent, debt interest by 22.6 percent and total expenditure will be up by 9.4 percent. 


Thus, revenues are projected to grow faster than expenditures but the gap between revenues and expenditures will persist until 2025-26 when a small surplus of 500 million dollars is forecast.  However, given spending that year includes a reserve of $2 billion set aside, it is likely the surplus that year will be much bigger. An economic slowdown notwithstanding, the province appears to want to keep a deficit on the books for as long as possible no doubt in part as a cautionary measure given economic uncertainty but also to quell demands for more public spending.  And as for economic uncertainty, employment is expected to grow each year until 2026 and the unemployment rate at its highest will reach 6.6 percent before declining to 5.8 percent by 2026. Hardly the recessions and downturns of yesteryear.


However, two items did catch my eye.  First, for 2023-24, the net public debt is expected to take a bit of a leap to $416 billion.  From 2018-19 to 2023-24, the net debt will have grown from $338 billion to $416 billion, an increase of 78 billion dollars or 23 percent.  However, deficits over that same period only sum to $42 billion.  In other words, an amount over and above the sum of accumulated deficits of $36 billion has been added to the net debt.  While this is of course likely the result of current government accounting practices that book capital and infrastructure expenditures separately from the operating expenditures, it is nevertheless a sizeable increase to see. 


More seriously, is the following.  If one takes past, current, and projected nominal GDP for Ontario, factors in inflation using the CPI as well as assumes population growth going forward at the medium Finance Ministry scenario of 250,000 people a year (about 1.7 percent), one gets a picture of real per capita GDP in Ontario that suggests that by 2025, real per capita GDP will be no higher than it was in 2017.  If one looks at the accompanying figure, despite ebbs and flows (with a particularly large ones circa the pandemic) as well as the early 1990s) real per capita GDP growth has been noticeably slower since about 2000.  The average annual growth rate in real per capita GDP from 1960 to 1999 averaged 2.1 percent while from 2000 to what is projected by 2025 the growth rate is 0.5 percent. 


You can blame some of this on population growing more quickly over the last few years, but the real culprit is that productivity growth in Ontario is lack lustre.  The long-term effects of productivity decline have begun to manifest themselves in our standard of living.  Real per capita GDP in 2022 in $2020 is $64,170.  If since 2000, real per capita GDP had grown at the average annual rate from 1960 to 1999, in 2022 it would be about $86,000 – that is a difference in output of nearly $22,000 per Ontarian.  It is not apparent that this stark difference has sunk in yet across political and policy circles in Ontario.  We have foregone a lot of output given our productivity decline and in the absence of a shift, that amount will only continue to grow.


Friday 27 October 2023

Monster Mash or Cournot Nash?


Well, the season of Halloween is upon us and the music of the season is certainly something that we all have memories of over the years.  Of course, one of the most famous songs was Bobby “Boris” Pickett’s Monster Mash which was a smash hit in 1962.  This was his most famous song and later attempts to emulate its success were not as successful.  Nevertheless, it has inspired a host of replications and imitations ranging from this one on Sesame Street to this one or even this.   Well, I have been feeling particularly whimsical this week and in the spirit of the season, with a little help from my AI, I decided to see if I could adapt the lyrics to an economics theme - specifically a song about Cournot-Nash equilibrium.  After all, Monster Mash-Cournot Nash – they both have a certain lilt to them.  So, without further ado, take a look at the results.  Of course, please feel free to perform it, make a video and send it along!


In the land of game theory, where minds collide,
There was a concept, Cournot-Nash, they could not hide.
Firms strategized, each aiming to improve their gains,
Seeking equilibrium, where competition remains.

They did the Nash, they did the Cournot Nash,
The Cournot Nash, it was an equilibrium bash.
They did the Nash, it was a game theory smash,
The Cournot Nash, a most strategic clash.

Players in a market, with goods they'd supply,
In Cournot's world, they chose how much to magnify.
Each one anticipating, their rival's every move,
Balancing their choices, in a dance they would prove.

They did the Nash, they did the Cournot Nash,
The Cournot Nash, it was an equilibrium bash.
They did the Nash, it was a game theory smash,
The Cournot Nash, a most strategic clash.

Fierce competition, but still a sense of peace,
Cournot equilibrium, where conflicts find release.
Finding the optimal output, they would ascertain,
With profit maximization, the ultimate aim.

They did the Nash, they did the Cournot Nash,
The Cournot Nash, it was an equilibrium bash.
They did the Nash, it was a game theory smash,
The Cournot Nash, a most strategic clash.

So let's explore the strategies, in this grand parade,
Game theory teaches us, how choices are made.
In Cournot's footsteps, we can understand the game,
And dance to the beat of equilibrium's fame.

They did the Nash, they did the Cournot Nash,
The Cournot Nash, it was an equilibrium bash.
They did the Nash, it was a game theory smash,
The Cournot Nash, a most strategic clash.


Sunday 22 October 2023

A New Research Project in the North and for the North


Northern Ontario has faced demographic and labour force challenges for several decades now.  Northern Ontario accounts for 90 percent of the province’s land mass but only about 6 percent of its population and though overall population appears to have stabilized since 2016, that share of population continues to decline as the rest of Ontario grows faster than its north.  To this long-term trend has been added the impacts of technological change and the digital economy as well as the effects of the COVID-19 pandemic.  As a result,given its aging population structure, issues of labour shortage have also come to mark the northern Ontario economy.


How to attract and retain labour in northern Ontario in both the short and long term is a pressing issue for the future growth and welfare of this diverse and sparsely populated region.  To date, much of the literature on labour force shortages and migration has been descriptive.  What factors are important in attracting and retaining population and labour forces in northern Ontario?  Given the presence of a substantial post-secondary education sector in the region, what factors and determinants are crucial in retaining skilled graduates for the labour force of the future.? To this effect, a pan-northern research team (of which I am pleased to be a member of) has begun a research project to address these questions and has obtained Social Sciences and Humanities Research Council of Canada (SSHRC) grant funding to help obtain some answers.


The project is titled “Northern Ontario Labour Force Retention and Attraction in a Post-Pandemic, Digital Economy.”   This is a broad-based survey project building on a pilot study that investigated factors influencing  local graduate retention rates for Algoma University in Sault Ste. Marie. The pilot developed and tested a survey and then completed a review on labour retention policy in the region. This research project scales up the investigation of graduate retention and contributing factors to migration in Northern Ontario, and the retention rates of all the region’s post-secondary institutions to identify factors influencing the regional retention of graduates qualified to fill labour shortages. Of special interest are the region’s unique demographic patterns, push and pull factors, migration networks, labour attraction and retention policies, and leveraging graduates’ temporary work permits.  A combination of student and  graduate surveys, focus groups, and secondary data will be used to examine the significant factors of graduate retention and ultimately aims to develop recommendations for how the region can retain more of its existing skilled labour pool and attract more skilled migrants. The study will also investigate the effectiveness of the Rural and Northern Immigration Pilot (RNIP) program in graduate retention.


The research team is interdisciplinary and includes social and community development experts, Northern Ontario economists, and labour market experts. The university-based research team includes Dr. Nusrate Aziz (Algoma) as Principal Investigator, Zeel Patel (Algoma) as Senior Research Assistant, Dr. Sean Meades (Algoma), Dr. Sadequl Islam (Laurentian), Dr. Livio Di Matteo (Lakehead) and Dr. Natalya R. Brown (Nipissing).  To date the project has also hired two students (Alex and Kashfia) – one based at Laurentian University and the other based at Lakehead University - to assist with the conduct of surveys targeting students enrolled in 3rd, 4th, and 5th year (graduate) studies as well as focus groups involving university and college level staff and administrators involved in recruitment and retention initiatives.  The surveys have begun, and the subsequent pool of data will yield a rich source of socio-economic data on a demographic vital to the future prosperity of northern Ontario. If you are contacted by our team for input, we hope you will take the time to help us out. 


Saturday 7 October 2023

The Recession That Was Not There


Yesterday upon the stair,

I saw a recession that was not there,

It was not there again today,

I wish, I wish, it would go away.


With apologies to William Hughes Mearns, Antigonish 1899.


The release of yesterday’s employment numbers by Statistics Canada once again threw a wrench into the ranks of those who have been predicting a recession by revealing a continued resilience to the Canadian economy’s job generation machine.  Total employment in September of 2023 was 20,270,000 – an increase of 0.3 percent over the previous month with 64,000 jobs created.  There were of course both gains and losses across regions and sectors with Quebec and British Columbia seeing the biggest employment increases while Alberta and New Brunswick saw declines. 


As well, there were increases in employment in education, transport and warehousing and declines – not surprisingly given the slowing housing market – in finance, insurance, and real estate.   Nationally, the unemployment rate remains unchanged at 5.5 percent.  When one adds to this the fact that the U.S. economy in September added over 300,000 jobs and their national unemployment rate remained unchanged at 3.8 percent, one has to come to the conclusion that the North American economy is still quite robust despite the unprecedented surge in interest rates over the last year. 


Despite the ever present and mentioned spectre of recession with numerous forecasts and projections painting dire scenarios it remains that the recession is not here yet unless of course we are planning to redefine the context within what the definition of a recession is.  After all, the most recent GDP release also showed that as of July 2023, the economy was flat, neither up nor down. And one forecaster has said the economy will get “back on its feet” next year after a few negative quarters that will see the unemployment rate hit 5.9 percent followed by an easing of interest rates to the 3 percent range.    If a 5.9 percent unemployment rate is the worst this recession will bring, then one must wonder if a recession has simply become a psychological mindset perpetuated by endless speculation and anxiety of hard times to come. 


After all, as the accompanying figure shows, both interest rates and unemployment rates have been much higher during past recessions.  The 1981 and 1991 recessions both had much higher interest and accompanying unemployment rates than anything at present.  And notwithstanding the COVID spike in unemployment, unemployment rates have trended down since the 1990s and remain at close to historic lows bettered only by those of the mid 1960s. I suppose the only remaining case for a recession coming is that in both of those recessions, interest rates spiked and remained high for quite some time before unemployment finally surged.  Still, a forecast of 5.9 percent unemployment because of the current spike in interest rates does not seem like a recession at all when placed in historical context.


Still, the Bank of Canada’s next interest rate decision has been complicated by this much stronger economic performance and inflation still in the four percent range.  Moreover, with the sudden new instability in the Middle East, one can expect oil and gasoline prices to spike meaning inflation is unlikely to go down anytime soon.  Inflationary pressure is also being fueled by wage increases in the 5 percent range.  Indeed, Statistics Canada reported that incomes in general have been rising particularly in the bottom two income deciles as a result of wage gains for workers as well as increased benefits for retirees. 


Indeed, when one factors in all transfers to individuals including not only higher social security benefits and what is essentially a basic income for lower incomes with children via the Child Tax Benefit, it appears that disposable income in the bottom 20 percent has increased 20 percent. And, much of this goes to consumption spending as studies have suggested that lower income deciles have higher marginal propensities to consume and lower propensities to save.  Meanwhile, another Statistics Canada report suggests that the economy is doing better because of rising exports. Given the strength of the U.S. economy, that is not a surprise. Then there is the rising population and its associated demands on the economy.  Put it all together, and one cannot but help conclude that there is still a lot of inflationary stimuli being pumped into the economy.


Recession?  At present, the coming recession is a mere spectre, a mythical beast that is conjured up but is not there.


Sunday 1 October 2023

Thunder Bay, Burlington, Windrows and Civic Darwinism


Winter is approaching and it continues that compared to Thunder Bay, some southern Ontario municipalities are way ahead of the game when it comes to dealing with the lethal combination of climate change and aging populations.  In recent years, Thunder Bay has been getting heavier and wetter snowfalls which in the aftermath are quickly compacted into thick ice on residential streets.  Once the city snowploughs come through the neighborhood, usually several days after the snowfall, the result is a windrow at the end of one’s driveways.  Notwithstanding the snow already in one’s driveway, increasingly, we are not looking at six inches to a foot of snow left behind but massive walls of ice and snow which even a heavy duty snowblower is challenged to deal with.  The result for young and old alike is a period of massive exertion to exit one’s driveway which increasingly has been found to culminate in cardiac events not conducive to one’s longevity.


Now this blog has brought the issue of windrows up before but obviously to little avail in Thunder Bay.  A 2021 blog post noted that even Ignace Ontario was apparently getting its municipal snow grader outfitted with a “snowgate” while at the time it was noted that other cities in southern Ontario such as Richmond hill, Markham and even Toronto had windrow removal programs in place.  To this list can now be added the City of Burlington Ontario which according to a story in the Hamilton Spectator appears to have moved beyond a targeted windrow removal program (for seniors or people on disabilities) to a more general program that naturally comes at a charge.  As the story reads:


Burlington city council has approved enhancements to its program to clear snow left behind by plows, including increasing the number of available spots from 200 to 1,000 driveways.

In addition, service boundaries will expand to include all areas of the city.

As part of the city’s windrow program, crews will clear windrows within 36 hours of snowfall stopping and within 12 hours of residential road plowing. A windrow is the pile of snow that is left at the bottom of driveways by roadway plows.

Residential road plowing only occurs after accumulation of 7.5 centimetres or more of snow. Windrow-clearing services will run from Dec. 1, 2023, until March 31, 2024. A non-refundable fee of $125 plus HST per driveway entrance for the entire season must be paid at the time of registration.

In years past, the program was only offered to people with disabilities and individuals unable to clear their windrows. As part of the program’s expansion, the city now has the capacity to offer spots to any resident.

The city will continue to focus on providing spots to people with disabilities. Previous registrants will be contacted over the next week to secure a spot in the program. Following that, advanced registration for people with disabilities will open on Oct. 5 at 9 a.m. Registration for residents city-wide will open on Oct. 19 at 9 a.m.


Now, one is not asking for the city of Thunder Bay to provide free windrow removal.  After all, Thunder Bay has pretty clearly stated what its priorities are when it comes to tax funded or assisted municipal services.  While Thunder Bay does spend one of the highest per capita amounts of major Ontario cities, it has chosen to prioritize three things: general government, police, and fire services.  Indeed, of 27 major Ontario municipalities, Thunder Bay historically spends the most dollars per capita of its of its tax levy supported operating budget on these three items.   Indeed, historically nearly 60 percent of Thunder Bay’s operating tax levy is spent on these three items - again, the highest of these 27 major municipalities.  However, the City of Thunder Bay does not even appear interested in pursuing an approach like that of Burlington where one could essentially pay for the windrows to be removed so after the residential street is ploughed.  It is probably too entrepreneurial an approach for a gvoernmental body in Thunder bay to attempt.  On the other hand, given Thunder Bay’s municipal cost structure, one suspects that even if such a service were offered, it would be substantially more expensive than what Burlington is planning to offer.


So, there you have it.  Winter is coming and with it Thunder Bay’s survival of the fittest approach to retirement living.  


Wednesday 20 September 2023

Strong Mayors and Housing: Thunder Bay Edition


Thunder Bay City Council this week did not support Mayor Ken Boshcoff’s desire to acquire “strong mayor powers” in a quest to meet provincial targets for housing and reap the benefits of associated funding support.  In some respects, this is not a surprise, not so much because members of council are so concerned about local democracy but because it does represent an erosion of their power given that strong powers on offer allow mayors to pass bylaws with the support of just one third of council, as well as veto bylaws passed by council on matters involving provincial priorities. In addition, the mayor will be able to propose the city budget, reorganize city departments and hire or fire the city manager and even some department heads. If anything, this represents a major potential increase in workload for the Office of the Mayor and one suspects there will eventually be some hiring to provide the necessary support.


Thunder Bay City Council because of its unique structure of at-large and ward councillors has always had councillors whose electoral mandate pretty much matched that of the mayor given they were elected by city-wide voters.  What the new changes mean in Thunder Bay and indeed in municipalities across the province is that the power structure has been unilaterally changed by the province in an effort to get the provincial housing agenda kick-started.  Indeed, going down the road, what some future mayor might do with such powers is a real concern. Nevertheless, it would appear that the mayor is going to ask for those powers with or without council support because the mayor wants to commit Thunder Bay to a target set by the province of 2,200 new homes by 2031.


This target is an interesting one because it means that over the next eight years (2024 to 2031), Thunder Bay needs to build an average of 275 new housing units annually.  The accompanying figure plots the annual number of housing starts from 1972 to 2023 and also plots the annual target set at an average of 275 units per year.  The 2023 estimate is incomplete given that the numbers from Statistics Canada only go to August and the monthly average based on January to August is used to fill in the rest of the year.  Even that total seems an underestimate given the couple of large apartment projects that have emerged that might double the total for 2023.  


Needless to say, the target is an ambitious one given that since 2000, the annual average works out to about 105 units per year.  In other words, going forward, it will be expected that Thunder Bay has to achieve just over 2.5 times the number of starts than it has managed on average over the last two decades. 


Can a strong mayor somehow wield the influence and power to more than double the number of housing starts in Thunder Bay?  Given the shortage of building trade workers as well as the fact that for the houses to be built, there has to be a demand for the housing and interest rates have spiked at the moment, it will be a challenge.  Then there is the ability of developers to earn a profit on the new builds whether single detached houses, apartments, or condos, even with whatever financial support the province has in mind.  Again, one suspects this target may be a tough one to reach.  A lot depends on whether or not there really are a lot more people in Thunder Bay than official counts say there are and if those people are actually interested in permanent housing in Thunder Bay and more importantly have the ability to pay for it either as owners or renters.


One suspects that in the end, the real influence of strong mayor powers in Thunder Bay will not be so much on the future housing stock but on things like the city budget and even senior staffing.  The mayor’s position is about to get more important and as the adage goes, with great power comes great responsibility.