A recent set of
statistics published on the real estate site Zoocasa has attracted a fair amount of
attention in the media
and ultimately even in Thunder
Bay. The data for these Ontario
municipalities includes the property tax rate, the average value of homes and
tax calculations for some standardized home values ranging from $250,000 to
$1,000,000 dollars. The highlight of the
data is of a course a ranking of property tax rates across 35 Ontario
municipalities and the illustration that property tax rates in Windsor are the
highest in the province and those in Toronto are the lowest with Thunder Bay
coming in at second highest.
Of course, how you
rank these tax burdens – especially when we are discussing property taxes in
say Thunder Bay or Sudbury compared to southern Ontario cities – can lead to
different answers. In the end, much depends
if you want to rank tax rates, the average taxes paid based on average property
values, taxes paid per standardized house values or property taxes as a share
of resources available – for example household income. There are two components to calculating a
simple estimate of property taxes paid – the value of the home and the tax rate
applied. Using the tax and property value data from Zoocasa and household income
data from the BMA 2019 report, here are some of the rankings in visual form.

First, Figure 1 plots
average house values ranked from highest to lowest for the 35 Ontario municipalities. The prices range from a high of $1.08 million
dollars in Richmond Hill to a low of just under $189,000 for Sault Ste.
Marie. Not surprisingly, houses in the
GTA area have the higher values while the four northern Ontario cities in the
data are all at the bottom. Sharing the
bottom with northern Ontario cities are other places that have been relatively
economically depressed in recent years – Windsor, London, St. Catharines.


Figure 2 then plots the ranked tax rates and show Windsor at the top, followed by the four northern Ontario cities. It does seem that cities with low house prices seem to have higher tax rates and indeed when you plot the tax rate against the house values as in Figure 3 there is a definite visual correlation. Given that cities in Ontario are creatures of the province, they essentially provide very similar services which means that to generate similar services per household there will be higher tax rates on cities with lower house values. This is especially pronounced in economically depressed cities – like those in the north - that have also seen their industrial and commercial tax bases eroded.

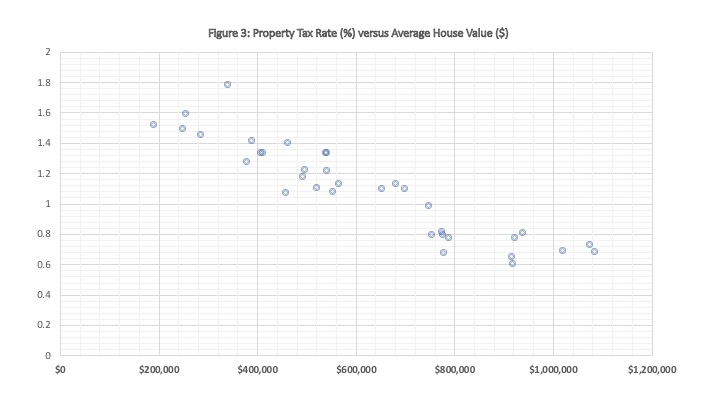
Figure 2 then plots the ranked tax rates and show Windsor at the top, followed by the four northern Ontario cities. It does seem that cities with low house prices seem to have higher tax rates and indeed when you plot the tax rate against the house values as in Figure 3 there is a definite visual correlation. Given that cities in Ontario are creatures of the province, they essentially provide very similar services which means that to generate similar services per household there will be higher tax rates on cities with lower house values. This is especially pronounced in economically depressed cities – like those in the north - that have also seen their industrial and commercial tax bases eroded.

Figure 4 ranks these
35 cities based on the taxes paid on the average house value and the dollars
paid per house are higher in areas with high value homes even at the lower tax
rates. Average property taxes paid are
highest in Oakville ($7,874), Whitby ($7,731) and Pickering ($7,702). The lowest average property taxes paid are in
the four northern Ontario cities and range from a high of $4,146 in Sudbury
(with Thunder Bay a close second at $4,044) to a low of $2,884 in Sault Ste. Marie.

So, if you have low
average house prices, you will pay less in average property taxes even though the rates
are higher. However, the average
conceals that there is a range of house values everywhere – even in
economically depressed areas. So, it you
assume your house value is $500,000 – of which there are many even in Thunder
Bay or Sudbury – then higher tax rate cities are going to see much higher taxes
paid on the similar property compared to low tax rate cities. Figure 5 plots the ranking by taxes paid on a
$500,000 property. If you have a
$500,000 house, then your taxes are going to range from $8,947 in Windsor
(followed next by Thunder Bay at $7,992 and then the other three northern
Ontario cities) at the top and down to $3,074 for Toronto. This of course assumes that you can find a
house for $500,000 in Toronto but one imagines that even there, there are properties
close to the half-a-million mark.
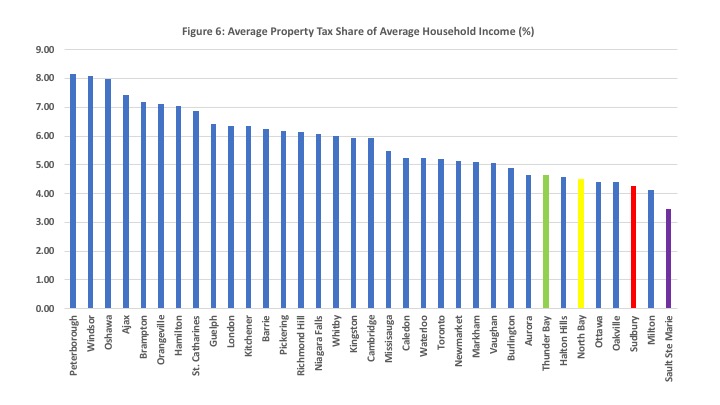
Finally, Figure 6
looks at the ranking yet another way, average property taxes paid from Figure 4
as a share of average household income (obtained from the 2018 BMA Report). After
all, no matter how much your house is worth, in the end you have to pay effective
taxes out of your current income and not from the value of property itself. Here the ranking shows that the burden of
property taxation on household income is highest in Peterborough, Windsor and
Oshawa and the lowest Sudbury, Milton and Sault Ste. Marie. Thunder Bay is actually at the lower end of
this distribution but higher than the other three northern Ontario cities.
So, where you rank in
the end does partly depend on what measures you want to use. Moreover, it also depends on the cities you
choose to compare. Are property tax
rates in Thunder Bay too high? If you
have a higher value house, they indeed are compared to what you would pay in
many other cities even if you consider population size. A $500,000 house in Thunder Bay pays about
$7,992 in taxes while a similar house in Guelph would pay $5,703 and Kitchener
about $5,554. On the other hand, if you
base the ranking on household income shares devoted to property taxation, then
Thunder Bay fares considerably better.
And of course, if you truly wish to compare likes with likes then
compare Thunder Bay to the other three northern Ontario cities. Thunder Bay has the highest property tax
rates, pays the highest share of household income in property taxes and the
highest taxes on a $500,000 house of the four northern Ontario cities. It comes in second place to Sudbury only when you only
look at the average property taxes paid. You can decide what comparison you want to make.