Northern Economist 2.0

Friday 15 March 2019

Why Thunder Bay Needs a Municipal Organizational Review


Thunder Bay Mayor Bill Mauro has called for an organizational review of how the City conducts its operations and has directed the City Manager to prepare a report that will deal with the scope of the proposed review.  This is in the wake 
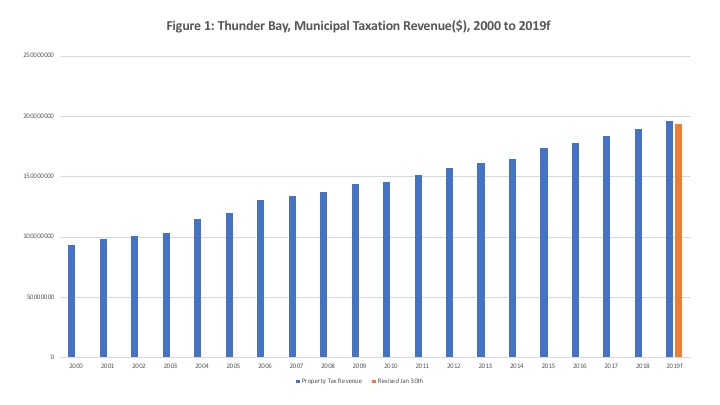
of a 2019 Budget that saw the new council come in with a total tax levy of 2.29 percent which is below the annual average increase of the previous council’s four-year term of 3.6 percent.  However, there is room for improvement and an organizational review is a good way to try and put the city on a more sustainable tax levy path.

The BMA 2018 Municipal Study (see below) provides some quick comparisons in its Executive Summary that show why Thunder Bay needs a longer-term strategy to keep future increases closer to 2 percent. A property tax comparison shows that for the most part, property taxes in Thunder Bay are higher than either the provincial average or the average for northern Ontario. A basic detached bungalow has property taxes that are 10 percent higher than the provincial average and 19 percent higher than the average for northern Ontario.  For a two-storey home, Thunder Bay is 30 percent higher than the provincial average and 22 percent higher than the northern Ontario average. It should be noted that house values in Thunder Bay are substantially below the current provincial average - which incidentally in January 2019 was $554,936 while in Thunder Bay for February 2019 it was closer to $256,000. [Had to calculate this myself as the Thunder Bay site reports the median but not the average. Take 13.8 million dollars and divide by 54 sales]. A homeowner in Thunder Bay pays anywhere from 10 to 30 percent more in property taxes than the provincial average for a home that is about half the value. How's that for the Thunder Bay competitive advantage when it comes to attracting new business?


Our property taxes on apartment buildings are also higher than the average for the province or the North as are those for neighborhood shopping malls, office buildings, hotels, vacant industrial land and standard industrial land.  The only categories where we are  lower are motels – where we are 11 percent below the provincial average and 13 percent below the northern average – and large industrial land – where we are 3 percent below the provincial average but 8 percent above the North.

This raises questions of long term sustainability of these taxes given the slow economic and population growth in the City as well as the affordability when it comes to households paying these taxes.  While taxes are levied on the value of property, they are paid out of current income and here Thunder Bay also does not perform as well.  The slide below continues the comparison but this time on property taxes as a percent share of household income and water/sewer charges plus taxes as a  percent share of household income.  


For both these measures, we are higher than the provincial and northern averages though one may argue that the percent difference is small.  Average household income in Thunder Bay was $87,359 (the provincial average for municipalities in the BMA study was $102,194) with property taxes (at 3.9 percent on income) representing $3,407 dollars.  At the provincial percent share, taxes would be $3,319 - $88 dollars less - and at the northern Ontario percent share it would be $3,145 - $262 dollars less.  If our property taxes were as affordable as the Northern Ontario average - each household would pay $262 dollars a year less.

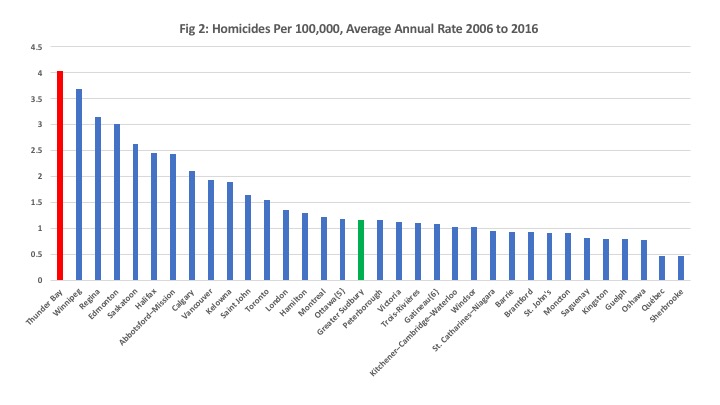
Why do we have higher taxes? That is the type of question a good organizational review would help answer.  When you start looking at the cost comparisons for services like general government, ambulances, general assistance, assistance to the aged, parks, sports and recreation, library, cultural services, police, and fire, Thunder Bay is usually at the higher end of the cost rankings for comparison Ontario municipalities.  While we can make arguments that the higher costs are a function of the geographic spread of the city, its regional role or its aging demographics, it remains that our costs are higher even when compared to other northern Ontario cities with similar features such as Greater Sudbury or Sault Ste. Marie.  

At the same time, the evidence suggests that we are increasingly providing a regional role in terms of health and education services and servicing a population larger than the official statistics might indicate.  Every year, thousands of university and college students move to Thunder Bay to acquire their education boosting our population from September to April.  Then there are the outlying First Nation communities who come to the city to also get health and education services many of whom also stay for extended periods to access these services.  However, how much more additional municipal service provision results from these demands that have to be met by the municipal property tax base is not a question with ready answers due to a lack of data - or at least publicly available data.  There is only so much a simple country economist can analyze if the data is not available. 

So, an organizational review is a good thing if it takes a look at how things are currently being done as well as what the actual demands for municipal services in Thunder Bay are.  If we have a municipal tax base for a City of 110,000 but are servicing a more regional population of 130,000 then we need to find some solutions.  An organizational review is not about cutting service but how to meet our current and growing needs and doing it in a manner that does not fiscally punish residential households and businesses in Thunder Bay.  Its about how to do more with less.  Simply throwing up your hands and saying taxes are higher here because things cost more is not really an option.  Things cost more for a reason and the organizational review should find out why.


Sunday 24 February 2019

And Here it Is! The New Air Canada Thunder Bay-Toronto Schedule

Well, you can now book starting May 1st on the new schedule Air Canada has for the Thunder Bay-Toronto run.  As noted in my last post, much was made of the move to larger A319 jets that would shave off 20 minutes off  a flight from the current turboprops but the more frequent schedule of six flights daily has now been replaced by three flights a day.  One thing remains the same however, the earliest flight out of Thunder Bay to Toronto is still at 5 am.

Going from Thunder Bay to Toronto, Air Canada now has three flights a day and every day:  5am, 11am and 5:15pm. 


 Coming back, its 8:20am, 2:30pm and 9:10 pm.


So there you have it, the new Air Canada out of Thunder Bay.  It will be interesting to see how it does compared to the competition from Porter and Westjet.  Going to Toronto on a weekday, Porter in early May currently has seven flights from Thunder Bay to Toronto Island (as opposed to Pearson for Air Canada): 6:45am, 9:00am, 11:10am, 12:40am, 2:10pm, 4:05pm and 7:15pm.  As for the return, another seven flights at 8:30am, 9:55am, 11:25am, 1:25 am, 4:35 am, 6:45pm and 8:20pm.  As for Westjet (which goes to Pearson also), from Thunder Bay to Toronto it is 6:10am, 11:50am and 5:50pm while the returns are departing at  9am, 3:10pm and 9:50pm.

Air Canada has cut capacity starting in May by 13 percent going from 468 to 408 seats.  Porter at seven flights a day with a Turboprop (assuming 78 seat capacity) will have 546 seats available while Westjet with three 78 seat Turboprop flights will have 234 seats.  So the smallest local player here is Westjet and given that they appear to be having some issues that have caused it to lag Air Canada nationally, one wonders if they will be the airline hit hardest by these changes in the Thunder Bay market and as a result be the most likely to exit.  Or will they counter with their own jet service and business class to compete directly with Air Canada on the Thunder Bay run?

Stay tuned.

Friday 15 February 2019

From Air Canada to Thunder Bay with Love...Well Maybe Not


Air Canada chose Valentine’s Day to announce a number of route changes that consist of removing older, slower, more frequent and smaller regional propeller planes (the Q400s) currently operating under Jazz and substituting newer, faster (by about 20 minutes in Thunder Bay's case) less frequent but larger jet aircraft (A319s) operating under the Rouge banner.  In the case of Thunder Bay, this means that the current six flights a day to Toronto (with 78 seat capacity for each flight) will be replaced with three flights a day (with 136 seat capacity each).  If you do the math, daily capacity on the Thunder Bay-Toronto run for Air Canada will actually fall from 468 to 408 – a drop of about 13 percent. That means you can expect a price increase at some point in the future even though the newer planes and crews Rouge uses are likely lower cost per passenger mile.

I guess I am now old enough to remember the preamble to the era of airline deregulation when Norman Bonsor, my Transportation Economics professor, would intone that deregulation was a plus for small regional markets like Thunder Bay because more expensive jet service would be replaced by more frequent and cheaper albeit slightly slower turbo-props – which is indeed what came to pass in Thunder Bay.  Air Canada’s announcement is a bit like back to the future but the new jets today are much more fuel efficient and cost effective than they were in the 1970s and 1980s.

Still, I am looking forward to seeing how this transition proceeds and the passenger response.  Going from six flights a day to three will reduce passenger travel flexibility and one expects that Air Canada will schedule its three daily flights to Pearson similar to what Westjet is doing (which incidentally also in the last while went to three from four flights daily but still uses Q400s).  For May, Westjet is showing departure times to Pearson from Thunder Bay of 6:10am, 11:50am and 17:50 pm and returns to Thunder Bay from Toronto departing at 9am, 15:10 and 21:50.  One suspects that given Air Canada is more directly competing for passengers to Pearson with Westjet, it will have its flights in slots pretty close to Westjet.

Air Canada’s move pretty much consolidates the alternatives from Thunder Bay into two – going to Pearson at nearly the same times at three times a day or going to the Island Airport.  Of course, Porter is still maintaining its Q400 6-7 flights a day service to Toronto Island which means it may pick up even more business travel from Air Canada.  It is unfortunate that Porter was not able to bring regional jet service to the Toronto Island airport because 5-6 flights a day from Thunder Bay on smaller yet faster regional jets such as a CRJ550 or CRJ700 (50 and 78 passenger max respectively) would definitely have smoked the competition out of Pearson.  Still, I suspect that Porter will see a pickup in its bookings given its greater flexibility as well as its downtown location for business travellers. It will however probably need to reinvest in its aircraft stock as its fleet begins to age.

The other claim that was made was that the Rouge airplanes were roomier and more comfortable.  Perhaps I am missing something here but having flown on some of the newer jets and flown Rouge overseas, I found the seating in the Q400 was actually a bit roomier compared to my last Rouge flight.  But it will be roomier in business class (the 136 seat version of the A319 has a business class) and that may also be part of Air Canada’s strategy to hold onto business travellers who are much more lucrative to airlines than the rest of us.

 
So, the changes have pros and cons and it will be interesting to see how everything comes out in the wash.  The increased competition may eventually spark some real consolidation on the Thunder Bay route - after all, if Air Canada adopts Westjet time slots with larger and faster planes to Pearson, one might see an exit by Westjet and going down to only two airlines out of Thunder Bay.  That really would be going back to the future. Or Westjet may respond by bringing in jets which will spark a pretty competitive period until the inevitable departure by one or more players brings back monopoly and higher prices. Interesting times are ahead.

For those of you who have travel with Air Canada booked in May from Thunder Bay to Toronto, you can look forward to a message soon rescheduling your flight. Have a wonderful long weekend.

Friday 1 February 2019

Thunder Bay City Budget 2019: It's Not Over Yet


Thunder Bay City Council has made the effort to address the rising level of taxes and expenditures in its most recent budget deliberations on Wednesday evening this week which apparently lasted eight hours.  The Administration was directed to find options for about $3 million in savings and they responded with a tiered list of three categories ranging from the least to the most intrusive that totaled $4.8 million.  The reductions approved by Council from the first list alone amounted to almost $1.7 million and among the items that were eliminated (as listed in a CBC report) were:

  • $150,000 for consultation and study for increased monitoring of area waterways and other open spaces
  • $16,500 that will reduce family swim hours at Churchill Pool and hours of operation for the thunder slide at the Canada Games Complex
  • $330,000 for the purchase of a new pumper truck for Thunder Bay Fire Rescue
  • $20,700 for the city to hang Christmas lights in the downtown south core and Westfort and for the installation of hanging baskets in the two cores
  • $45,000 in reductions to city budgets for WSIB and overtime.

As well, several vacant city positions were eliminated.  However, some of the reductions in other services in the other more “intrusive” categories such as the elimination of weekend residential street snow or sidewalk plowing were not accepted.

When all was said and done, the increase in the total tax levy was brought down from initial 3.3 percent (that had actually jumped to 3.69 percent) – to 2.29 – that is from $195.9 million to $194.1 million – about $1.8 million dollars.  That does not seem like a lot because there was also the addition of about $1 million in new spending for police services (the jump to 3.69 percent) as a result of the need to deal with the recommendations of the Ontario Independent Police Review Director on the relations between the police and Indigenous people.  The budget still has to be ratified and that vote is scheduled for February 11th. 

So, while an effort was made to restrain spending, when you look at the updated figures (See Figures 1 & 2)  that include the original proposed increases and the new revised January 30th figures, there is still work to be done.  The new revised budget figures still entail an increase in the total tax levy though the rate of increase is now much closer to the inflation rate and lower than the average increase of 3.9 percent over the period 2000 to 2018.


It remains that despite what seem like numerous reductions to many items, there is still more tax revenue needed.  The City Budget is in some ways analogous to our hydro and water bills where even after people reduce their usage considerably, the total bill still goes up because of “fixed costs.”  Indeed, what has been done in the most recent budget meeting can best be termed as dealing with the “low hanging fruit.”  A more substantive effort requires a comprehensive expenditure and service review that needs to consider more substantial long-term changes. 

Among these, there does need to be a review of services like snow removal or garbage collection or transit that examines how they can be done with less money while preserving a core service requirement.  There needs to be a review of overall city staffing that can start with a hiring freeze and reduction of the total complement via attrition with restructuring of management of services and service delivery so that fewer people – including managers - are required.   

As retirements occur, management departments could be amalgamated.  A glance at the City organizational chart shows numerous divisions within each category and one wonders for example why under Corporate Services and Long-Term Care there are separate divisions for Financial Service, Revenue and Internal Audit given that they are all finance related.   Why is the Waterfront Coordinator not under Tourism Thunder Bay? Why is there a Central Support division in Community Services and another in Infrastructure and Operations? There is both a Corporate Strategic Services block as well as a Corporate Projects division in Community Services. There may well be good reasons for some of these organizational patterns but they do need to be reviewed and examined for efficiencies.

In terms of services, weekly winter garbage collection – say from November to 1st to March 30th could probably be changed to every two weeks with a three can limit every collection period.  This would reduce the core staff required with the uptake in summer filled by summer seasonal student workers when weekly two can limit service resumes.  Snow removal on weekends in residential neighborhoods could be moved from the current 5cm threshold to 10 cm which could help reduce overtime costs. 

In short, Council has made a start but there is still more to be done after this year’s budget is passed.

Thursday 10 January 2019

Municipal Government Inflation Rates: How Much higher?


On Tuesday night this week, Thunder Bay City Council began its budget deliberation process and there was a fair amount of grilling of City Administration by councilors with respect to the overview of where spending and tax rates would be going over the next few years.  Apparently, councilors were surprised when Administration said that the city had a $20 million annual infrastructure gap for the next 15 years as well as projected tax increases at over 3 percent – 3.83 percent for 2020 alone – until 2024.  Part of the questioning involved the standards being applied to estimate the infrastructure gap and clarification was requested. This of course is a reasonable question given the extremely wide range of estimates available for infrastructure gaps at least at the national level.

I tuned in for a bit on Tuesday night and caught part of an exchange between Councilor Mark Bentz and City Manager Norm Gale in which Councillor Bentz expressed some disquiet at the projected tax increases until 2024 being well in excess of increases in the Consumer Price Index inflation rate. The reply from the City Manager was that the Municipal Consumer Price Index was not the same as inflation from the Consumer Price Index and that it was indeed much higher.  So, I decided to do a little digging to see what the source of such a statement might have been and to see indeed how much higher an inflation rate you could get for government spending in general.

It turns out the City of Edmonton actually did a bit of research into this issue and published a report titled Municipal Price Index 2018 in which they compared consumer inflation and municipal inflation from 2012 to the present and provided some forecasts for the future. It turns out that based on their estimates for Edmonton, the inflation rate for municipal government services was indeed higher than for consumer prices but as Figure 1 illustrates, the gap is not as large as one might think. Over the entire period 2012 to 2019(forecast), the average consumer price inflation rate for Edmonton was 1.6 percent while the average municipal inflation rate was 2.2 percent for an average difference of 0.7 percent.  
 

So, what about Thunder Bay?  Well Figure 2 plots the inflation rate since 2012 for Thunder Bay based on the CPI.  It then plots inflation based on the Government Expenditure Implicit Price Index obtained from the 2018 CIHI National Health Expenditures Data Appendix A.  It then also plots the municipal inflation rate for Edmonton from Figure 1 and the annual increases in Thunder Bay’s municipal tax levy.  Note that for 2019, the CPI Inflation rate for Thunder Bay and the GEIPI rate are both assumed to be 2 percent.  So, what do we get?


Thunder Bay’s municipal tax levy increases since 2012 and forecast into 2019 are generally all well above any of these measures of inflation including the municipal inflation rate calculated by the City of Edmonton. The average CPI inflation rate for Thunder Bay over the 2012 to 2019f period is 1.5 percent.  The inflation rate based on the Government Expenditure Implicit Price Index (GEIPI) is 1.4 percent while the municipal inflation rate for Edmonton is 2.2.  The average Thunder Bay municipal tax levy increase for this period was 3.3 percent.

So, unless one is going to argue that municipal “inflation” in Thunder Bay is nearly double that for consumer prices – and I would need to see some evidence for that rather than just a blind assertion by City Administration – then one would have to conclude that this year’s 3.25 percent proposed increase in the tax levy is too high.  Obviously, the rate of municipal inflation is going to be partly determined by the City in terms of what they negotiate to pay for various goods and services as well as the choices of what goods and services to consume or provide.

If we go with the Edmonton forecast for municipal inflation of 2.7 percent – then to bring the tax levy down from 3.25 percent to 2.7 percent, there needs to be about $1.7 million dollars in reductions from this year’s proposed tax levy increase.  If you want to bring the levy down to a two percent increase, then there would need to be a $2.4 million reduction in the proposed levy.  So, whichever way you look at it, we can probably do better than 3.25 percent this year.

Monday 7 January 2019

Thunder Bay Budget 2019: Onward and Upwards Simply Won't Do This Time


The 2019 Thunder Bay municipal budget has arrived, and the proposed budget projects a total increase in the municipal tax levy of 3.25 percent. The proposed levy is $195.9 million which represents an increase of $6.2 million over last year’s budget of $189.7 million.  You can get a nice summary of the proposed changes in this summary article by Jeff Walters given that the actual executive summary document released by the City of Thunder Bay is really quite lengthy and as usual a rather opaque document with its summary of total tax supported(gross) spending, tax supported (Net), rate supported (Gross) and rate supported (Net) spending all of which include capital spending and government grant supported spending and are all well in excess of the $195.9 million tax levy which is not mentioned until the second page.

This first budget is an important test of the new Mayor and City Council in that it will provide an indication of their approach to municipal fiscal matters.  Indeed, the incoming Mayor in his assessment of major issues facing the City noted that taxation levels were one of his top three priorities  (along with infrastructure and crime).  There is of course a difference between the level of taxation and the size of a rate increase – reducing the level of taxation actually means having a negative rather than positive change to the net municipal levy. However, as Figures 1 and 2 show, the trend over the last two decades has been one of constant increases with a median increase in the levy of 3.1 percent. That is to say, half of increases were above 3.1 percent and the remainder below with the lowest increases being for the years 2000 at 1.1 percent and 2010 at 1.2 percent.  Hopefully we will not again see years like 2004 and 2006 as given the current levels of taxation they would represent an economic disaster for many local households.


An important issue for Council to ponder is the recent tendency for municipal budgets to generate large surpluses as was the case with the 2018 budget which was on track for a $3.6 million surplus as of October 2018.  While such surpluses are often used to replenish reserve funds, it remains that it becomes easy to budget when one overshoots with spending estimates and banks the savings at taxpayer expense.  Given that the increase in the municipal tax levy in 2018 was $5.75 million, it suggests that one could have had a much smaller tax increase and still run a modest positive variance in the $1-$2 million range.   And the fact is that 2017 also saw a budget surplus in the range of $8 million as a result of “one-time costs” that were lower than expected.  Essentially, municipal services - some of which are more regional than local it is to be noted - are being funded by local ratepayers as well as a broader range of cultural and social services and added to that a municipal "savings program" designed to build up reserves. Moreover, the residential ratepayer has been bearing a rising share of the tax burden given the decline in the city's industrial base.

I suppose whether you think using municipal property tax revenues to hit such a wide range of targets is a good idea depends on whether you believe the purpose of property taxation is to fund local services or whether it has a broader range of goals.  Municipal taxation is traditionally supposed to be "benefit" taxation - that is it is to be used to fund local services to residential property and property owners - rather than a form of wealth taxation - which is actually how the tax is levied.  If benefits and services to property are tied to the value of the property, then  the current approach works.  However, we all know that there is a wide variation in services to property.  As well, the aim should be for prudence in the budgeting to provide services with some effort to maintain reserves for unforeseen expenses.  At the same time,  the municipal ratepayer should not be treated as a sort of unlimited liability insurance provider when it comes to budgeting by being used to generate large surpluses that result in taxes higher than needed to fund operating service and needed capital projects.

So, what should this year’s increase in the municipal levy be?  Well, increases in levy supported spending should not exceed the rate of growth of population and inflation.  Given inflation in the rate of 2 percent and population increase of zero you are looking at 2 percent rather than 3.25 percent as the upper bound for this year’s increase.    True, unforeseen circumstances could cause more spending than anticipated later on in the year rather than a reduction but then that is what reserve funds are for and they have seen some healthy replenishment over the last few years.  Going ahead with the 3.25 percent increase is an indication of business as usual as 2017 and 2018 also saw increases in the total levy of over three percent.  Council will need to go through the list of proposed increases and ask for a pretty good justification of why they are needed.  Onwards and upwards is simply not a good option this year.

Monday 10 December 2018

Setting Direction: The Next Four Years for Thunder Bay City Council

Thunder Bay’s new City Council has been sworn in and the first meeting tonight will send important signals on what the direction of the new council is as well as the ability of new council members to work together and effectively make decisions.  This is a process being repeated cross the province as new municipal councils from Toronto to Dryden to Windsor begin serving their terms. 

Many often feel the role of Council is to make decisions that do things – like boost the city’s economy or cut costs.  The reality is that much of this can only be done indirectly.  For example, the economic impact of City Council is via its role in setting tax rates and tax policy as well as providing strategic direction on what infrastructure and quality of life investments can attract business.   As for cutting costs, Council needs to follow a process that involves its civil servants –administration - which administers and delivers services.

True, City Council approves all decisions but it is only after strategic direction is provided and the alternatives have been produced and analyzed by the administration.  If City Council wants to reduce expenditure growth, it is not their role to decide what areas should be cut or restrained, it is their role to select the target expenditure level or the desire to reduce spending and then ask administration for their options on how to achieve it.  Having set the policy direction, City Council then decides on the options provided by administration to pursue in meeting the target.  In brief, the role of City Council is to select targets and then make decisions to meet those targets based on the instruments provided by their civil servants.

Of course, the automatic response to any such pontificating on the part of observers like myself is that I am not a member of Council and if I feel I know so much I should walk the walk and run for office. While I appreciate that elected office is an important calling and a tough job,  my response to that is on several levels. First, you should always be careful what you wish for. Second, such a retort on the part of any politician is really designed to stifle debate because given the number of people expressing opinions, how can we all run for office and all serve on Council or as an MP? Third, as engaged citizens and taxpayers we should contribute to debate and discussion and we all have skills that can serve the public in different way.   There is no one size fits all standard for public service and we cannot all be elected politicians.


So, that out of the way, the main challenges facing Thunder Bay over the next few years appear to have been categorized by the Mayor in his address last week: taxation, crime, the economy and infrastructure.  I would broaden the “crime” category to general “social fabric” given the interaction between crime, inequality and poverty but fair enough.  These are the categories most in need of attention in Thunder Bay.  Taxation of course is related to spending given that the municipal tax levy is directly linked to the amount of spending.  And, of course there are always issues that will rear their head as a result from decisions made elsewhere – such as the decision to legalize cannabis.

So the issues on tap for the first meeting tonight are whether to close Dease Pool or spend millions of dollars in repairs (apparently $2.8 million more), changes in parking regulations,  a recycling contract extension ($2.6 million more) and a report on the performance of the  new Python 5000 pothole repair machine.  Aside from the parking regulations, these issues all ultimately may involve spending more money for one reason or another.  Given that taxation rates are ultimately linked to spending, tonight will provide a pretty good indication of what we can expect from City Council with respect to tax rates in next year’s budget process and the direction for the next four years.

Thursday 22 November 2018

Homicide Rates for 2017: Canada (and Sudbury) Up but Thunder Bay Down


Well, with all the excitement about the Federal Fall Economic Statement yesterday, the release by Statistics Canada of the 2017 homicide numbers flew in somewhat under the media radar.  According to Statistics Canada, the homicides in Canada hit its highest rate in almost a decade in 2017 with much of the increase attributed to more firearm-related and gang-related incidents. The firearm-related homicide rate increased 18 percent from 2016 to 0.72 per 100,000 population—the highest rate since 1992. Police reported 660 homicide victims in Canada in 2017, 48 more than in 2016. The homicide rate rose 7 percent in 2017 to 1.80 victims per 100,000 population—the highest level since 2009.  It would appear that the upward increase in homicide rates was driven by British Columbia and Quebec.


What is also of interest is the homicide rate by CMA for 2017 as shown in Figure 1.  In 2017, the homicide rate per 100,000 ranged from a high of 5.8 in Thunder Bay to a low of 0 in Saguenay.  Greater Sudbury came in close to the bottom at 0.61.  The good news for Thunder Bay is that the homicide rate for 2017 is down from 2016 when it stood at 6.62 per 100,000.  The bad news is if one takes the average homicide rates for all CMAs for the period 2006 to 2016 (see Figure 2)  Thunder Bay also ranks the highest at an average of 4.04 per 100,000, just ahead of Winnipeg at an average of 3.69. As for Sudbury, its homicide rate is up from last year - when it stood at zero - but given the rankings there does not seem to be that much to worry about there.

Needless to say, despite an improvement in 2017 Thunder Bay still has work to do.

Monday 29 October 2018

Final Thunder Bay Municipal Election 2018 Analysis: Ward Races

It is now a week since the municipal election in Thunder Bay and as the dust settles I have been doing some retrospective looks at the races and outcomes and providing some vote tallies - first for the Mayoral race, then the At-Large competition and in this last election post - the races for the seven Ward councillors. Down below, I have seven figures detailing the distribution of the total vote in each of the wards and they differ from both the Mayor and At-Large results in that in most of them, the winners took a rather sizeable share of the vote - as high as 65 percent in one of the races.


A total of 39,222 ballots were cast for Ward councilors which is lower than the 41,108 cast for mayor.  This suggests that there were individuals who voted for mayor and not for their ward councilors.  This type of difference was also noted in the At-Large race as the total number of votes cast At-Large was smaller than the potential number given the total vote for Mayor.  As for the online/telephone and paper ballot results, there was not substantive difference in the ward outcomes across the two methods with the exception of Neebing where Lynda Rydholm had more paper ballots than Cody Fraser but Cody Fraser won with the online ballots.

The vote share of the winners ranged from a high of 65 percent for Shelby Ch'ng in Northwood to a low of 33 percent for Cody Fraser in Neebing. Current River and McIntyre had the next highest winning vote shares at 59 percent for Andrew Foulds and 50 percent for Albert Aiello.   After Neebing Ward, the next lowest shares were 42 percent for Brian Hamilton in McKellar and 44 percent for Brian McKinnon in Red River.  Kristen Oliver in Westfort won with 47 percent of the vote. On average, the winning vote share across these seven wards came in at nearly 50 percent  - 48.6 percent to be precise.


Given that the total vote share of the winning mayoral candidate was 34 percent while At-Large candidates won with 7 to 11 percent of total votes cast, it suggests to me that most Ward councilors can reasonably claim to have a stronger representative mandate from their respective constituencies than either the At-Large candidates or even the Mayor.  Of course, one of the reasons for the more fractured vote distribution in these other races was the large number of candidates.  Even in the ward races, there is some inverse correlation between the number of candidates and the vote share of the winner.  Neebing with the most candidates at five saw its winner take the smallest proportion of total votes while Northwood with only two candidates had the winner take the largest share.

Still, we have a system of 12 councilors and one mayor with five of the twelve councilors elected At-Large.  This hybrid system was due to the Larson compromise which attempted to deal with the strong interurban rivalries still around at Amalgamation in 1970 and the fear that having only ward based councilors evenly split between the two former cities would result in deadlocks.  We are nearly 50 years out from amalgamation and the case can be made that the time has come to revisit our municipal system of representation and consider whether we should go to either an all At-Large system or all Ward based system.  I think given how Thunder Bay has grown together over the last 50 years, there is less north-south antagonism and rivalry that needs the attention of At-Large candidates.  Moreover, I think the At-Large positions detract from the position of Mayor by adding 5 individuals who also have a city wide mandate.  There is less of a case to be made today for electing 5 mini-mayors especially given that the relative mandates and support for ward councilors is actually stronger.

There is also a case for reducing the number of councilors at the same time.  Thunder Bay has one municipal politician for approximately every 8,500 people while a City like Hamilton (with 15 councilors and a mayor) has one municipal politician for approximately every 33,500 people.  And then there is Toronto which given the latest reforms imposed by Premier Ford now has one municipal politician for about every 101,000 people.  Thunder Bay could easily go down to a system of either 10 councilors plus a Mayor or even 8 councilors plus a mayor with a redesigned set of ward boundaries.   While the actual costs saved are small, it would send a message of frugality to residents given the levels of property taxation were a much mentioned concern.

The new council has the opportunity to consider these types of changes especially as we draw near to 2020 and the 50th anniversary of Amalgamation and the creation of Thunder Bay.


Friday 26 October 2018

Municipal Election Analysis 2018: Thunder Bay At-Large Race


The results of the October 22nd municipal election in Thunder Bay also saw the election of five At-Large Councilors from a rather large pool of 26 candidates.  There are three new At-Large councilors though given two are former councilors (Giertuga and Bentz) there is really only one new face – Peng You.  Most of the actual change in the composition of Thunder Bay City council came at the ward level where there are four new faces (Aiello, Hamilton, Fraser and Oliver) out of the seven positions.  The new council in the end represents a significant amount of change that will contribute new ideas and approaches but not an overwhelming amount that might lead to a more bumpy ride.

To me this also suggests that dramatic change in council composition may be easier at the Ward level because name recognition is much more important in the At-Large races given the large number of candidates – especially this time around.  In many respects, the race for an At-Large seat is really a race for five mini-mayor positions as once elected they can claim to speak for the entire city whereas ward councilors can be seen as representing specific ward interests.  Every voter gets to vote for five making the total number of votes greater than the actual number of voters creating different dynamics than a ward election.

Figure 1 presents the ranked total ballots for each of the At-Large candidates and they range from a maximum of 20,346 votes for Peng You to a low of 973 votes for Frank Wazinski.  After the two leading candidates - Peng and Aldo - there is a drop off to the next three with not that many votes separating them – Giertuga at 11,718, Johnson at 11,692 and Bentz at 11074 – and then another drop to 8,807 with Larry Hebert.  Thus, given this particularly large pool of candidates, the critical number of votes to win was just over 11,000 or just under 7 percent of the total votes cast (172,523) for At-Large candidates.  This perhaps explains why so many choose to run for Councilor At Large – given that there are five votes per elector – one can win a seat on council with a relatively low percentage of the total votes cast.  Ward races on the other hand seem to have stiffer competition and a larger share of the total is required to win.


Figures 2 to 4 plot some rather dizzying figures of the distribution of the vote for the paper ballots, online telephone ballots and total ballots and they generally parallel each other pretty closely.  Unlike the mayor's race which I examined in my last post, there was no major difference between online and paper ballots among the front runners.  Peng You essentially captured about 12 percent of the total ballots cast which in the end does not seem like a particularly strong mandate.  On the other hand, perhaps the better point of comparison is the number of votes cast for Mayor which provides a more accurate estimate of the number of voters participating.  Of the 41,108 individuals who cast a ballot for mayor, one can argue that 20,346 of them cast a ballot for Peng You or nearly 50 percent of voters.  


Interpreted this way, Peng’s accomplishment is quite astounding because if one looks at the race for mayor, the winner only captured 34 percent of votes cast.  In the same manner, the next highest At-Large candidate – Councilor Ruberto at 14,745 – captures nearly 36 percent of the voters –also slightly better than the mayor’s performance.  Of course, what is also of note is that if one takes the number of votes for mayor – 41,108 – and multiplies by the number of votes you are allowed to cast At-Large, you get at pool of At-Large votes equal to 205,540.  However, the total number of votes cast At-Large was only 172,523 – about 16 percent less meaning that some chose to vote for fewer than five At-Large candidates.

In the end, these results are interesting because they suggest that at least two of the At-Large winners may be more popular than the mayor which all but ensures they may want to consider a run for mayor the next time around.  However, that is four years away and a lot can happen during four years that can erode your political capital. It is always risky to be more popular than the boss and standing out can also make you more of a political target.  Still, one cannot deny that the stand out feature of this year’s At-Large race was the victory of newcomer Peng You given the energy of his campaign and the size of his win.  I suppose local sentiments may be best summarized borrowing from the words of the immortal Alexandre Dumas – it was All for Peng and Peng for All!

Wednesday 24 October 2018

Municipal Election Analysis 2018: Thunder Bay Mayoral Race


The results are in and former provincial Liberal Cabinet Minister Bill Mauro will be the next Mayor of Thunder Bay.  Congratulations to Mayor Mauro as well as all the hard-working candidates who chose to run for office.  Thanks also to outgoing council members who have seen years of public service.  Public service is never easy and putting your name forth as a candidate and serving as an elected official is an important act of participation in our democracy.

The new Mayor-Designate took 34 percent of the 41,108 votes cast for mayor edging out soon to be former City Councillor Frank Pullia who took 32 percent of the vote.  The choice of mayor was in many respects part of a general desire for change at the municipal level given that both of the higher profile council incumbent candidates for mayor went down to defeat.  Indeed, the new council represents a significant but not overwhelming amount of change with a number of new faces as well as new but familiar faces – as in the example of the new mayor.

Yet, the aspect of this race I found the most interesting was the collapse of the protest vote which saw Shane Judge garner only 5,155 votes (13 percent of the total) compared to his 2014 total of 9,531 which was a 26 percent share of the total.  Even more interesting was the collapse of support for Iain Angus who as a Councillor at Large in 2014 won with 15,861 votes and who as a candidate for mayor in 2018 was only able to manage about a third of that at 5,816. 

One wonders if this signals a general rightward shift in the Thunder Bay electorate given at least my perception of the generally left of center positions of Iain Angus.  Indeed, this may reflect a weakening of the labour vote in general given that Angus was endorsed by the Thunder Bay District Labour Council for Mayor and none of the five at large candidates endorsed by the Labour council won either.   Only three of the Labour Council ward endorsements won (Foulds, Ch’ng and Oliver). Or it may reflect a shift in voter priorities towards lower property taxes given that taxation was continually brought up as an issue during this campaign.The new mayor and several of the winning candidates have emphasized that taxation rates were an issue.

Figure 1 presents the ranked votes by mayoral candidates and most starkly illustrates how despite there being four high profile candidates, it was essentially a two-person race.  Indeed, one wonders what results would have been like if the provincial liberals had won the spring election and Bill Mauro had not entered the municipal race.  It is possible that in the absence of Bill Mauro’s entry, Frank Pullia might very well be the mayor today.  
 

Much is being made of the success of the new online/telephone voting system so a breakdown by type of ballot is interesting.  While voter participation is up above 50 percent this election and voter totals are up I would not venture to say that more convenient online voting options have resulted in a dramatic surge in participation.  Those who want to vote will vote no matter what the system is and the chief advantage of the new system is that it is more convenient for many people. While 41,108 ballots were cast for mayor this election, last time it was 37,123.  The result was an additional 3985 ballots cast – an increase of 13.4 percent.  This is actually a respectable increase but whether it was due to an appetite for change or the convenience of online voting will take a few more elections to see if the increase is sustained.

Of the 41,108 ballots cast for mayor, 15,249 - 37 percent- were paper ballots while 25,775 – 63 percent – were online/telephone ballots.  The preference does appear to be for the convenience of online/phone voting.  Figure 2 shows the distributions of the paper mayoral ballots. 
 

Figure 3 shows the distribution of the online/telephone ballots and Figure 4 the total distribution.  The results for the paper and the online/telephone ballots generally parallel each other but a closer examination shows that among the paper ballots, Frank Pullia had 33 percent of the vote and Bill Mauro 32 percent while in the online/telephone results it was 35 percent for Bill Mauro and 31 percent for Frank Pullia.  Overall, Bill Mauro became Mayor with 34 percent of the total vote and Frank Pullia was second with about 32 percent.


This is quite an interesting result because it raises the question as to whether the outcome might have been different if only paper ballots (which incidentally are also tabulated electronically) had been used.  It does appear that Frank Pullia had an edge with more traditional medium voters while Bill Mauro’s edge was with online voters.  This is also interesting given that the Pullia campaign was very social media intensive meaning it was fully engaged with the new technology.

This is also an interesting result because given the overall turnout – about 51 percent – and the number of candidates splitting the votes resulting in the winner only holding 34 percent of the total vote.  It means the mayor in the end was elected by about 17 percent of eligible voters.  This is not Bill Mauro’s fault by any stretch of the imagination.  People who are unhappy with small pools of voters rather than a majority deciding their leaders should make sure they get out and vote. On the other hand, perhaps recognition of this low effective support is why the incoming mayor seems relatively low key and unambitious given that his goal is to focus on one or two soft infrastructure projects - like an indoor tennis facility - rather than roads and bridges. I suspect many voters will be surprised to find out a tennis facility is going to be one of the new mayor's priorities.

In any event, these results should provide food for thought for many analyses to come. Next time, I will take a look at the At-Large results.