Thursday, 10 April 2025

Tariffs and Thunder Bay's Economy: Not as Bad as One Might Expect


As the Trump Tariff and Trade War continues, the impact on economies across Canada is front and centre in most minds.  Despite most of the national doom and gloom, my initial take on the impact of tariffs and the trade war in of the potential impact on the Thunder Bay economy was relatively optimistic.  As noted in my January 13th, 2025, post:

In the case of northern Ontario, the short-term effects will be mitigated by public sector activity.  For example, in major urban centres like Thunder Bay and Sudbury, a lot of employment is already either directly public sector or is based on economic activity from government contracts.  For example, Thunder Bay is in the midst of a construction boom driven by government housing money and a new provincial jail, and its transit car manufacturing just received another government funding boost.  The long-term is another matter if the country and province go into recession.”

It appears that this assessment is now being backed up by the Conference Board of Canada in their April 7th release Major City Insights Thunder Bay which can be summarized by their overview title that the “Area may avoid worst of tariff fallout.”  It is not that tariff do not pose a risk to Thunder Bay’s economy - and that risk is largest in the city and region’s forest sector - but as the Conference Board report notes “Forestry seems the region’s industry most exposed to U.S. tariffs. This is perversely fortunate, since softwood lumber has long been subject to U.S. trade “remedies,” so local producers are well-versed in dealing with them.

Nevertheless, growth of real GDP is expected to decline from their fall forecast for 2025 of 1.7 percent to 1.3 percent while 2026 is expected to see 0.6 percent real GDP growth.  Much as was noted several months ago: “The city will be somewhat insulated from tariff effects by its relatively large (broadly defined) public service, by ongoing construction of Thunder Bay’s $1.2-billion jail, and by manufacturing work on GO Transit rail cars.” If anything, I would expect more serious blows to the economy moving beyond 2026 given that construction on the jail is going to wind up, the prospects for regional lithium mining are more problematic in the wake of the decline in demand for electric cars and their batteries, and migration to the region from reduced federal immigration targets will hit both our post-secondary and housing sectors. Indeed, it has already hit Confederation College.

If one looks at employment changes from 2024 to 2026 based on the Conference Board estimates (See Figure 1), overall employment will be remarkably stable at about 65,000 jobs but there will be some sectoral impacts.  The direct impact of US tariffs will be primarily on our primary and manufacturing sectors and one can expect to see a total of 500 jobs lost here.  However, there is also an impact on wholesale and retail trade from the reduction in economic activity amounting to nearly 800 jobs lost followed by some job losses in education, public administration and other services.  However, there are expected to be employment gains in accommodation and food services, arts entertainment and recreation, healthcare and social assistance, transport and warehousing and construction. Overall, the losses pretty much balance out with the gains for total employment to remain in 2026 roughly where it was in 2024 and 2025.


However, the increase in accommodation and food services may be an underestimate and the decline for wholesale and retail trade an overestimate because of the shift in national and local travel patterns.  Thunder Bay might well expect to see an increase in domestic tourism visits this year as Canadians shift travel away from the United States and to domestic locations.  As well, fewer Thunder Bay residents are crossing the border at Pigeon River into the United States mirroring an ongoing national trend that has seen a significant decline especially in land border crossings into the United States.  

As Figure 2 reveals, using data for March across consecutive years, Canadian plated vehicles entering Canada at Pigeon River had begun to recover from the pandemic drop.  Over 12,000 vehicles a month returned to Canada in the months of March prior to the pandemic.  By March of 2024, the March total had recovered to just under 10,000 vehicles and for 2025 might have been expected to approach pre pandemic totals even with the decline in our dollar.  However, for March 2025 relative to the March previous there was a 34 percent drop to 6,159.  If more people in the region are spending their dollars at home, this will serve to boost the local food and retail sector somewhat mitigating the effects of tariffs.


So, will tariffs influence Thunder Bay’s economy?  Yes, there will be some employment loss, but accompanied by gains in other sectors with  the net effects at this point looking like total employment will remain stable.  However, one can expect the cost of living to rise as tariffs make everything more expensive.  In the long run, it is really anyone’s guess what will happen.  But if there is an increasing east-west orientation to Canada’s economy that requires more east-west transport infrastructure such as new pipelines and more east-west shipping of goods, expect to see Thunder Bay well positioned to take advantage of that.


Tuesday, 8 April 2025

Thunder Bay’s Port: The Renaissance of The East-West Connection


The Port of Thunder Bay is hosting its annual opening of Navigation Luncheon tomorrow and there is indeed much to celebrate moving into the future even given the current turbulence of the international economic environment.  The port has long been a key piece of infrastructure for Thunder Bay’s economy and is really the main reason that Thunder Bay exists.  Thunder Bay or "The Lakehead" as it was more commonly known was the transshipment point on the east-west economic axis erected by Canadian Confederation and the subsequent national policies that put through a railway linking the agricultural production of the west with the manufacturing production of the east.   

Thunder Bay exists in its current incarnation because of Canada and Canada in turn requires  Thunder Bay as a transport hub.  The role of the port was key in the east-west flow that defined Canada after Confederation.  The chief export product flowing through the Lakehead twin-ports of Port Arthur and Fort William was of course prairie grain but over time there was a diversification into other products though grain was always by far the most important product shipped.  At the peak of the grain trade, dozens of grain elevators lined Thunder Bay’s waterfront and thousands of people worked in either the railways, the grain elevators or the port.

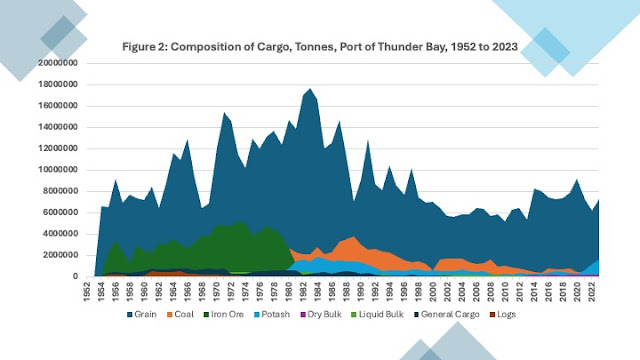
Of course, change has been constant when it comes to the Port of Thunder Bay. And nowhere is that change more evident than in the data compiled and available through the Port Authority itself.  Figure 1 plots total tonnes of cargo from 1952 to 2023 with a polynomial trend fitted. Total tonnes of cargo peaked in 1983, and the port then underwent a decline in total cargo shipped.  Much of this decline was due to a reorientation of the grain trade away from traditional European markets to the Asia-Pacific region which generated more activity for grain facilities in Vancouver and Prince Rupert.  However, as Figure 2 illustrates, it was not just a decline in grain that affected the port but also the end of iron ore mining at Steep Rock in Atikokan as well as the phasing out of coal.  Indeed, as Figure 3 illustrates, grain as a share of total cargo became even more important over time with the linear trend showing an increase from 60 percent of cargo in the mid twentieth century to over 80 percent by the present.


What is also notable in these charts is that since the start of the 21st century, the Port of Thunder Bay has seen a recovery and activity is generally on an upward trend.  While activity is still well removed from the peaks of the early 1980s, the Port of Thunder Bay is poised to increase its role in Canada’s transportation network.  It is probably a coincidence but the decline of the port’s activity in the 1980s also paralleled the increasing north-south orientation of Canada’s economy in the wake of first the Canada-US Free Trade Agreement (1988) and later its NAFTA and CUSMA successors.  However, with the continental economic relationship with the United States under stress and a push to remove inter-provincial trade barriers and increase east-west economic activity within Canada, Thunder Bay and its port are well poised to again build on its historical role as the east-west transportation hub.  Thunder Bay and its port exist because of Canada’s east-west economic orientation and anything that strengthens that link will inevitably benefit the Port of Thunder Bay.  What is good for Canada, is good for Thunder Bay.


Tuesday, 1 April 2025

Rising Life Expectancy: A Human Success Story


With the constant barrage of negative news over the last few months, its time for some good news.  One of the great success stories of human achievement has been the increase in life expectancy at birth.  Once upon a time, as Thomas Hobbes wrote, the natural condition of mankind was “nasty, brutish and short” and one should emphasize the short part. And this shortness of life had been the normal situation for centuries.  What is a substantial achievement is the increase in life expectancy at birth over the course of two centuries because of improvements in nutrition and public health as part of a process of economic development and economic growth.  While improvements in medical care have been a factor, these other factors were much more important initially particularly as they reduced the high rates of child mortality. Anyone familiar with 19th century Canadian census data knows that at one time half of deaths were children under age five that were carried away by an assortment of maladies that today are in the distant past.

If one goes to Our World in Data and checks out the life expectancy calculators, one finds that in 1770, average world  life expectancy at birth was a mere 28.5 years.  By 1850, it had risen to 29.3 years and by 1900, 32 years.  By 1960 it had risen to 47.8 years, but a fair amount of divergence had emerged around the world.  For example, in 1900, life expectancy at birth was 42.7 years in Europe and 41.0 in the Americas but only 28.0 years in Asia. By 1960, Europe was at 68.7 years, the Americas at 60.8 and Asia at 41.8 years.  Fast forward to the present, and life expectancy at birth is 79.1 years in Europe, 77.3 years in the Americas and 74.6 years in Asia.  From 1850 to 1900, world life expectancy at birth went from 29.3 to 32 years and by 1960 it reached 47.8 years.  Amazingly, the period since 1960 has added another 25.4 years bringing world life expectancy at birth to 73.2 years.

Of course, the results of broad based economic and social development have played a major role in less developed parts of the world resulting in large gains in life expectancy at birth but even the developed world has seen substantial gains.  Figure 1 plots life expectancy at birth for OECD countries in 1960/61 and 2021/22 (taking the higher of the two-year spread as some years have missing data) and ranks them by life expectancy in 2021/22.  At the top is Japan with a life expectancy at birth for the total population (male and female rates differ) of 84.5 years followed by Switzerland at 83.9 and Korea at 83.6.  Canada ranks 18th of these 30 countries while Mexico is at the bottom at 75.2 years.  Between these two time points, the average went from 68.7 years to 81.1 years for gain of 12.4 years.


Figure 2 plots the years of life expectancy at birth gained for these OECD countries between 1960/61 and 2021/22.  At the top are Korea, Turkey (Turkiye), Portugal and Mexico at 31.2, 28.5, 17.9 and 17 years respectively.  At the bottom are the Netherlands, Hungary, the Slovak Republic and the United States at 7.9, 7.1, 6.4 and 6 years respectively.  Canada managed to add 10.3 years to life expectancy at birth over this period which is just a bit below the average of 12.4 years.  The largest gains in years have accrued to countries that were at low points in the early 1960s not only in terms of life expectancy but also economic development. 


The rapid economic development Korea and Turkey were accompanied by spectacular gains in life expectancy.  Indeed Figure 3 shows the largest gains accrued on average to countries with lower life expectancy in 1960/61 – they simply had more to gain as economic development progressed.  In life expectancy, as in everything else, one expects there are diminishing returns over time.  Nevertheless, the performance of the world’s largest economy, the United States can be seen as a bit disappointing given as a share of GDP it spends the most on health of these OECD countries and ranked 28th out of 30th in terms of life expectancy in 2021/22 and dead last in terms of years gained since 1960/61.


In terms of what accounts for all this differential performance, that is of course a topic for another day.  However, the good news is that the human species during the 20th century managed to escape from its Hobbesian fate and a child born today particularly in highly developed countries can expect a life expectancy at birth approximately double what was the case in 1900.  Despite all the doom and gloom, we should take that as a win.