Monday, 25 March 2024

Ontario government’s fiscal history drenched in red ink

 This post originally appeared on the Fraser Institute Blog, March 25th, 2024.

Ontario government’s fiscal history drenched in red ink
Ontario government’s fiscal history drenched in red ink

The Ford government will table its next budget on Tuesday. But a longer-term perspective on the evolution of Ontario’s government finances provides some important context for today. Since Confederation, Ontario has seen a massive expansion of its revenues, expenditures and debt. And its fiscal performance in terms of balancing its finances has oscillated over the years. Using data from the Finances of the Nation database, assorted Ontario budgets, and the Fiscal Reference Tables, a picture of change and variable fiscal responsibility emerges.

With revenues of $2.3 million and expenditures of $1.2 million in 1868, Ontario had a substantial surplus and no debt. Indeed, substantial surpluses marked much of the pre-Second World War era. By 2023, the Ontario government had spending of $199 billion and revenues of $193 billion for a deficit of nearly $6 billion and a net debt of $400 billion. Ontario government spending on a real per-capita basis was relatively modest from 1867 to 1913 (despite province-building activities such as roads and railroads) and was financed primarily by federal government grants and natural resource revenues from forestry and mining. The period after 1914 saw an expansion of both government spending and revenues that was quite dramatic compared to the prior period, but which paled in comparison with the post-1957 expansion into health, education and social services.

With respect to revenue composition, Ontario gradually shifted from a reliance on natural resource rents and government grants to own-source revenues from income, consumption and other assorted taxes. When compared to the federal government—the only other Canadian government larger than Ontario in terms of total revenues or expenditure—in real per-capita terms Ontario spent less than the federal government until the early 1990s surpassing the Ottawa in 1993 for the first time. By 2020, real per-capita Ontario government spending was actually more than federal real per-capita spending, though the pandemic years saw a reversal.

What’s truly remarkable about Ontario’s finances is its growing reliance on deficit financing since the 1970s. Over the entire 1867 to 2023 period, Ontario ran an operating deficit in 70 out of 157 years or approximately 45 per cent of the time. However, in the first 100 years from Confederation (1867 to 1967) Ontario only ran 22 deficits—that’s 22 per cent of the time. In the fiscal years from 1968 to 2023, Ontario ran 48 deficits in 55 years—or deficits 87 per cent of the time. Deficits have gone from being a temporary departure for exceptional times to a near permanent device.

The accompanying charts plot Ontario’s deficits, its deficit-to-GDP ratio, its net debt and its net debt-to-GDP ratio from 1960 to the present. The first chart illustrates that Ontario maintained its largely balanced budget approach to its finances for most of the 1960s but incurred deficits in the 1970s.

Figure 1

Its three largest deficits were in 2010 ($19.3 billion), 2011 ($17.3 billion) and 2021 ($16.4 billion). As a share of GDP, the second chart illustrates that Ontario’s three largest deficits were in 1992 (3.7 per cent), 1993 (4.1 per cent) and 1994 (3.5 per cent). Ontario’s pandemic deficit peak in 2021 came in at 1.7 per cent placing it lower than some of the deficits of the 1970s and early 1980s.

Figure 2

Deficits plus interest eventually result in accumulated debt and Ontario like other provinces has added to that by borrowing for capital spending on top of its operating deficit. As the final chart shows, in 1960 Ontario had a net debt of $994 million and net debt-to-GDP ratio of 6 per cent. Today, net debt tops $400 billion and the net debt-to-GDP ratio is about 36 per cent. The profiles for net debt and net debt-to-GDP suggest Ontario’s net debt has grown in three phases.

Figure 3

The accumulation of net debt takes off in the mid 1970s, then accelerates in the 1990s and accelerates yet again after 2008. These periods of acceleration have all coincided with periods of economic slowdown or recession in the province—the low growth stagflation era of the 1970s, the recession of the early 1990s and recession/financial crisis era of 2007 to 2009. In each of these periods of distress, deficits mounted, yet even when the economy and revenues began to recover, spending growth and deficits continued. In essence, the Ontario government ran deficits during bad times and better times, giving a fiscal dimension to the provincial motto “Loyal She Remains.”

As Ontario moves forward from the pandemic era, it remains to be seen if the government will rein in perpetual deficit financing and halt debt accumulation, or if the government will embark on yet another cycle of mounting debt. In many respects, the government has continued to spend at a rate well above its economic ability and performance. Key to the issue is Ontario’s productivity lag, which has resulted in slow growth relative to the rest of the country. If the Ford government continues to spend as if Ontario was still experiencing the high growth rates of an earlier era, that’s not a sound recipe for fiscal responsibility.


Monday, 18 March 2024

What is a Provincial Government to Do?


Ontario is coming up to Budget Day next week on March 26th and it will be interesting to see what the provincial government does on a number of issues because quite frankly the provincial government is in a bit of a pickle when it comes to economic and fiscal policyOver the last decade, Ontario has been hit by a productivity decline that has translated into slower economic growth.  Since the pandemic, this has been combined with a bout of inflation and a surge in population growth.  When you start looking at Ontario fiscal and economic indicators in real per capita terms, there are going forward disturbing implications for our standard of living.


If one compares the 2023-24 fiscal year forecast from the Fall Economic Update with the 2018-19 fiscal year, total provincial government revenues and expenditures are up approximately 30 percent respectively.  Health expenditure is up 33 percent.  The size of the provincial economy is up 22 percent.  On the surface, this is seemingly good news in the wake of the pandemic.  The problem is that over the same period, population in Ontario has grown by an estimated 12 percent while prices have risen nearly 19 percent.  Put another way, the combination of population and inflation at nearly 30 percent has outstripped nominal GDP growth while essentially matching the growth of government revenues and expenditures and in particular health spending.


The best way to visually illustrate these effects is to create an index.  Figure 1 uses data from Statistics Canada, the Fiscal Reference Tables and the 2023 Ontario Fall Economic Outlook and Fiscal Review to create real per person indices of economic and fiscal performance setting 2013/14 as 100.  Figure 1 plots real per capita (deflated using the CPI-All Items Index) Ontario provincial government Own Source Revenue, Federal Transfers, Total Revenue, Program Expenditure, Debt Service Costs and Total Expenditures.  Note that 2023-24 is an estimate.


In real per capita terms, debt service costs have been a bright spot in that despite the continuing rise in both the provincial net debt and interest rates, inflation and population growth have served to reduce the real per capita burden of servicing Ontario’s debt.  Indeed, the drop-in debt service has probably been able to free up resources for program spending. On the other hand, compared to 2018/19, real per capita revenues and expenditures are now below where they were.  In other words, provincial government revenue and spending have not kept up with inflation and more importantly population growth.


Figure 2 illustrates the decline in the Ontario way of life a bit more succinctly.  Does the health care system feel strained?  Real per capita provincial government health care spending after the surge of the pandemic is back to where it was in 2018/19.  Indeed, it has not changed much since 2013/14.  During that time, one imagines that labor costs for health care have gone up pretty dramatically which means there are indeed fewer doctors and nurses available to service a growing population. And to top it all off, real per capita output in Ontario has not kept pace with either inflation or population growth.  While real per capita GDP in Ontario grew somewhat from 2013/14 to the pandemic, it has since declined.


Looking at Figure 2, if the average Ontario had to ask themselves am I better off than a decade ago when it comes to my real per capita income and health spending, the answer is one that should concern the provincial government.

Tuesday, 12 March 2024

Will Thunder Bay Meet Its Housing Targets?


The Mayor’s State of the City Address last evening highlighted  housing construction in Thunder Bay particularly touting that Thunder Bay within Ontario had met its target so far and ranking tenth amongst Ontario centers (See here for a ranking).  The Mayor reiterated once again that in response to coming economic development and demand, Thunder Bay needed more housing and has a target of 1,691 new homes over three years.  Naturally, the question that arises is whether or not Thunder Bay can indeed meet this target. Much depends on the ability of the local construction sector to actually build that many homes in three years as well as whether the demand will materialize.


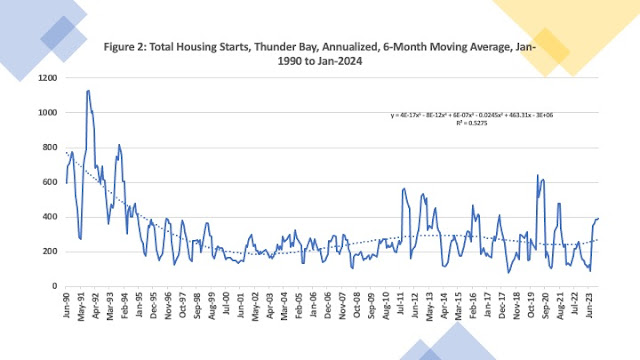
Forecasting the future these days is a pretty perilous exercise but some insight on the ability of Thunder Bay to build what amounts to nearly 600 new homes a year can be garnered from past performance.  Figure 1 plots monthly Statistics Canada total residential permit data by dollar value and number of permits from 2011 to 2023.  The numbers fluctuate seasonally though there is a spike in 2023.  However,  there are similar spikes in earlier periods.  If you want to smooth things out by taking a average - Thunder Bay has averaged monthly over the 2011 to 2023 period approximately 25 residential permits with an average value of 6.5 million dollars.  Converted  annually, that 25 permits a month translates into 300 units - a bit short.


Perhaps rather than permits issued, a better indicator of Thunder Bay’s capacity and ability to build nearly 600 units annually is a longer-term total housing starts series.  Figure 2 plots this from January 1990 to January 2024 and includes a polynomial smooth to highlight trends.  The results suggest that Thunder Bay is indeed capable of building 600 units a year as we have done so in the past.  Indeed, the early 1990s resulting in over 1,000 new housing starts annually.  However, the major obstacle is likely to be not building capacity or ability but demand for new units.  As the smoothed series points point, we are on an uptick that can see about 400 new homes being built in the next year.  Reaching 600 is possible based on the recent past given the smoothed numbers going into the pandemic.  However, as noted, the result is going to be driven also by our economic growth.  Thunder Bay has been doing well economically over the last year but will require sustained performance at this level to generate the needed demand for housing.


Wednesday, 6 March 2024

Ranking Recent CMA GDP Growth in Canada

 In the wake of the pandemic, with inflation, lagging productivity growth and a slowing economy, it is sometimes useful to look back on what economic performance was like in the "before time" particularly amongst Canadian urban areas.  Statistics Canada currently provides GDP estimates for Canadian CMAs for the period 2009 to 2020.  While 2020 sees a dip in GDP for everyone, the 2009 to 2019 period provides a snapshot of which parts of the country were growing the fastest prior to the pandemic.  The accompanying figure provides the growth rate in nominal  GDP from 2009 to 2019 for Canada's 36 CMAs and ranks them from highest to lowest. 

The expansion of GDP over ten years across these 36 CMAs averaged 45 percent and ranged from a high of 66 percent for Guelph, Ontario to a low of 16 percent for Saint John, New Brunswick. Three of the top five CMAs are in Ontario - Guelph, Kitchener-Cambridge-Waterloo and Toronto.  At the same time, four of the bottom five CMAs are also in Ontario - Thunder Bay, St. Catharines-Niagara, Peterborough and oddly enough, the Ontario portion of Ottawa.  Western Canadian CMAs in general did quite well with the exception of Victoria and Edmonton which placed in the bottom third.  In northern Ontario, Sudbury fares substantially better than Thunder Bay while in southern Ontario, the worst performers are Peterborough and St. Catharines-Niagara along with London, Windsor and Kingston.  


What happens as we continue to move forward from the pandemic will be interesting.  Vancouver and Toronto until the pandemic were major areas of GDP growth with their economies also totaling over 600 billion dollars or over one-third of Canada's economy.  If you add in Montreal, these three CMAs account for about half of Canada's economy.  With the run-up in housing prices and rents during the pandemic as well as general labor shortages in pandemics wake, one wonders how successful they will continue to be as urban growth leaders in Canada's economy.