Tuesday 21 February 2023

Police Month Continues! Police Spending in Ontario Municipalities


It appears that police month is continuing here on Northern Economist as I came across police spending data from the latest BMA Municipal Report  - the 2022 edition.  The BMA reports provides estimates of net policing costs per capita both excluding and including capital cost amortization as well as per $100,000 dollars of assessment.  These costs vary quite a bit and the BMA report has a preamble to the police cost data explaining that such costs can vary a great deal depending on the daily inflow and outflow of non-residents and commuters, the policing of specialized facilities in a municipality such as casinos or airports as well as demographic characteristics, the urban rural mix, service levels and the complexity of crimes. 


Having noted all that, Figure 1 provides a chart ranking policing costs per capita for Ontario’s thirty largest municipalities and they range from a high of $461 per capita for Thunder Bay to a low of 258 dollars per capita for Milton, Burlington and Oakville, which of course all share the costs via the Halton Regional Police Service. Indeed, a number of these other communities have the same per capita net costs because they are part of a regional service – Durham Region (Clarington, Ajax, Whitby, Oshawa, Pickering), York Region (Vaughan, Richmond Hill, Markham, Waterloo Region (Kitchener, Waterloo, Cambridge), Niagara Region (St. Catharines, Niagara Falls).  


In trying to find out what might account for these differences, the simplest starting point is a plot of net per capita costs against the number of officers per 100,000 population as provided in Figure 2.  It is a positive relationship with each additional officer per 100,000 resulting in an addition of nearly 2 dollars per capita in policing costs.  These are policing costs and are not simply the cost of an officer but include all the costs and support associated with that officer.  As you will recall in an earlier post, police forces also have a fairly large number of civilian employees as support.  However, simply stating that having more officers is going to cost more money is not terribly helpful in trying to explain differences across municipalities. 


Figure 3 plots the net costs per capita against the area of the municipality in square kilometers.  For most of these police forces, as area rises, the per capita cost actually falls though it starts to rise for very large municipal areas.   The plot vaguely resembles a u-shaped cost curve but it is ultimately not very satisfying chart because there is not really much in the middle to support the fitted curve.  The three communities on the far right who make up the upward sloping part of the curve are Hamilton, Ottawa and Greater Sudbury.


Figure 4 looks at the relationship between policing costs per capita and the community crime severity (Using the 2021 Crime Severity Index from Statistics Canada).  Once the polynomial curve is fitted to these points, one can say with a certain degree of confidence that there is an positive relationship between crime severity and police costs per capita but it is somewhat non-linear with one peak at a crime index of 50 and another at about 90.  Why this relationship might be bi-modal is either statistical luck of the draw with this data set or the subject of future research.


Finally, Figure 5 plots police costs per capita against total population to see if there are any economy of scale type relationship that might emerge.  The u-shaped curve that emerges is misleading because only Toronto is responsible for pulling up that curve,  For the rest of the communities, as population rises, per capita policing costs come down.  In a sense, throwing Toronto into the mix is not useful because it is so much larger than any other municipality in Ontario. 


I guess, the ultimate insight would be to run a regression with some of these variables as determinants of per capita policing costs.  Table 1 below presents the results of a very simple regression of net police costs per capita on municipal area (square kilometers), total population, Crime Severity Index in 2021 and regional fixed effects variables with the GTA/Central as the omitted comparison category.  Policing costs per capita do appear to be significant and positively related at the 5 percent level with Crime Severity and being in northern Ontario.  Population also seems to be a positive driver but again that is likely being driven by Toronto.  Still, it could be that really large populations create much more complex crime environments that really drive up police costs per capita.


So, in the end, what drives police costs in Ontario? Crime Severity is likely a factor but regional differences as captured by regional dummy variables also seems to be of some importance.  Obviously, more research is needed on this topic but that is time intensive and assumes that someone actually wants an answer.

Monday 13 February 2023

Policing in northern Ontario's cities: Some Stats


It does seem to have turned into Police Month here on Northern Economist given that the first four February posts have been reposting of a series I did for the Fraser Institute Blog on policing in Ontario.  Well, to add to that, some charts, and statistics on policing in the five major northern Ontario cities: Thunder Bay, Timmins, Greater Sudbury, Sault Ste. Marie, and North Bay. The data is from Statistics Canada - Table 35100077 - Police personnel and selected crime statistics, municipal police services, annually.  These provide an overview of police resources in these cities and perhaps the best way to start off is with an overview of crime.  


Figure 1 plots the Crime Severity Index for these five cities over the period from 2000 to 2021.  Crime Severity was on a downswing in all five of these cities from about 2010 to 2015 and since then appears to have increased.  Between 2015 and 2021, crime severity increases 19 percent in Thunder Bay, 61 percent in Timmins, 78 percent in Sault Ste. Marie, 48 percent in Sudbury and 67 percent in North Bay.  While in 2010, crime severity was highest in Thunder Bay,  by 2021 Thunder Bay’s crime severity had been surpassed by Timmins, Sault Ste. Marie, and North Bay.


Figure 2 plots the number of municipal police officers for each of these five cities and the largest forces are in Sudbury, followed by Thunder Bay, Sault Ste. Marie, North Bay and then Timmins. In 2021, Sudbury reported 257 officers while Thunder Bay had 238, the Sault 136, North Bay 98, and Timmins 81.  Between 2000 and 2021, all of these police forces grew but since 2015 the Timmins force has actually shrunk 5 percent while the Sault and Sudbury remained flat and Thunder Bay and North Bay grew 7 percent each. 


Of course, police forces also employ civilian and other personnel to support the officers and Figure 3 plots the total number of these employees for the 2000 to 2021 period also.  Relative to 2015, these have increased though after a lengthy prior period of staying flat.  However, the largest increases appear to characterize Sudbury and the Sault.  Between 2015 and 2021 the number of civilian and other personnel employed by police forces grew 10 percent for each of Thunder Bay and Timmins, 24 percent in North Bay, 42 percent in the Sault and 43 percent in Greater Sudbury. The ratios of supporting civilian staff to police officers vary across these communities.  For example, Thunder Bay has 1 civilian staffer per 2.4 police officers while Sudbury has 1 civilian staffer per 1.6 officers.  


Another comparison is provided in Figure 4  for  police officers adjusted for population, that is police officers per 100,000 population and suggests an overall long-term increase in all of these communities from 2000 to 2021.  The most officers per 100,000 population in 2021 is in Thunder Bay at 200 per 100,000 followed by Timmins at 192, then the Sault at 177, North Bay at 170 and Greater Sudbury at 152.  Since 2015, the number of officers per 100,000 has grown 5 percent in Thunder Bay, 6 percent in North Bay, stayed flat in the Sault, and actually declined by 2 percent in each of Timmins and Sudbury.


Finally, what is the relationship between policing and crime in these five northern Ontario cities.  Well, figures 5 and 6 plot two relationships.  Figure 5 plots the Crime Severity Index against police officers per 100,000 and puts in a linear trend and it shows a positive correlation between crime severity and police officers per 100,000 population with a fair amount of variation around the trend.  In terms of interpreting the result, it could mean that communities with more crime severity need more police officers, or it could be that communities with more police officers are able to report more crimes.  However, if one wants a better indicator of effectiveness, then figure 6 may be more helpful.  It plots the relationship between weighted clearance rates and the number of police officers per 100,000.  Clearance rates are the proportion of crimes that are cleared, that is a charge laid.  A weighted clearance rate attaches a higher weight to the clearance of more serious crimes such as homicides. The chart shows a positive correlation between clearance rates and the number of officers per 100,000 also with a fair amount of variation around the trend. 


So, what is the takeaway from all this?  First, policing resources and crime severity vary a great deal even within these five communities.  Some of them have seen substantial surges in crime severity since 2015.  Second, police forces not only employ police officers, but they have substantial civilian staff also and some of them have more support staff than others. An important question is if these additional staff are able to free up officers for more police work and how effective their supporting roles are, but this question is difficult to assess without a lot more analysis with more confounding factors considered.  Third, as limited an analysis as it is, having more police officers per 100,000 is correlated with higher clearance rates though how many convictions ultimately result is also something that requires more data. 


One wonders if any of these municipalities have actually done any analysis of the data they must obviously have that examines their staffing and the relationship between staffing, crime rates and crime severity and clearance rates.  One imagines that all of these municipalities have in place staff with statistics training to do data analytics that can then be used to assess their own needs and performance as well as make the case for resources when the need.  I am actually surprised there was not more mention of things like "more officers improve clearance rates" in much of the public discussion reported on police requests for hiring.  Or, for that matter that large proportions of many police forces are nearing retirement age and you need to plan for replacements.  On the other hand, I may simply have an over active imagination and assume a lot about the abilities of public sector entities to make effective cases on their own behalf.

Wednesday 8 February 2023

Policing and Crime in Ontario, Part 4: estimating needs

 This post originally appeared on the Fraser Institute Blog February 7th. This is the fourth and final post in the series.

In estimating policing needs across Ontario municipalities, one approach is to estimate the determinants of police resources then compute a predicted staffing level. Using the results for the police regression estimated in the third post in this series, we can construct an estimate of police resources per 100,000 for each community based on community characteristics such as available property tax resources, population density and regional variation, and then compare actual staffing with what would be predicted by the regression.

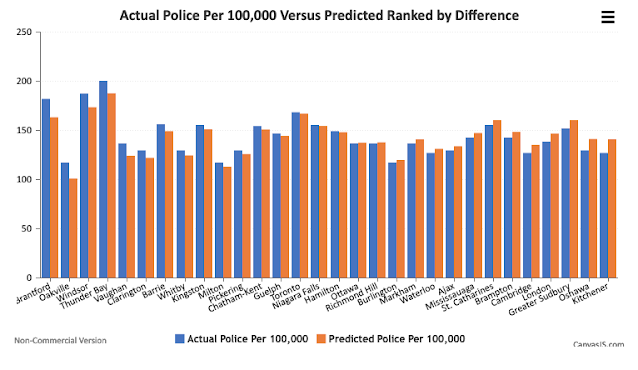
The chart and table below present the results of this exercise and plot the actual number of police per 100,000 versus the predicted for each municipality, and rank the results by the size of the difference between the two amounts.


Brantford has the largest difference with 182 actual officers per 100,000 and a predicted level of 163 resulting, for 19 more officers per 100,000 than the model would predict. It’s followed by Oakville (16 more), Windsor (14 more) and Thunder Bay (13 more). Indeed, of these 30 municipalities, about half have more officers per 100,000 than predicted, ranging from Brantford (19) to Niagara Falls and Hamilton (approximately 1 each). Toronto is also just above its predicted staffing at about one officer more per 100,000 than predicted. The remaining municipalities have staffing below what the model would predict, ranging from about one officer per 100,000 less for Ottawa and Richmond Hill to Oshawa (12) and Kitchener (14).

Of course, these are estimates and there can be other extenuating factors that affect police staffing and hiring in respective municipalities as well as the weight of historical staffing patterns. For example, Windsor is a border city, with cross-border demands and traffic, and an entry point into Canada that requires more policing while Thunder Bay has long-standing issues with high homicide rates, which absorb substantial investigative resources. One also wonders if the presence of casinos in some of these cities may lead to a need for more resources. Moreover, like the rest of the labour force, police forces are aging and some of the proposed hiring may reflect replacements of retirements rather than overall staffing increases.

And for those municipalities that are part of regional police arrangements, the results provide an interesting comparison of what their population sizes suggest their policing resources should be and what they’re getting via a regional arrangement.

For example, Oakville, Burlington and Milton based on the Halton Region staffing all are assigned 117 officers per 100,000 population by the statistics. The predicted staffing per 100,000 is 101 for Oakville, 120 for Burlington and 113 for Milton. Whether this is reflected in actual day-to-day operations or is simply a statistical artefact is an interesting question. It’s also interesting that even though some municipalities are near the bottom in terms of actual police officers per 100,000 population relative to other large Ontario municipalities, they still have more officers than predicted.

However, these results may assist in revisiting the cases of Toronto, Hamilton, Sudbury and Thunder Bay mentioned at the outset of this series. In the case of Toronto, there are long-standing narratives that the police force is either overstaffed or understaffed. Moreover, this debate has occurred against a background of recent rising crime and rising policing costs, more complicated policing needs, issues of racism and defunding, calls for alternate investment in areas like homelessness or mental health, and responses to evolving events such as the recent violence on Toronto public transit. Hamilton has issues similar to Toronto and in the evolving debate over its proposed increases in the policing budget there’s the recent news that Hamilton had a historic drop in homicides in 2022. Does this mean that Hamilton’s police force is so effective that it does not need more officers? Or that Hamilton just got lucky in 2022 and crime rates are more random than one might imagine?

Making resource decisions in a heated, emotionally or politically charged debate environment driven by the events of the moment is not always the best policy approach. While empirical evidence is but one piece of the decision-making process, both Toronto and Hamilton appear to be very close to what the determinants in the models would predict their staffing levels to be, suggesting that other factors notwithstanding, at the very least, better deployment of existing resources may be something worth considering.

Sudbury, on the other hand has eight fewer officers per 100,000 population than the model would predict while Thunder Bay already has 14 more officers per 100,000 than one might expect. A simplistic interpretation of these results given their size would be that Sudbury should go ahead and hire more while Thunder Bay should not. However, if Sudbury is currently able to achieve its policing goals with fewer resources, then it should not automatically feel compelled to ramp them up. As for Thunder Bay, the picture there’s probably more complicated than even a regression equation can possibly imagine, but that still does not mean better deployment of existing resources should not be a complement to whatever else is deemed necessary.

The takeaway from all this is that policing and public safety is complex and complicated and more effort should be made to acquire evidence to support decision-making. The types of results are simply one piece of evidence that can go into resource allocation decisions at budget time, and municipal ratepayers and their city councils should make wise use of all available information. This is especially the case given the large increases in tax rates that seem to be marking municipal budget season in Ontario this year.


Policing and Crime in Ontario, Part 3: statistical relationships

 This post originally appeared on the Fraser Institute Blog, February 7th.


Crime rates and severity, as well as policing resources per person, can differ substantially across Ontario municipalities. Naturally, Ontarians want to know the relationship between crime and police resources, particularly when police forces are asking for more money.

The first chart below plots the number of police officers per 100,000 against the Crime Severity Index (CSI) in Ontario’s 30 largest municipalities. As illustrated, there’s a positive relationship between crime severity and police levels, which some might find counterintuitive as one would think that more police means less crime. However, as has been noted, it’s sometimes difficult to sort out if more police officers result in less crime or whether more crime leads to a call for more police resources and an increase in police officers. Or even if more officers and more crime are positively related because of more effective reporting and control of crime.


While one could interpret this as evidence that more crime requires more police, it remains that we must account for the aforementioned bidirectional nature of the relationship and this ultimately requires controlling for confounding factors before attempting to answer the question as to whether the crime severity in these communities supports the policing numbers.

The table below presents regression estimates of the determinants of crime severity and policing using data for the 30 largest Ontario municipalities in 2021 and with a methodology similar to other studies. The regression models first estimate a regression of the CSI on police officers per 100,000, average household income in the municipality, and regional variables placing the municipalities in either Northern, Eastern, Western, Central/GTA or the Niagara Peninsula (with Central/GTA as the omitted regional comparison variable). Northern municipalities are Thunder Bay and Sudbury. Eastern municipalities are Ottawa and Kingston. Western municipalities include London, Windsor and Chatham-Kent. The Niagara peninsula includes Hamilton, St. Catharines and Niagara Falls. The remainder are in the Central/GTA region.


To account for bidirectional or simultaneous effects, this regression was used to estimate a fitted CSI from the estimated coefficients, and it was then used in the police officers per 100,000 regression as the crime variable. The remaining determinants in the police regression were average residential property taxes for a three-bedroom bungalow as a measure of potential community resources, population density (persons per square kilometre), and then again, the set of regional variables, which are included to capture regional differences that might uniquely affect not only crime rates and severity but also the operation of police services. For example, Indigenous peoples comprise a larger population share of Northern Ontario and according to self-reported information from the 2009 General Social survey (GSS), aboriginal people were two times more likely than non-aboriginal people to experience violent victimization such as an assault, sexual assault or robbery (232 versus 114 incidents per 1,000 population). The approach is essentially a simultaneous equations technique and also uses weighted regression where observations were weighted by municipal population size thereby providing greater weight to larger population size municipalities.

The results show that variables significantly affecting crime severity positively include police officers per 100,000 population and the regional variable with Northern and Western Ontario demonstrating higher crime rates relative to the Central/GTA municipalities. As well, crime severity is negatively and significantly related to average household incomes in the municipality. Crime severity is also positively and significantly related to police officers per 100,000, which can be interpreted either as having more police officers per person results in more crime being reported and dealt with, or more crime requires more police officers.

In the police determinants regression, police officers per 100,000 is positively and significantly related to crime severity (fitted) and population density. The only regional variable that’s significant here is Western Ontario and that variable shows that Western Ontario has fewer police officers per 100,000 in relation to the Central/GTA region, all other things given. Both regressions explain a high proportion of the variation in the dependent variables.

Having established a statistical relationship between policing resources and crime rates after accounting for a number of confounding factors, the next step (in the fourth and final post of this blog series) is to use these results to see what predicted police staffing levels are like and how they compare to actual levels.


Tuesday 7 February 2023

Policing and Crime in Ontario, Part 2: severity and levels

 This post originally appeared on the Fraser Institute Blog on February 6th.

While crime in Ontario has been rising recently, it’s still at comparatively low levels while the number the number of police officers per person is also relatively low. However, there are sometimes rather large differences across Ontario’s cities both in terms of police staffing, crime rates and crime severity. The reasons for these differences can be complex ranging from historical and institutional factors to geographic spread of municipalities and local policing environments rooted in different crime rates and types of crimes.

The chart below plots police officers per 100,000 population in 2021 for Ontario’s 30 largest municipalities by population and ranks them from highest to lowest. (Note that a number of these municipalities have regional police services and in the chart the per-person policing number for the regional service has been assigned to the municipality.) The average across these 30 municipalities is 144 officers per 100,000, which is below the provincial level of 176 per 100,000 reflecting higher police per 100,000 population in more rural or remote areas with large geographies and sparser populations.


The level of policing ranges from a high of 200.4 officers per 100,000 in Thunder Bay to a low of 117 per 100,000 for the set of communities in the Halton region—a substantial difference. The four highest number of officers per 100,000 are for Thunder Bay, Windsor, Brantford and Toronto, ranging respectively from 39 per cent to 17 per cent above the 30-municipality average of 144. Conversely, the four lowest communities of Milton, Burlington, Oakville and Waterloo (which incidentally are all part of regional forces) are respectively 12 per cent to 18 per cent below the average.

The second chart plots the ranked Crime Severity Index (CSI) for these 30 communities. The CSI is a relatively new tool that complements existing measures of traditional crime rates by taking severity and the volume of crime into account (Statistics Canada, 2009). All Criminal Code offences, including traffic offences and other federal statute offences, are included in the CSI. In the calculation of the CSI, each offence is assigned a weight, derived from average sentences handed down by criminal courts with more serious sentences on average for the crimes resulting in a higher weight for that offence. Thus, more serious offences (for example, homicides versus traffic offences) have a greater impact on changes in the index.


The results again show a substantial range in overall crime severity ranging from highs of 105 and 98 for Windsor and Thunder Bay to lows of about 23 for the Halton region communities of Oakville, Burlington and Milton with an average CSI across these 30 communities of 57. While there’s a wide range in crime severity across these Ontario cities, given that the CSI is standardized with Canada equal to 100, Ontario cities generally rank lower in crime severity than some other parts of Canada such as Manitoba, Saskatchewan and the Territories.

Again, it should be noted that a number of these municipalities have regional police services and the crime severity index as reported for the regional service has been assigned to the municipality. The communities with the highest crime severity are Windsor, Thunder Bay, Brantford and Sudbury, which range from 84 per cent to 54 per cent above the average crime severity. Meanwhile, for the communities at the bottom—Brampton, Oakville, Burlington and Milton—they are 35 per cent to 60 per cent below the average crime severity. Notably, the per cent differences from the average for crime severity across these communities is larger than the difference in policing resources.

Of course, when examining what crime is like in these same communities and ultimately what relation the municipality may have to policing resources, it’s important to bear in mind that the relationship between crime rates, crime severity and policing is bidirectional or somewhat murky. On the one hand, one would expect that more police, all other things given, should result in lower crime rates as more resources are brought to bear on the problems. At the same time, one might also find that higher crime rates spur calls for more police resources, which in turn results in the hiring of more police. Put another way, it’s sometimes difficult to sort out if more police officers result in less crime or more crime also leads to more police officers.

In the next post in this blog series, we’ll take a more in-depth look at the relationship between policing resources and crime severity in these Ontario communities.


Saturday 4 February 2023

Policing and Crime in Ontario: Part I


This is the first post in a blog series exploring the state of policing levels and crime rates in Ontario. This post first appeared on the Fraser Institute Blog, Feb. 3rd, 2023.

Municipal budget season in Ontario comes with an assortment of budgetary issues including proposed hefty increases in policing budgets partly fuelled by rising crime rates.

Recent proposals include:

  • A 4.3 per cent increase of police spending in Toronto, which would increase the police budget by $48.3 million to $1.17 billion, and an increase of 200 officers (in light of a planned 5.5 per cent increase in property taxes, this proposal has generated much debate).
  • A 5.6 per cent increase in the police budget in Sudbury, accompanied by a proposal for 15 new officer cadet hires and ultimately 24 new officer positions. The proposed hires come at a time when crime rates have not fluctuated a great deal.
  • In Hamilton, the Police Services Board asked for a 6.7 per cent increase ($12 million) in its budget that includes 18 new civilian positions and 13 new officers yearly.
  • In Thunder Bay, a proposed increase in the police budget for 2023 accounts for about one-third of the proposed 6.2 per cent tax levy increase and also includes the hiring of 21 positions.

When proposing these large budget requests, advocates often cite the effects of capital renewal, general inflation of operating costs, rising demand for police services given their more complicated roles (especially with respect to social and mental health issues) and rising crime rates—that is, the number of police service reported criminal code incidents per 100,000 population. As chart below shows, crimes rates in both Canada and Ontario have grown since 2015 but took a sharp drop in 2020 (the first pandemic year) and then resumed upwards.

However, by historical standards crime rates remain quite low. At the same time, policing numbers in both Canada and Ontario are also at comparatively low levels in terms of officers per 100,000 population over the 1986 to present period (see second chart below). Since the mid-1980s, there have been two peaks in officers per 100,000—1991 and 2010. Both peaks were followed by declines in the number of officers but the decline after 2010 appears more pronounced with officers per 100,000 population in Ontario declining from 200.3 in 2010 to 174.9 in 2019 (a 13 per cent drop) followed by a slight rebound to 176 by 2021.


Given these numbers are per 100,000 people, another factor in the demand for more officers is simply Ontario’s rapid population growth. Since 2010, Ontario’s population has increased from 13.1 million to 14.8 million (an increase of 13 per cent) while the total number of police officers has remained flat, hence the per-person decline.

In general, public debate on rising police costs should be considered within the context of overall public spending in Canada and the demands of a more complex society. Policing has evolved beyond just dealing with crime and includes a wider range of problem social behaviours, which are factors in police resource and expenditure growth.

The key question then in municipalities across Ontario is what should municipal councils do in response to demands for more policing? To answer that, we must know what the relationship between police resources and crime is and how that might shape the assorted requests across the province for larger police budgets. Given the diversity that is Ontario, in terms of the size and needs of its urban centres, there’s not a one-size-fits-all answer to such questions. In the next post in this series, we’ll explore the relationship between police staffing and crime severity across major Ontario municipalities.