Tuesday 30 August 2022

Your Next Thunder Bay City Council …According to TBNewswatch Polling


With the candidacy window closed as of August 19th, the race for the October 24th municipal election is now on and there is no shortage of candidates in Thunder Bay.  Every Ward has a race and the At-Large race has the usual bounty of candidates.  There are five candidates for Mayor, 24 for the At-Large race, three in Current River, two in McIntyre, four in McKellar, six in Neebing, five in Northwood, six in Red River and four in Westfort – a total of 59 candidates.  That pretty much matches the last time despite the lamentations of woe early on that there were no candidates.


The more interesting question in light of such a magnificent display of civic interest and spirit is who is going to win in each of the races.  TBNewswatch provides a valuable public service with its polls on various issues and it has over the period August 20 to 27 run polls for each of the races. Of course, this is not an unbiased random sampling procedure and one suspects the technologically savvy can affect the results but if these polls are accurate, this is what your next council may look like (percentage of votes cast in brackets)


Mayor                                      Ken Boschoff  (51.90 %)

At-Large Councillors                Mark Bentz (15.96%)

                                                Shane Judge (13.22%)

                                                Stephen Margarit (11.64%)

                                                Shelby Ch’ng (11.06%)

                                                Kasey Etreni (8.86%)

Red River                                 Martin Rukavina (28.83%)

McIntyre                                  Albert Aiello (50.16%)

Westfort                                 Kristen Oliver (49.27%)

Northwood                             Dominic Pasqualino (50.16%)

McKellar                                  Brian Hamilton (43.42%)

Current River                          Andrew Foulds (60.61%)

Neebing                                  Shaun Kennedy (39.22%)


Some of these wards appear to have closer races based on the TBNewswatch poll – namely Red River where Jason Veltri (24.45%)  is a close second, McIntyre where Brent Boyko is a very close (49.84%) second and McKellar where Lori Paras is close (39.95%).   This is not a scientific poll and even if it was, the only poll that counts is of course the one on election day.  Still, if these trends are on the mark, there may be substantial turnover on city council.  Change and new viewpoints can be very positive and many of these front runners are relatively known quantities while others are relative unknowns depending on what social circles you move in.


 It is worth googling these candidates and checking out their self-provided bios which provide an eclectic mix of entertaining and informative reading.  Some are quite informative and impressive, listing a series of career and community accomplishments. Some mention family relationships or their deep community connections to Thunder Bay. Some mention what they want to accomplish with an explicitness that may lose them as many votes as they may win, and some are vague to the point of not really saying anything at all by providing an endless string of platitudes.  The other thing worth noting is if one were to plot the candidates who seem to be leading the “poll” on a left/right or progressivist/passivist continuum, Thunder Bay is probably about to elect a council that is even less concerned about taxpayers and tax rates than the previous one. On the other hand, they may surprise us all with their fiscal astuteness.  Still, on voting day, choices must be made and if they turn out to be good ones, so much the better.


The next council inherits a lot of issues: crime and policing, social issues and homelessness and addiction, crumbling infrastructure, expensive lawsuits mainly linked to water and of course the still flat economy which has been masked by the generous amounts of government money that has flowed into Thunder Bay on both a private and public level.  New councillors will come in with pet projects and agendas but will quickly find that they must deal with resource constraints, a bureaucracy which generally has more information than they do and their own vested interests, and issues that will pop in from out of the blue.  New councillors will need to be quick learners, multi-talented, adaptable, patient and open to criticism both warranted and unwarranted and take it all in with a smile.  However, they will probably be spared from feeling like having to do windows on a skyscraper while perched on a precarious and narrow wooden seat. 


Wednesday 24 August 2022

Employment Density in Canadian CMAs

 Labor markets are at the forefront in terms of current policy issues given the shortages that are plaguing so many sectors in Canada's economy.  During the pandemic year, employment in Canada took a major hit but had largely recovered by the end of 2021.  When we look at employment and jobs in Canada using data from Statistics Canada, our usual approach to where the jobs are is something akin to what we see in Figure 1 below.  Canada has 35 major Census Metropolitan Areas (CMAs) each of which is a regional labor market on its own with employment opportunities that need to be filled and employment that is created. Canada's largest nodes of employment are Toronto, Montreal and Vancouver with average monthly employment in 2021 at 3.4, 2.4 and 1.5 million jobs respectively. The numbers fall quite dramatically after that and by 11th place London you below 300,000 jobs.  Twelve cities have fewer than 100,000 people employed ranging from Guelph at an average of 91,000 to Belleville which is just below 50,000.  Incidentally, Thunder Bay has the second smallest total number of jobs of these 35 Canadian CMAs.


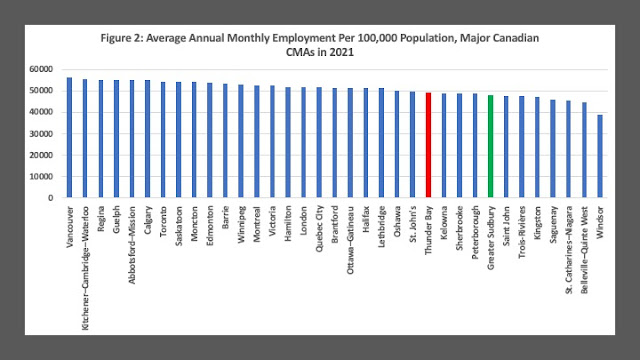
Of course, larger population centers generally are going to have more total employment.  Another way to look at employment is in terms of employment intensity or density.  In per capita terms, do some cities simply have more employment depth or density adjusted for population meaning ultimately more jobs and opportunity?  This is done in Figure 2 where the same cities are now ranked in terms of employment per 100,000 population.  The falloff from the top to bottom performers is no longer as dramatic when the comparison is done this way.  Vancouver is now the most employment dense CMA with 56,507 people employment per 100,000 population while Windsor is the least employment dense at 39,122.  Thunder Bay moves up significantly from the previous ranking now placing 24th out of 35.  Meanwhile, Toronto is not as employment dense as Regina or Guelph but tops Saskatoon and Moncton. 

A historical point: Thunder Bay's CMA population has not changed much in 40 years but its total employment prior to the forest sector crisis of the early 2000s used to fluctuate between 65,000 and 70,000 jobs whereas now it fluctuates around 60,000.  That means that several decades ago, Thunder Bay was more employment dense than the present. Naturally, a historical examination of employment density is in order for many Canadian CMAs but one suspects it would provide answers that many would rather not hear.


Still, if you are looking for employment nationally, it is not just the total size of the labour market in terms of jobs that you should be looking at but also the density of employment.  On the one hand, places with low employment density may be facing more of a labour shortage and therefore be a source of opportunity.  More likely, places with higher employment to population ratios are simply more dynamic economically and have more opportunities to offer.  Places with low employment to population ratios may simply be more economically depressed that those with higher ones. 

Monday 22 August 2022

Ontario's (And Canada's) Health System Crisis

 The current health care crisis is taking up alot of discussion in the media and the premiers are meeting in Moncton, New Brunswick today to discuss solution. My contribution in today's Hub is titled "Our health-care crisis is a problem of design, not resources."  It comes with a set of four charts providing select comparisons with the OECD countries.  For the charts with all the OECD countries for comparison, see below:


1. Data refer to practising physicians. Practising physicians are defined as those providing care directly to patients.

2. Data refer to professionally active physicians. They include practising physicians plus other physicians working in the health sector as managers, educators, researchers, etc. (adding another 5-10% of doctors).

3. Data refer to all physicians who are licensed to practice.


1. Data refer to practising nurses. Practising nurses are defined as those providing care directly to patients.

2. Data refer to professionally active nurses. They include practising nurses plus other nurses working in the health sector 

as managers, educators, researchers, etc. (adding another 5-10% of nurses).

3. Data refer to all nurses who are licensed to practice.

4. ONTARIO total includes RNs, Nurse Practitioners and Licensed Practical Nurses


Monday 15 August 2022

Physician Numbers in Canada and Ontario: Evolution and Ranking


The health system in Canada and Ontario is faced with shortages of health professionals in the wake of the COVID-19 pandemic.  Added to this is long-term rising demand for services because of an aging population as well as the impending retirement of large numbers of health professionals given the age distribution of the health work force.  Access to physicians – particularly family physicians - has been a long-standing issue in Canadian health care.  Yet, it remains that despite the constant perceived shortages, physician supply has been increasing.  Figure 1 and 2 present physicians per 100,00 population in Canada followed by Ontario for the period 1978 to 2020.  The plots use data from the Canadian Institute for Health Information/Scott’s Medical Data Base (CIHI/SMDB) and show physician intensity for total physicians as well as specialists and family physicians. 


After a period of growth from the late 1970s to the early 1990s, physician intensity showed little growth for nearly 15 years.  Starting approximately 2005, the number of physicians per 100,000 began to increase.  In Canada, total physicians per 100,000 rose from 190 to 242 between 2005 and 2020 – an increase of 27 percent.  Specialist density rose from 93 to 119 (28 percent growth) while family medicine physicians rose from 98 to 123 (a 26 percent increase).  Ontario exhibits a similar profile to Canada except that the 1990s to 2005 saw a more pronounced decline in physician density – particularly in family practice.  Since 2005, the total number of physicians per 100,000 rose from 177 to 232 – an increase of 31 percent.  Specialists grew from 92 per 100,000 to 114 – an increase of 24 percent – while family practice physicians rose from 85 per 100,000 to 115 – a 35 percent increase. 


Ontario was hit harder than Canada by the decline in physician intensity of the 1990s as shown in Figure 3 which plots total physicians per 100,000 population for Ontario and Canada. Up until the early 1990s, Ontario’s physician density was a bit above Canada but since then a persistent gap has opened up.  In 2020, Ontario had about 5 percent fewer physicians per 100,000 relative to Canada as a whole.  But the rest of Canada need not feel too smug.  When compared to the OECD countries or the G-7, Canada and Ontario do not fare particularly well with respect to physician numbers.  As Figure 4 illustrates for the period 2000 to 2020, Canada and Ontario are at the bottom of the G-7 countries as well as well below the OECD average.   


Germany and Italy are at the top of the G7 at 447 and 400 physicians per 100,000 population respectively.  The OECD average is 366.  In 2020, Canada was 34 percent below the OECD average with respect to physician density while Ontario was 37 percent lower. Canada gets by with many fewer physicians relative to other economically developed countries and Ontario gets by with even less.  While there has been substantial growth in physician density in Canada and Ontario since 2005, in Ontario population has also been growing quickly and  actually outstripped physician growth since 2018 actually resulting in a drop in the number of physicians per 100,000.