Monday 25 October 2021

Reforming Thunder Bay City Council


This evening’s Thunder Bay city council meeting is going to feature yet another scintillating debate on the size and composition of City Council.  This is another one of those Thunder Bay issues that has gone on for decades and rears its head usually as a vehicle for individual councilors to garner media attention and sell themselves as either reform minded or committed to safeguarding taxpayer dollars. In the end, the talk is as circular as the yet to be fully opened new roundabout at the intersection of Redwood and Edward.


 In this current iteration, councilor Peng You has put forward a notice of motion to reverse a decision made nearly a year ago to start work in 2023 reviewing municipal representation and council composition with an aim for a new system – if accepted - to be implemented for the 2026 municipal election.  If this decision is reversed by a two-thirds majority of council, then council would also be asked to consider a potential plebiscite question on the 2022 municipal ballot.  What exactly that question should be would no doubt then consume hours of debate.


To start, one suspects the motion will fall flat quickly. Most councilors are quite happy with the status quo of 12 councilors plus a mayor with 7 ward councilors and 5 at-large councilors.  After all, it has gotten them where they currently sit, and a smaller council will mean more competition for the remaining spots.  However, even a defeat of Councillor You’s motion will be useful to him as he will then be able to complain that his desire to save taxpayers money by advocating for a council of 8 at-large councilors plus one mayor has been thwarted by spendthrifts resistant to change – a useful mantra when one has plans for running for higher office.


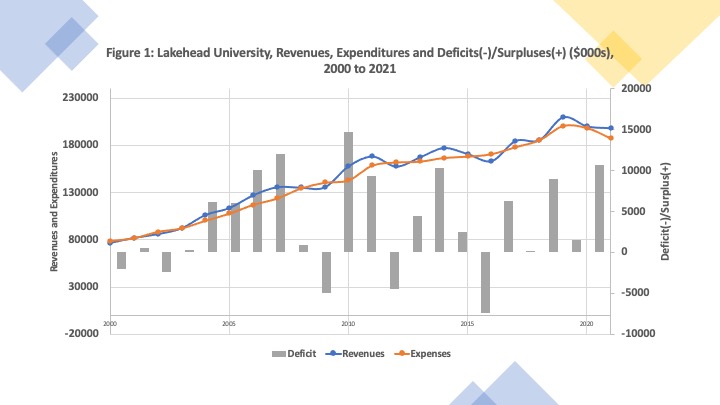
The problem is that changing the system of municipal representation in Thunder Bay – an institutional compromise devised nearly 50 years ago to balance the north-south population division of the city – needs to be done thoughtfully. It is true that there are more councilors per capita in Thunder Bay than is the case in quite a few other cities.  At the same time, that is what happens when you devise a hybrid model of representation to combine ward specific interests with at large viewpoints designed to represent the whole.  Simply reducing the number of councilors is not going to save a meaningful sum of money – the total cost of all the councilors in terms of their stipends and expenses is currently well under one million dollars on an operating budget close to $200 million – under one half of one percent. Indeed, one can even make the case that they should use the meager savings from reducing the size of council to pay the remainder more to attract a better quality of candidate – which in the end really would not save any money on representation though it might lead to better civic decision making in the long run.


And then there is the issue of representation.  Should we have only at-large councilors who could all end up being from more affluent parts of the city as can sometimes be the case?  If we go to a smaller council, can we ensure that it will make better decisions or will the reduction in representation simply reduce the number of viewpoints. And then there is the fundamental issue of at-large or ward representation.  If we go totally to ward representation, what will the boundaries of a new ward system be?  Can we design some north-south ward boundaries given the geographic population distribution which still resembles that of 50 years ago? 


The case decades ago for at-large councilors was that in the wake of amalgamation and the Fort William-Port Arthur split, having purely ward representation would lead to parochial decision making and deadlock.  However, fifty years after amalgamation, is that division still as important in how municipal politicians approach issues? Surely, ward councilors can be just as capable as at-large councilors of taking the entire city’s interests into mind.  And then, it remains that much of what the city does is local service provision and ward councilors are the best located as the focal points of concerns in specific neighborhoods rather than at-large politicians using their councilor positions to prepare for higher office.


In the end, the councilors should leave the issue as it was decided a year ago and let the city clerk’s office review the boundaries of wards and provide options for composition of City Council.  Better yet, given that city administration ultimately has an interest in the design of any council, it would be better if more of an effort was  made to commission an independent arm’s length panel to review the situation and present options to council.  Whatever happens, one can rest assured that there is not going to be any radical changes in the size and composition of council decided by council and city administration as it is akin to asking predatory foxes to provide policy on the hen house. Any radical institutional change will occur as it did prior to amalgamation in 1970 – by provincial fiat or decree. Quite frankly, I don’t think the province is interested this time around.


Saturday 23 October 2021

Ontario’s Pandemic Sees Light at the End of the Tunnel But Not for All


Ontario is holding out the hope of light at the end of the COVID-19 tunnel as its daily case counts hover around 400 and a post-Thanksgiving Weekend surge has not materialized.  As a result, the provincial government is beginning a lifting of capacity limits for Ontario bars, gyms and restaurants starting Monday the 25th and has outlined a long-term plan that could see all restriction lifted by March of 2022 – including mask mandates and vaccine-certificate rules. 


However, the government maintains that it will pursue a cautious approach that will monitor assorted indicators that could prompt a tightening of restrictions if necessary.  That may indeed be the result given that countries such as Denmark and Finland which eased restrictions – including masking – have seen a rebound in COVID cases despite high vaccination rates. Reasonably good vaccination rate compliance and masking in public places are probably the key reason why Ontario has not seen a rebound this fall.  However, the announcement that vaccine certificate requirements may be lifted in the spring will not do anything to incentive the remaining 25 percent of Ontarians who have yet to get fully vaccinated.


And, while light at the end of the tunnel may be coming for many Ontarians, the contrary seems to be underway in the province’s long-term care homes.  The rather large proportion of staff in long-term care homes that have still not been fully vaccinated means that the risk of the virus being carried into homes is still high.  Even fully vaccinated residents of LTC homes are still vulnerable given their waning immunity and frailty.  As a result, the Ontario government is creating new requirements.


As provided in an October 1st news release:


Vaccination rates of staff in many homes are not high enough in the face of the risk posed by the Delta variant, and this is putting vulnerable residents at risk. To ensure the health and safety of staff and residents, mandating vaccination for in- home staff has now become essential, and homes are now required to meet the following requirements:


·      Staff, support workers, students, and volunteers will have until November 15, 2021 to show proof that they have received all required doses of a COVID-19 vaccine, or to show proof of a valid medical exemption.

·      Staff who do not have all required doses or a valid medical exemption by the deadline will not be able to enter a long- term care home to work.

·      Newly hired staff will be required to be fully vaccinated before they begin working in a home unless they have a valid medical exemption.

·      Homes will begin randomly testing fully vaccinated individuals, including staff, caregivers and visitors, to help detect possible breakthrough cases of COVID-19 as early as possible.


In addition to adding randomized testing of vaccinated individuals, homes will continue to regularly test individuals who are not fully vaccinated. The ministry will leverage provincial testing resources to inspect and audit these results by sending testing teams into homes to validate the results that homes have been reporting to the province. The ministry will also step up rigorous inspections of homes’ infection, prevention and control measures.”


The provincial government is understandably nervous about the long-term care sector given that 41 percent of the province’s COVID-19 deaths to date have been long-term care residents given such residents number about 115,000 – just barely over half of one percent of the province’s population.  There have continued to be outbreaks with 5 LTC homes in Ontario currently experiencing an outbreak – all in southern Ontario.  The government recognizes that the vaccination rates are not high enough and has mandated them by November 15th and yet it obviously does not believe it is going to happen because it is mandating additional testing requirements. Yet, what is more interesting is the response of the long-term care sector to the announcements. 


Take for example the Southbridge Group which has interpreted the provincial requirements as follows and applied them to all their homes across the province:


1. Fully vaccinated essential caregivers and visitors shall be required to do a COVID-19 rapid test once a week. Daily swab clinics will be held Monday to Sunday from 10am- 6pm.

2. Essential caregivers and visitors who have received only a single dose of the COVID-19 vaccine (i.e. partially vaccinated) shall be required to do a COVID-19 rapid test every day they attend the home up to 14 days after the day they receive their second shots. After this time, they will follow the testing frequency listed in #1 above.

3. Essential caregivers and visitors who are unvaccinated will be required to do a rapid test every day they attend the home.


We also ask that unvaccinated essential caregivers and visitors should limit their movement only to the room of the resident they are visiting and should refrain from going to common areas such as dinning or lounge rooms where other residents are congregated.


This is a particularly interesting interpretation of “randomized testing.” A quick search reveals that the definition of “random” as usually applied in statistics or polling is: “made, done., happening, or chosen without method or conscious decision”.  So, one might expect that 1 in every 20 visitors might be selected for testing or perhaps 1 in 10.  A test at least once a week for everyone is not random no matter what the business school graduate brainiacs at corporate head office might think.  Applying testing to both the fully vaccinated as well as the unvaccinated equally seems a bit unreasonable but acceptable if it truly is random.  Mandatory testing for the unvaccinated and random testing for the fully vaccinated seems more reasonable.  However, this application of the requirements treats everyone the same – vaccinated or unvaccinated - a one size fits all policy – that in the end is being done because so many long-term-care staff and workers and even visitors are apparently still unvaccinated.  And why 10am to 6pm only for testing?  What if a family member wants to visit in the late evening after a long day at work or early in the morning before work?


And what is more interesting is that the anecdotal evidence - gleaned from others who like myself who have a loved one in long-term care - suggests the application of the new provincial requirements differs across homes in Ontario and often even the same community.  Some homes are indeed testing randomly all staff and visitors, some say fully vaccinated visitors and caregivers will not be tested at all, some are testing everyone irregardless of vaccine status, some say you can now only visit in the resident’s room, while others say you can help feed the residents in the dining room.  Moreover, unlike the provincial approach to the relaxation of restrictions which ostensibly is going to be attuned to case counts and local conditions, there is no evidence that the LTC sector is using local case counts in their approach in terms of a measured approach to the new restriction requirements.  For some LTC homes, It is essentially a fortress mentality that is turning LTC homes into prisons.


Overall, the Southbridge rules – and likely those of other homes and providers across the province –represent a return to a much more restrictive set of rules.  This is after a gradual easing of restrictions during the summer and early fall that saw a somewhat more normal pattern of visitation.  The new requirements for many will in the end discourage visitation to the homes further accelerating the decline in the condition of residents that became apparent during the pandemic when personal visitation ceased completely.   One understands the skittishness particularly in the case of for-profit LTC homes given that their deaths rates from COVID were higher.  And yet, there must be a better way.  The long-term care sector needs to think more creatively and employ fewer one size fits all solutions and more outside the box solutions to balance resident safety with resident needs for frequent care and visitation. 


Friday 15 October 2021

Ontario’s Pandemic: The Beginning of the End or the End of the Beginning?


The last few weeks have seen a major improvement in Ontario’s daily COVID-19 case account.  The fourth wave seems to have peaked at just under 1,000 daily cases several weeks ago and for the last seven days has averaged under 500 daily cases (See Figure).  This is at the bottom of the scenarios that were envisaged just a short while ago as the fourth wave picked up steam and this may indeed be the beginning of the end of the pandemic in Ontario. At the same time, we may simply be embarking on a new post-pandemic era characterized by intermittent ebbs and flows of infection and a long-term change in how things are done.  In the end, it has been a remarkable learning process.


We appear to owe this new diminished phase of the pandemic partly to continued public restrictions with respect to the wearing of masks in public places and the high rates of vaccination.   The prolonged restrictions and phased in reopening over the summer has also been wise given the experience of Alberta and Saskatchewan with the Delta variant.  The high rates of vaccination in the province have been having their desired effects and the onset of the vaccine passport system has encouraged more hold backs to go and get vaccinated.  Yet, there are bumps.  The fact that the new QR code vaccine passport many can download for the first time today requires iOS 15 - for many of us a new iPhone - means a lot of us are not going to be conveniently loading it into our Apple Wallets.


And while the provincial government is apparently planning to announce a further relaxation next week in pandemic restrictions dealing with capacities in assorted public venues at the same time, it is announcing new restrictions reflecting slower progress in other areas.  The easing of pandemic measures will include ending capacity limits in all locations where proof-of-vaccination requirements are in place, such as restaurants, bars and gyms, a senior official in Ford's government said on Wednesday.  To its credit, it is going to retain the requirement for masking in public spaces.  Moreover, future outbreaks will apparently be met with more local response as opposed to province wide one size fits all provincial lock downs though my guess is that is more aspirational given the heavy handed tendency towards centralization of policy at Queen’s Park.


At the same time, it has been recently announced that long-term care homes will be instituting testing for staff and visitors whether doubly vaccinated or not at the same time that it is mandating vaccines for all long-term care home staff by November 15th.  While this continued testing has been out forth as “random” testing to provide early detection of breakthrough cases, some evidence to date suggests that Ontario LTC homes will be interpreting it as weekly testing suggesting that things will not be going back to normal for some time. Calling it "random" may be government political word massage to make visitors to LTC homes think it is not going to be formalized but it remains that the Oxford Dictionary defines random as: "done, chosen, etc. without somebody deciding in advance what is going to happen, or without any regular pattern" and not something done on a weekly basis.


The fact that testing is going to be used on doubly vaccinated individuals (who granted can still transmit the virus) while some hospitals have announced that visitors (to be clear not patients) will require double vaccination to get in to see their loved ones suggests that the real elephant in the room is still the high proportion of not vaccinated people in Ontario – for which a lot of other vaccinated people will continue to pay the price.  It remains that as of today only 73 percent of all people in Ontario are fully vaccinated.  And in long-term care homes, as of the latest figures for end of August, more than half of homes had less than 90 percent of their staff doubly vaccinated.


So, practice and implementation continue to lag science and evidence though the other revealing result of this pandemic has been how much public health, epidemiology and infectious disease science is a lot more like economic science than they would care to admit.  When it comes to scientific expertise, the pandemic has revealed that we are all economists now. Economists have been the butt of jokes for years about how their economic forecasts always seemed off the mark and yet during the pandemic, epidemiologists, bio-statisticians, and other assorted medical experts, have joined the ranks of economists and weather forecasters – not just in the range of forecasts provided but by the constantly shifting advice.   One does not have to think that far back to recall debates and discussion over whether to close border or wait, aerosol transmission or not aerosol, masks are effective or not effective, take AstraZeneca, don’t take AstraZeneca, etc.


In the end, this will hopefully be a humbling experience for science that will improve it.  Economic science, like the other sciences is evidence based and empirical with theoretical frameworks driving the analysis.  Facts are indeed facts but interpretation of the facts via theory and explanation is open to debate, consensus only evolves over time, and most importantly:  decision and policy making based on the evidence and the conclusions drawn from the evidence in the end is not done by the scientists but by politicians and civil servants who have agendas and constraints of their own not least of which is public reception and compliance.  The decisions in the end have been much more coloured by the art of the possible than many would have liked. We are indeed at an end but the drama continues.

Saturday 9 October 2021

The Finances of the University-Lakehead Edition


Many will have caught Alex Usher’s post on HESA dealing with university finances in Canada during the pandemic year which paints a surprisingly different picture of university finances than what one might expect.  Of the 34 universities with data available for the 2020-21 fiscal year, 30 of them posted surpluses and some of them were quite staggering.  For example, a 726 million-dollar surplus at University of Toronto (a $441 million surplus the year previous) or Queen’s with $144 million surplus (year previous was $35.7 million).  This seems quite at odds with the sky is falling scenarios that propagated the early part of the pandemic as universities argued that they were going to lose money. So how did this happen?


According to Usher: “Well, apart from the University of Saskatchewan (where the turnaround was mostly due to a quite amazing uptick in the investment portfolio), the formula was pretty simple.  Overall, university revenues rose slightly – about 2.6% in nominal terms – while expenditures stayed unchanged.   Essentially, the savings from keeping campuses closed offset the usual 2-3% growth in salary costs.”  Indeed, as he concludes: “universities did not in fact lose money during the pandemic.  They cut their budgets in anticipation of a fall in revenue and then the fall never came.  They will be in good shape to deal with the next year or two when, I suspect, we will see a bit more labour militancy that we’ve seen for awhile.”


So of course, the interesting question is how did Lakehead University do?  Well, Lakehead has also done surprisingly well according to its 2020-2021 financial statement that was recently released. From 2020 to 2021, revenues did fall slightly from $200.2 million to $198.3 million – a drop of just under one percent.  However, total expenses fell even faster going from $198.7 million in 2020 to $187.6 million in 2021 – a drop of 5.5 percent.  As a result, there was an operating surplus of $10.691 million in 2021 which was up from a surplus of $$1.542 million in 2020.  And this was before the unrealized gains from an interest rate swap are factored in which brings the total surplus to $14.456 million.  It turns out Lakehead, like Saskatchewan, did very well on its investment portfolio seeing an increase in investment income from $3.4 million the year before to $20.055 million – a staggering 488 percent.  One wonders why their management of their own investment portfolio does not translate into better management of the university pension plan – one of the worst university pensions in the country in terms of the benefits provided to retirees but I digress.


On the revenue side, aside from investment returns it turns out everything else was down.  Government general grant revenue was down 3 percent while student fees were down 1.5 percent.  There was a slight fall in enrollment which accounts for this as total enrollment (full-time and part-time students) went from 8505 to 8365 – a decline of 1.6 percent.  However, the good news is that 2021-22 is expected to see a rebound with total enrollment currently estimated at about 8668 – an increase of about 3.6 percent.  So, one can expect both tuition and grant revenue to rebound this year. 


As for expenses, well salaries and benefits were down -0.3 percent, supplies for operations were -25 percent, the costs of operating assorted sales and services were -61 percent, building and equipment maintenance costs were -19 percent and travel was down a remarkable 93 percent – from $4.1 million the year before to $302 thousand during the pandemic year.  This may prove to be one of the more important cost savings as the constant shuttling of administrators and staff from Thunder Bay to Orillia and Toronto obviously can be replaced by Zoom technology.  As for salaries and benefits, the university took full advantage of the provincial restraint salary guidelines thereby keeping compensation cost growth low and that will continue this year given the contract that was negotiated.  And, it turns out that having all the faculty and staff work from home saved several million dollars in operations and maintenance as costs like utilities were shifted onto employee home budgets.


So, in the end the sky did not fall and when the last year is placed in long-term context, Lakehead’s finances are indeed looking quite robust.  Figure 1 plots revenues, expenditures, and deficits since 2000 and they show growing revenues and expenditures and deficits in only 5 of the last 21 years. The last five years have seen a string of operating surpluses of which 2020-21 is the largest. Indeed, Lakehead has seen an accumulated surplus since 2020 of $83 million dollars.  Where has that money gone? Likely into the university’s long-term investment portfolio which according to the financial statement sits at about $144 million dollars and of course this year earned a whopping $20 million dollar return.  It certainly has not gone into paying down the debt which as Figure 2 shows went up $8.038 million in 2020-21 from th year previous to reach $106.6 billion.  This was to finance the athletic facility expansion. 


When it comes to long-term major revenue performance as depicted in Figure 3, government grants in total dollars have been flat at about $65 million annually since 2010 and as a share of total revenue have declined from a peak of 43 percent in 2009 to reach 32 percent at present.  As for student fees (tuition), it has grown dramatically since 2010 –nearly doubling from about $43 million in 2010 to reach $84 million at present.  Figure 4 shows that enrollment growth is only partially responsible for this because despite the long-term upward trend, total enrollment is about where it was a decade ago and has been recovering after a decline.  What has changed is the composition of the students as there has been a larger share of international; students who also pay much higher tuition.


So, there you have it.  Lakehead’s finances during the pandemic were quite good and come on top of a long-term stable and improving financial situation marked by rising revenues, enrollment growth and an expanding university investment portfolio.  This echoes the comments made by the university during the situation at Laurentian that Lakehead is "very financially sound".  That is good to know. If Alex Usher is right, Lakehead like the rest of the university sector will see increasing calls from its faculty and staff for a return on their investment of time and personal resources into the operations and success of the university.

Sunday 3 October 2021

Vaccination Status in Ontario Long-Term Care Homes


On Friday afternoon, Ontario‘s Ministry of Long-Term Care released first and second dose vaccination rates for all of Ontario’s 626 long-term care homes.  The numbers are quite interesting. Figure 1 ranks the 34 public health units by the average of the second dose vaccination rates for their long-term care homes.  At the top at 91 percent is Ottawa Public Health followed closely by York Region and Toronto Public Health at 90 percent.  At the bottom are Chatham-Kent, Haldimand-Norfolk, and Timiskaming at 81, 80 and 79 percent respectively.  


While this does not seem like a substantial range, the range is more marked when the individual homes are ranked from highest to lowest as illustrated in Figure 2. Of Ontario’s 626 LTC homes, 5 have 100 percent second does vaccination rates - North Shore Health Network - Eldcap Unit (Algoma PHU), Dundas Manor Nursing Home (Eastern Ontario PHU), The Fordwich Village Nursing Home (Huron-Perth PHU), William A. 'Bill' George Extended Care Facility (Northwestern PHU) and Morriston Park Nursing Home (Wellington-Dufferin PHU).  Of Ontario’s 626 LTC homes, only 13 percent of them have second dose vaccination rates at 95 percent or greater.  About 17 percent of these homes have less than 80 percent of their staff vaccinated with some below 60 percent. Indeed, the drop off after 70 percent is quite steep.


For those that are interested, the northern Ontario public health units are all over the range of vaccination with Northwestern Health Unit at the top and Temiskaming at the bottom.  Thunder Bay District Health Unit, which is at the top of performance for vaccination rates in the general population is near the bottom third when it comes to second does for its LTC home staff. The rates range from 97 percent for Nipigon District Memorial Hospital to 77 percent for Hogarth Riverview.  Southbridge Roseview – the site of Thunder Bay’s major LTC pandemic outbreak is 9th out the ten district LTC homes coming in surprisingly at only 78 percent with a second doses.  There is substantial room for improvement when it comes to some of the LTC homes in Thunder Bay District given that only one of the ten is over 95 percent for second vaccination status rates.


The more interest question is why such variation exists across the province.  There seems to be no obvious regional pattern to the vaccination rates as the dispersion simply in northern Ontario alone would attest. Indeed, when the second does vaccination rates are ranked by averages for Ontario economic region, they range from highs of 88 percent for Ottawa (510) and the GTA (530), followed by 87 percent for Stratford-Bruce (580) and the Northwest (595) with the Northeast (590), London (560) and Windsor-Sarnia (570) at 85, 84 and 82 percent. A regression of vaccination rates by LTC on a constant and economic region dummy variable (eleven but with the GTA omitted as the reference variable) finds a very low r-squared (5 percent) but four regions have statistically significantly lower vaccination rates relative to the GTA.  They are Hamilton-Niagara at 4 percent lower second dose rates relative to the GTA homes, London at 5 percent lower, Windsor Sarnia at 7 percent lower and the Northeast at 4 percent lower. 


Even for those  that were statistically significant, they are quantitatively not large differences, So, what explains 95 percent of the variation in vaccination rates across LTC care homes? Good question.  One suspects a lot has to do with home specific factors including local management, staff culture and unique local environmental conditions.  There is room for improvement and the requirement for mandatory COVID-19 vaccination for Ontario long-term care workers by November 15th is probably the best way to close these gaps.