Wednesday 26 May 2021

Canada's COVID 19 Performance: Oped


Canada’s COVID performance on key measures among worst in developed world

Livio Di Matteo 
Appeared in the Globe and Mail, May 26, 2021

There have been more than 167 million COVID-19 cases worldwide and 3.5 million deaths. Canada ranks 22nd in the world with more than 1.3 million cases and more than 25,000 deaths. Given the spread of new variants and varying vaccination rates around the world, the effects of the pandemic will be with us for some time to come.

But how does Canada compare to other advanced countries? For 2020, COVID cases per million ranged from a high of 87,000 (Czech Republic) to a low of 7 (Taiwan). Canada (approximately 19,000) ranked 24th out of 35 advanced countries. Deaths per million ranged from a high of almost 1,800 (Belgium) to 0.3 (Taiwan), with Canada in 22nd place (approximately 500 deaths per million).

However, on a crucial measure—the “case fatality rate” (total deaths from COVID-19 as a percentage of total COVID-19 cases), Canada in 2020 had the 7th highest rate (meaning 7th worst) in the developed world, due primarily to COVID’s impact on Canadians in long-term care. In 2020, 11 per cent of Canada’s COVID-19 cases, and more than 70 per cent of COVID-19 deaths, were in long-term care facilities. According to the Canadian Institute for Health Information, while Canada’s overall COVID-19 mortality rate was relatively low compared with rates in other OECD countries, we had the highest proportion of deaths in long-term care. If we’ve learned anything from COVID, it’s that we must do a much better job with long-term care here at home.

Unfortunately, lessons provided are not always lessons learned. Crucially, Canada failed to learn from the SARS outbreak.

Between 2002 and 2004, some 30 countries reported SARS cases, with only eight countries reporting more than 10 cases and only five (China, Hong Kong, Taiwan, Singapore and Canada) reporting more than 100 cases. Fast-forward to 2020, these five countries combined reported about 18,000 fewer COVID-19 cases (per million) compared to countries that did not experience SARS. Apparently, countries heavily hit by SARS learned something about how to prevent viral spread during a pandemic. Except Canada. While Hong Kong, Singapore, China and Taiwan in 2020 saw COVID-19 deaths (per million) range from 22 to 0.3, Canada reported nearly 500 deaths per million. In this key five-country group, Canada was an outlier.

Why? Post-SARS, governments in Canada studied and planned for future pandemics and increased spending on public health measures. Yet we were still unprepared for COVID-19. For example, in the years before the pandemic, the federal government seemingly (and quietly) deactivated its pandemic early warning system, failed to maintain stockpiles of personal protective equipment (e.g. masks), and once the pandemic began often moved slowly to deal with its impact. On the other hand, following its SARS epidemic, Taiwan established a National Command Centre in 2004, which helped coordinate and map out its current—and significantly more successful—pandemic response.

As for other lessons from around the world, high rates of testing remain an important factor, with each additional 100,000 tests (per million) associated with 21 fewer COVID-19 deaths per million. Last year Canada ranked 26th out of 35 advanced economies for COVID-19 tests per million.

Another important factor was the number of hospital beds per 1,000, with each additional bed associated with 31.5 fewer COVID-19 deaths per million. Among 35 advanced countries, Canada ranked 32nd for the number of hospital beds. What does that look like? Again, among advanced countries, hospital beds per 1,000 ranged from 13.1 (Japan) to 2.2 (Sweden), with Canada near the bottom at 2.5.

In summary, key deficiencies in Canada’s pre-pandemic preparation and response capability (even after the lessons of SARS), combined with low rates of testing, low numbers of hospital beds, and an inadequately prepared and protected long-term care sector, have produced relatively poor results, particularly on certain measures of mortality. As a result, Canada was forced to rely on lockdowns and other stringent measures, which—while effective during the first wave—were less effective as time wore on and Canadians grew tired and confused with the shifting rules. And it’s the restrictions imposed by government, not the pandemic’s death rates, which caused the economic disruption that will continue until a sufficient proportion of the population has been vaccinated and we reach some level of herd immunity.

In light of the suffering we’ve witnessed across the country, let’s hope we actually learn more this time around.

Monday 17 May 2021

Economic Development Action in Thunder Bay: City Council’s Keynesian Economic Action Plan


As Thunder Bay’s leaky pipe saga continues with lawn after lawn being dug up to replace service lines likely corroded by the addition of sodium hydroxide as a lead mitigation strategy, one might indeed be hard pressed to find a silver lining.  However, one is surprised that the more pollyannish members of City Council have not seized on the obvious boost to Thunder Bay’s economy from the ample work being generated for plumbers, hardware purveyors, asphalting and landscaping companies – not to mention city employees – from the continual calls to replace interior plumbing and service lines.  Indeed, one is astounded that there has not been an economic impact tally of the boost to the city’s GDP from all the construction work and at a bargain basement price with respect to city coffers.


For a modest investment in sodium hydroxide of only several hundred thousand dollars a year over approximately three years – probably not more than $1 million - there have been thousands of homes that have had to incur thousands of dollars in repairs.  If one assumes only a modest 3,700 affected households (based on the current membership of the Thunder Bay Leaky Pipe Club Facebook page) and assumes an average of $5,000 in spending for each, why the direct spending impact is already just shy of $20 million dollars.  The economic multiplier is an astounding value of 20 – something unheard of in municipal economic impact circles and the likely recipient of an Economic Development Commission Powerpoint presentation or two at the next NOMA meetings.


It would appear that Thunder Bay City Council and Administration have been inordinately clever embarking on a massive urban infrastructure renewal program and doing it for a pittance.  Indeed, they have not even had to borrow as the stimulus spending in question has been provided directly by affected households or their insurance companies. The constant parade of diggers in many neighborhoods across town has given new meaning to the term shovel ready infrastructure projects and the demonstrable associated benefits of increased employment and income.


Indeed, this is the ultimate Keynesian aggregate demand stimulus activity.  It does not matter if the spending is needed or not, as long as it occurs, it can stimulate aggregate demand and create employment and boost income especially if there is involuntary unemployment. Involuntary unemployment is when a person is willing and able to work at the prevailing wage as opposed to voluntary unemployment which is something members of City Council are more likely familiar with.  The benefits of building projects was noted by Lord Keynes himself when he  noted in his General Theory that “Pyramid-building, earthquakes, even wars may serve to increase wealth, if the education of our statesmen on the principles of the classical economics stands in the way of anything better.”


Of course, it is unlikely that City Council deliberately embarked on this as a Keynesian economic stimulus program given that they probably do not know what Keynesian means.  Indeed, upon stumbling across  the term, they probably hear “Canesian” and think it is some type of descriptor of a program at the 55 Plus Centre on Red River for senior citizens who when afflicted with ambulatory difficulties make use of a pole-like device for vertical as opposed to fiscal stabilization purposes. 


However, if they are interested in expanding their understanding and implementation  of Keynesian policy, they might heed Lord Keynes when he wrote: “If the Treasury were to fill old bottles with banknotes, bury them at suitable depths in disused coalmines which are then filled to the surface with town rubbish, and leave it to private enterprise on well-tried principles of laissez-faire to dig up the notes again...there need be no more unemployment…the real income of the community and its capital wealth also, would probably become a good deal greater than it is.”  One is surprised city workers are not dropping off bottles of cash for burial when water service lines are repaired so that affected homeowners can then dig them up again and generate yet another round of spending stimulus.


So, there you have it.  Thunder Bay truly understands the power of private enterprise and individual initiative as well as Keynesian aggregate demand policy.  That is perhaps why Thunder Bay City Council after discouraging a private solution now finally wants to harness private enterprise to build its multi-use turf facility.  The economic activity it has generated via the Leaky Pipe Expenditure Stimulator has generated enough of a boost to GDP and the tax base to now support a private sector turf facility option.


Tuesday 11 May 2021

Ontario Employment During a Pandemic Year

 Statistics Canada's April 2021 Labour Force survey results show the employment effects of the third wave lock-downs in Canada and Ontario.  Indeed, of the 207,000 jobs lost in Canada between March and April, about three quarters (153,000) were in Ontario with a sizeable portion of the losses amongst youth (73,000). and in Toronto (53,000).   However, the monthly numbers obscure the fact that for the most part, there has been an employment recovery underway in Ontario.  From a peak of 7,487,300 jobs in February of 2020, employment in Ontario fell 13 percent to bottom out at 6,497,300 in June of 2020 before starting to rise again and as of April 2021 stood at 7,256,500 jobs.  However, this employment level is still nearly 231,000 jobs below the February 2020 employment peak.

Based on the April numbers, year over year we are up 257,000 jobs or about 3.7 percent.  The accompanying figure plots major Ontario urban centers and Ontario as a whole in terms of the ranked percentage employment gains from April 2020 to April 2021.  It also includes the percentage change from February 2020 to April 2020.  Peterborough, Windsor and Brantford, have seen the largest percent employment gains over the course of the last twelve months.  Indeed, if one goes back to February 2020, Peterborough is up 5,000 jobs from the February employment peak - or nearly 9 percent.   Brantford is also up from its February peak as are Guelph and London.  

Everyone else is still below where they were in February of 2020.  The worst year over year performances are in Sudbury, Oshawa and Barrie, which range from a 0 percent increase to a six percent drop.  Indeed, Barrie is down over 15,000 jobs since February of 2020 for a total drop of 12 percent.  Barrie's recovery appears to have peaked in August of 2021 and has come down in employment terms since. 

And of course, there is the biggest job engine of them all - Toronto. Here the year over year April numbers are up 2.2 percent - for an increase of 70,600 jobs but Toronto is still down 180,000 jobs from its February 2020 peak.  So, nearly a year and a half into the pandemic, Ontario is still hurting with Toronto the largest source of missing jobs.  


Friday 7 May 2021

Serving up a Multi-Use Pig's Breakfast


Well, the goings on at Thunder Bay City Council are about to take another interesting turn as the options regarding the Multi-Use Turf Facility are about to be reserved as a re-warmed back to the future option.  As we all know, Thunder Bay City Council voted 7-5 against awarding a tender for construction of the project which with a debenture and interest would have cost $46 million.  Many in the community balked at this type of expense coming at a time when economic prospects are uncertain given the pandemic as well as the incidence of other infrastructure issues including the ongoing leaky pipe saga and a new police station.


In the wake of this setback for the proponents of the project, there has been a regrouping to consider further options including perhaps relocating to the area near the Canada Games Complex given the better soil conditions as well as access to municipal infrastructure.  The previous project was quite expensive in part because of the need to extend some municipal infrastructure (such as water) as well as drive piles more than a few stories underground to support the structure. 


Now the options include going back to a bubble dome concept at the CLE Grounds as articulated by one councillor in an op-ed which essentially amounts to rebuilding what was there in the same manner.  Apparently this might cost about $5 million on the part of the City of Thunder Bay (which is indeed substantially lower than the previous $46 million fixed roof option) and has even garnered nearly 60 percent support in a TBNewswatch Poll.  Needless to say, there will likely be pushback from the Mayor and other supporters of the fixed roof option.  And while the new proposal for reconstituting the bubble on its former site makes a lot of sense, the question remains why spend $5 million on that when private interests would have built it out of their own money – an option the city of Thunder Bay did not support.  Indeed, this alternate proposal now seems to have lapsed.


This has become a veritable pig’s breakfast of a policy issue and in the end a lot of time has been wasted in this discussion coming full circle like this.  Apparently vehicular roundabouts are not the only circular projects Thunder Bay City Council likes, as policy roundabouts and turns are also another specialty.  While this is the most sensible option, it has become pretty clear that it is was not a more expensive turf facility per se that was the preferred option of Thunder Bay City Council but any option that involved spending municipal money rather than allowing a private sector solution.  Still, at $5 million, this may swing over a number of others on Council.  This type of facility is actually something that should occur  by the current needs of the recreation community in Thunder Bay. 


If this is really about providing a venue for soccer, then this is probably as good as it gets. The savings of going with a bubble dome option are substantial and needed.  After all, the City of Thunder Bay faces numerous expenses from assorted lawsuits in the years to come over issues with its water system going back to the 2012 flood.  And there are likely more lawsuits to come from insurance companies as they quietly collect samples of leaky pipes from assorted households and do their own analysis before launching massive suits to recover their costs.  If Thunder Bay City Council really wants to get a facility in place before other unforeseen expenses pile up, they might want to act quickly before they are diverted again on the policy roundabout.


Tuesday 4 May 2021

Ontario's War on Universities: Coincidence, Incompetence or Strategy?


As the Laurentian saga continues to unfold, one is forced to consider the possibility that what is in play in Ontario is not a one-off event of an unfortunate university that did not manage its finances well but perhaps a broader strategy to restructure the university sector.  While such an opinion will be labelled as paranoia by many it remains that a number of variables seem to be coming together that may ultimately create a number of Laurentians. 


If this is happening by coincidence, then it is ultimately a reflection of the inconsistency and incompetence of government policies. If it is not a coincidence, then it remains that perhaps conditions are being created to provide incentives for universities to change in a manner that the Ontario government thinks they should. It is no secret that governments have a predisposition for professional programs as opposed to arts and science and the list of the 69 discontinued programs at Laurentian happens to include a rather large number of arts, science and social science programs. 


Universities are semi-autonomous and increasingly subject to government program and operation oversight, but they are still independent enough to resist the types of rapid program shifts that government politicians, policy makers and bureaucrats are fond of as they pursue assorted agendas and flavours of the month.  Their faculty associations have also negotiated agreements that include exigency clauses that make it difficult and expensive if not impossible to implement short-term, long-term or permanent layoffs.  How to get around exigency clauses and get rid of tenured faculty? Why file for insolvency under the Companies’ Creditors Arrangement Act (CCAA) which essentially allows the university to financially restructure and get around the exigency clauses.


Financial pressure is needed to create a situation whereby a university may eventually feel it needs to file for insolvency.  Ontario universities have been subject to essentially declining or frozen grant funding for a number of years now.  They have compensated by raising the revenue portion from tuition on domestic students, but the Ontario government decided to cut tuition fees by ten percent and then frozen them. Indeed, it has now extended the freeze for a second year because it says it “wants to protect students’ and families’ pocketbooks during the COVID-19 pandemic.”  


Now, Ontario and Canadian demographics are such that the pool of domestic university aged students has not been growing substantially and the result is the pursuit of international students who not only are coming in large numbers but can be charged higher tuition than domestic students.   However, on the same day that Ontario announced that it was extending the Ontario domestic student freeze another year (out of province students are exempt from the freeze) it was also revealed that the federal government was facing demands by Ontario to suspend the entry into Ontario of international students.  Needless to say, given the importance of international students and their tuition to the finances of many Ontario universities, the results for university finances this fall would be catastrophic.


So, what are we to make of all this?  Is this all an unfortunate coincidence of a number of independent measures and decisions randomly coming together to create a financial storm for the university sector? Is it simply the result of a government that does not understand how to consult and as a result makes damaging policy decisions that border on incompetence?  Or has the government decided to take the case of Laurentian as an opportunity to see if it can create the nudge for massive changes in a university sector that to date has been able to resist change? 


Of course, the pursuit of such a strategy requires a sophisticated and calculating behind the scenes over-mind and the Ontario government to date has not exhibited such a tendency.  It probably is a combination of coincidence and poor policy making.  On the other hand, it could be as simple as the Ontario government realizing that most people do not care too much about universities making them an easy target for financial cuts to what remains of government university funding down the road. Smaller universities in the end require less grant funding. 


Reliance on housing investment creates prosperity mirage in Ontario


While Ontario continues to grapple with COVID, there’s light at the end of the tunnel. At some point, government decision-making will move away from pandemic management and towards economic recovery and the need to get Ontario’s economy firing on all cylinders.

In 2020, Ontario’s nominal GDP dropped by nearly 5 per cent. Ontario’s spring 2021 budget forecasts a rebound in 2021 of slightly more than 6 per cent followed by another 6 per cent in 2022. However, it’s premature to conclude that happy days are here again given the long-term economic and productivity issues in Ontario.

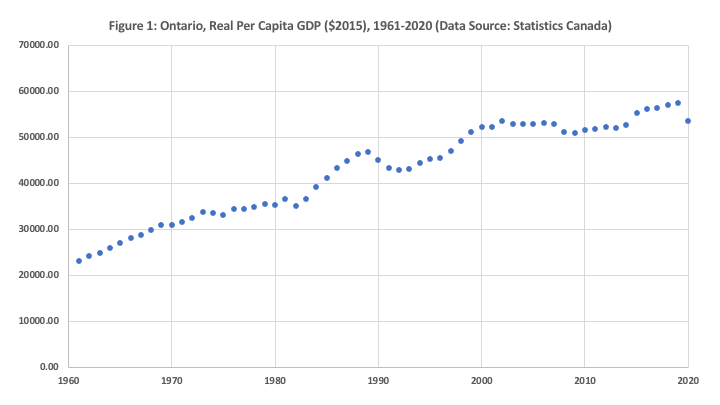
The first chart below presents Ontario’s real per capita GDP (in 2015 dollars) starting in 1961 to provide a long-term perspective.

Figure 1

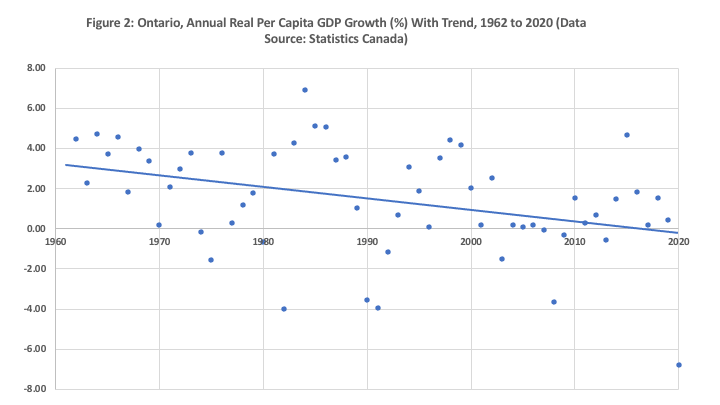
The second chart presents the annual growth rate of real per capita GDP with a linear trend. The picture is actually rather grim as it shows a long-term decline in real per capita GDP growth. Between 1961 and 1991, Ontario’s real per capita GDP rose from $23,218 to $43,357—an increase of 87 per cent. However, over the next 30 years, real per capita GDP only grew an additional $10,094 dollars—an increase of only 23 per cent.

Figure 2

Whereas the 1990s saw a rebound after the dip of the 1990-91 recession, growth essentially flattened for the 15-year period from about 2000 to 2015. A recovery seems to have begun in growth in 2015 but then 2020 alone saw real per capita GDP take a 7 per cent hit.

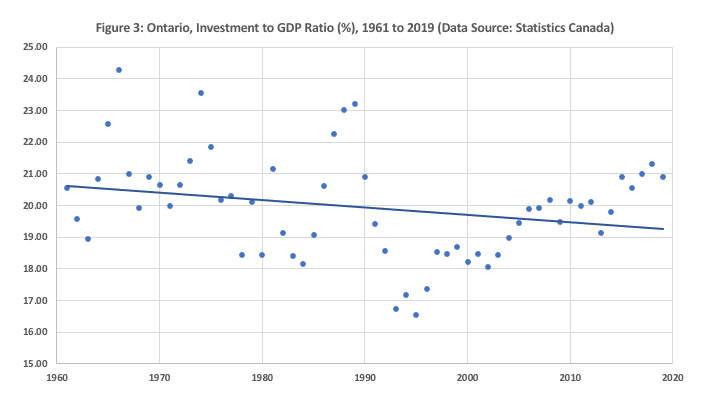
A lot has happened in Ontario over the last 30 years that factor into the reasons for the long-term growth and productivity decline (which is not unique to Ontario). Indeed, trying to get real GDP growth above 2 per cent is a problem not only for Ontario but also Canada and many advanced economies. However, the key issue for Ontario can be summarized by in the third chart below, which shows a long-term decline in the investment-to-GDP ratio in the province over time. Ontario has reduced the share of output devoted to new investment.

Figure 3

Productivity growth requires new investment in productive capital—plant, machinery and equipment—and the period from 1960 to 2000 saw it decline from highs near 25 per cent of GDP to well below 20 per cent. True, a recovery of sorts seems to have started since 2000 but much of that is housing investment. As much as people feel wealthy from their investment in new housing and the appreciation of its value given the incessant bidding up of real estate prices, that’s not the foundation for true productivity growth.

Indeed, like much of Canada, Ontario’s economy right now is being propped up by government spending and real estate spending. This is a prosperity illusion.

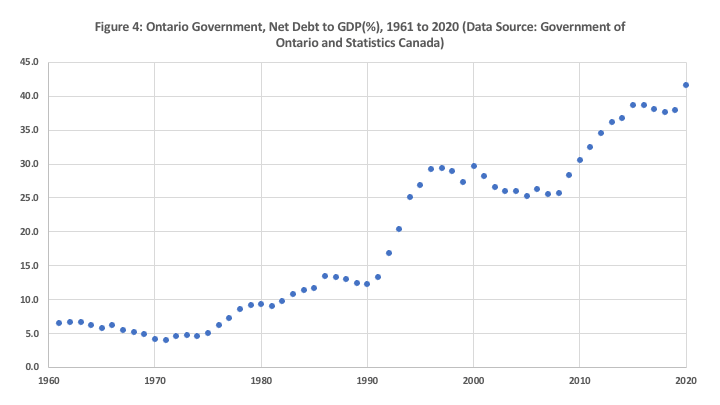
Figure 4

Declining long-term economic growth in Ontario has resulted in weaker growth in its tax base and government revenues, and yet Ontarians still want their government to provide health care, education and investment in new infrastructure in those sectors. Ontario governments have dealt with these demands to provide the public goods Ontarians want by essentially spending more than they take in. The result is structural deficits and mounting provincial government debt, as the chart below shows. The provincial net debt-to-GDP ratio has gone from about 5 per cent in the 1960s to about 40 per cent, followed by the pandemic bump above 40 per cent in 2020.

Yet, despite this run up in debt, Ontario’s government now spends (on a per-capita basis) some of the lowest amounts on health care and education in Canada.

Low economic growth rates, rising provincial government debt and an economy increasingly marked by a public fixated on real estate appreciation as a source of wealth-creation rather than productivity growth remains a recipe for a diminished future. The rebound in growth rates forecast for this year and next are being driven by a flood of cheap money that has generated widespread public and private borrowing and spending on housing to create an illusion of prosperity.

To have an economic future that’s sustainable and not a mirage, Ontario must boost its productive investment.

This originally appeared on the Fraser Institute Blog,  May 3rd, 2021.

Monday 3 May 2021

COVID-19 Case Trends: Ontario and Thunder Bay Seem to Be Stalling

 It is the start of the month and a good time to review how Ontario and Thunder Bay District are faring in terms of the trend in daily COVID-19 case counts.  Ontario has now been in a lock down for about four weeks with Thunder Bay District in a lock for weeks before then.  The current restrictions are set to last until May 20th but it is likely they will be extended given that while the upward surge has been arrested in Ontario, there is not yet a downward trend.  As of today, Ontario is reporting a total of 473,901 COVID-19 cases and 8,118 deaths.  Daily cases climbed above 3,000 about April 2nd and peaked at 4,812 on April 16th but they have stubbornly remained above 3,000 since.  Figure 1 plots Ontario's daily cases with a LOWESS smooth and the best that can be said is that the cases have stalled with a distinct downward trend yet to emerge. 


As for the Thunder Bay District, Figure 2 shows that since the peak that was reached circa the first week of March (about Day 408), there has been a dramatic decline but we have not gone down to zero.  Rather, we seem to be leveling off at about 5 to 10 cases daily. Indeed, the average cases reported over the last two weeks is about 7.  While this is a rather manageable problem for the time being compared to what things were like in early March, it remains that these embers are capable of still sparking a much larger conflagration. Indeed, given the much higher case numbers to the west of us in the Northwestern Health Unit as well as the prairies, the potential for the more rapid spread of new variants is still there.


One suspects a distinct downward trend for the province is still several weeks away and will only occur as the vaccination process gets to larger numbers of people.  Complete eradication will likely not occur given the spread of new variants, the general non-compliance with general restriction measures by a surprisingly large share of the population and of course the refusal or reluctance of some to get vaccinated. In the United States, the widely circulating variants and vaccine hesitancy has led experts to conclude that herd immunity there is unlikely and that the virus will continue to circulate for some time to come.  It is likely not going to be any different in Canada.  The new normal will include precautions and some level of restrictions for some time to come - likely a few years.