Sunday 24 February 2019

And Here it Is! The New Air Canada Thunder Bay-Toronto Schedule

Well, you can now book starting May 1st on the new schedule Air Canada has for the Thunder Bay-Toronto run.  As noted in my last post, much was made of the move to larger A319 jets that would shave off 20 minutes off  a flight from the current turboprops but the more frequent schedule of six flights daily has now been replaced by three flights a day.  One thing remains the same however, the earliest flight out of Thunder Bay to Toronto is still at 5 am.

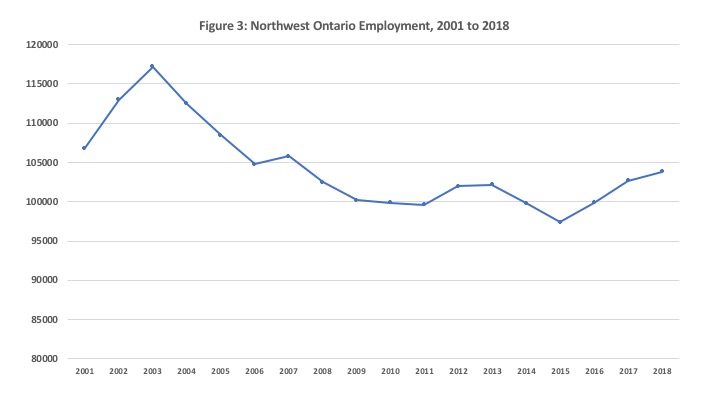
Going from Thunder Bay to Toronto, Air Canada now has three flights a day and every day:  5am, 11am and 5:15pm. 


 Coming back, its 8:20am, 2:30pm and 9:10 pm.


So there you have it, the new Air Canada out of Thunder Bay.  It will be interesting to see how it does compared to the competition from Porter and Westjet.  Going to Toronto on a weekday, Porter in early May currently has seven flights from Thunder Bay to Toronto Island (as opposed to Pearson for Air Canada): 6:45am, 9:00am, 11:10am, 12:40am, 2:10pm, 4:05pm and 7:15pm.  As for the return, another seven flights at 8:30am, 9:55am, 11:25am, 1:25 am, 4:35 am, 6:45pm and 8:20pm.  As for Westjet (which goes to Pearson also), from Thunder Bay to Toronto it is 6:10am, 11:50am and 5:50pm while the returns are departing at  9am, 3:10pm and 9:50pm.

Air Canada has cut capacity starting in May by 13 percent going from 468 to 408 seats.  Porter at seven flights a day with a Turboprop (assuming 78 seat capacity) will have 546 seats available while Westjet with three 78 seat Turboprop flights will have 234 seats.  So the smallest local player here is Westjet and given that they appear to be having some issues that have caused it to lag Air Canada nationally, one wonders if they will be the airline hit hardest by these changes in the Thunder Bay market and as a result be the most likely to exit.  Or will they counter with their own jet service and business class to compete directly with Air Canada on the Thunder Bay run?

Stay tuned.

Friday 15 February 2019

From Air Canada to Thunder Bay with Love...Well Maybe Not


Air Canada chose Valentine’s Day to announce a number of route changes that consist of removing older, slower, more frequent and smaller regional propeller planes (the Q400s) currently operating under Jazz and substituting newer, faster (by about 20 minutes in Thunder Bay's case) less frequent but larger jet aircraft (A319s) operating under the Rouge banner.  In the case of Thunder Bay, this means that the current six flights a day to Toronto (with 78 seat capacity for each flight) will be replaced with three flights a day (with 136 seat capacity each).  If you do the math, daily capacity on the Thunder Bay-Toronto run for Air Canada will actually fall from 468 to 408 – a drop of about 13 percent. That means you can expect a price increase at some point in the future even though the newer planes and crews Rouge uses are likely lower cost per passenger mile.

I guess I am now old enough to remember the preamble to the era of airline deregulation when Norman Bonsor, my Transportation Economics professor, would intone that deregulation was a plus for small regional markets like Thunder Bay because more expensive jet service would be replaced by more frequent and cheaper albeit slightly slower turbo-props – which is indeed what came to pass in Thunder Bay.  Air Canada’s announcement is a bit like back to the future but the new jets today are much more fuel efficient and cost effective than they were in the 1970s and 1980s.

Still, I am looking forward to seeing how this transition proceeds and the passenger response.  Going from six flights a day to three will reduce passenger travel flexibility and one expects that Air Canada will schedule its three daily flights to Pearson similar to what Westjet is doing (which incidentally also in the last while went to three from four flights daily but still uses Q400s).  For May, Westjet is showing departure times to Pearson from Thunder Bay of 6:10am, 11:50am and 17:50 pm and returns to Thunder Bay from Toronto departing at 9am, 15:10 and 21:50.  One suspects that given Air Canada is more directly competing for passengers to Pearson with Westjet, it will have its flights in slots pretty close to Westjet.

Air Canada’s move pretty much consolidates the alternatives from Thunder Bay into two – going to Pearson at nearly the same times at three times a day or going to the Island Airport.  Of course, Porter is still maintaining its Q400 6-7 flights a day service to Toronto Island which means it may pick up even more business travel from Air Canada.  It is unfortunate that Porter was not able to bring regional jet service to the Toronto Island airport because 5-6 flights a day from Thunder Bay on smaller yet faster regional jets such as a CRJ550 or CRJ700 (50 and 78 passenger max respectively) would definitely have smoked the competition out of Pearson.  Still, I suspect that Porter will see a pickup in its bookings given its greater flexibility as well as its downtown location for business travellers. It will however probably need to reinvest in its aircraft stock as its fleet begins to age.

The other claim that was made was that the Rouge airplanes were roomier and more comfortable.  Perhaps I am missing something here but having flown on some of the newer jets and flown Rouge overseas, I found the seating in the Q400 was actually a bit roomier compared to my last Rouge flight.  But it will be roomier in business class (the 136 seat version of the A319 has a business class) and that may also be part of Air Canada’s strategy to hold onto business travellers who are much more lucrative to airlines than the rest of us.

 
So, the changes have pros and cons and it will be interesting to see how everything comes out in the wash.  The increased competition may eventually spark some real consolidation on the Thunder Bay route - after all, if Air Canada adopts Westjet time slots with larger and faster planes to Pearson, one might see an exit by Westjet and going down to only two airlines out of Thunder Bay.  That really would be going back to the future. Or Westjet may respond by bringing in jets which will spark a pretty competitive period until the inevitable departure by one or more players brings back monopoly and higher prices. Interesting times are ahead.

For those of you who have travel with Air Canada booked in May from Thunder Bay to Toronto, you can look forward to a message soon rescheduling your flight. Have a wonderful long weekend.

Tuesday 12 February 2019

The Incredible Shrinking Newspaper and the Decline of the Forest Sector


Going through some old stuff, I came across a full newspaper from 1981 – a copy of the Tuesday June 30th edition of the Thunder Bay Chronicle-Journal.  Examining it, one is struck by how hefty the paper was in terms of both paper volume as well as article content compared to what is currently being published.  Indeed, I put this old copy of the Chronicle-Journal on my dining room table alongside the Monday February 11th, 2019 edition for a comparison (see the photo) and the differences are quite striking.


Newspapers have indeed shrunk.  The 1981 version of the Chronicle-Journal was 15 5/8 inches (39.7 cm) wide and 22 5/8 inches (57.5 cm) long while the 2019 version is 11 ½ inches (29.2 cm) wide and 22 5/8 inches (57.5 cm) long.  More important is the thickness.  The 1981 newspaper consists of two section – each 32 pages long while the 2019 version is in two sections – each 10 pages long.  The long and short of it is that the amount of newsprint required has shrunk by over two-thirds.  Even more interesting is the fact that until the mid 1990s, Thunder Bay actually had two papers published – a morning edition which was the Chronicle-Journal and an evening edition known as the Times-News.

When what looks at what has happened to the Canadian forest sector over the last fifteen years, one only needs to take what has happened at our own local paper and extrapolate it across North America.  Newspapers have been either shrinking in size or simply going out of print completely.  There was certainly a lot more advertising in the pages of the 1981 version of the Chronicle-Journal and competition from electronic media and the internet have been important factors in the decline in the demand for newspapers.

Along with changing consumer preferences when it comes to news sources, there have been other shocks to the pulp and paper industry.  The recession of 2008-09, international newsprint and pulp competition from lower cost suppliers, a high Canadian dollar, aging capital stock and high electricity prices were all factors which helped decimate the Northwestern Ontario pulp and paper industry in the first decade of the 21st century.  Across Canada, employment in logging, pulp and paper and wood dropped by over 40 percent between 2004 and 2014 while the number of paper mills fell from 50 to 30 – also a 40 percent decline.

It is really quite remarkable that newspapers have been able to survive at all given the size of the demand and technology shocks hitting them over the last thirty years.  I must admit, that while I have adjusted to the era of e-papers, I do occasionally miss having a more hefty newspaper in hand.

Thursday 7 February 2019

Regional Employment Update: Ontario Regions and the North


Ontario’s economy has increasingly become a tale of two regions – the GTA and everyone else.  It is worth doing a quick review and update of regional employment numbers (data from Statistics Canada) that provide some additional insight on the past and the most recent distribution of regional employment.  In 2001, employment in Ontario was 5.921 million jobs and over the period 2001 to 2018 it rose by 22 percent to reach 7.242 million jobs.  Figure 1 plots the growth rate of Ontario employment as well as for the five major regions from 2001 to 2018 as well as for the sub-periods of 2001 to 2010 and 2010 to 2018. 

 
In terms of overall growth rates, employment expanded the most in the GTA, which saw an increase between 2001 and 2018 of nearly 32 percent.  Indeed, the GTA’s share of Ontario employment during this period went from 45 percent to 48 percent.  The next largest increase was for the area immediately adjacent to the GTA – central Ontario - comprising of Muskoka and the Kawarthas, Kitchener-Waterloo-Barrie and Hamilton Niagara.  It saw growth of nearly 23 percent in employment and its share of Ontario’s employment remained constant at about 23 percent of the total between 2001 and 2018.

The next highest growth rates were for Eastern Ontario and the Southwest respectively at 17 and 5 percent each.  However, this employment growth was not enough for both of these regions to hold their own in terms of employment shares.  While Eastern Ontario maintained its 13 percent share of total employment between 2001 and 2018, the Southwest saw a decline from 13 to 11 percent.   


And then there is the north which saw employment drop by 1 percent between 2001 and 2018 from 358,000 to 354,000 and its employment share of the provincial total drop from 6 percent to 5 percent.  Of course, this trend is nothing new, but such an update is another reminder that despite a plethora of studies and government pronouncements over time - including the Northern Ontario Growth plan -  there has not been a reversal of northern Ontario’s economic fortunes.  Figures 2 and 3 break employment over time in the Northeast and the Northwest.  The Northeast reached its peak employment circa 2008 and has since generally trended down.  The Northwest peaked in 2003 and has trended down since though there has been a slight rebound since 2015.

And there you have it - again.

Friday 1 February 2019

Thunder Bay City Budget 2019: It's Not Over Yet


Thunder Bay City Council has made the effort to address the rising level of taxes and expenditures in its most recent budget deliberations on Wednesday evening this week which apparently lasted eight hours.  The Administration was directed to find options for about $3 million in savings and they responded with a tiered list of three categories ranging from the least to the most intrusive that totaled $4.8 million.  The reductions approved by Council from the first list alone amounted to almost $1.7 million and among the items that were eliminated (as listed in a CBC report) were:

  • $150,000 for consultation and study for increased monitoring of area waterways and other open spaces
  • $16,500 that will reduce family swim hours at Churchill Pool and hours of operation for the thunder slide at the Canada Games Complex
  • $330,000 for the purchase of a new pumper truck for Thunder Bay Fire Rescue
  • $20,700 for the city to hang Christmas lights in the downtown south core and Westfort and for the installation of hanging baskets in the two cores
  • $45,000 in reductions to city budgets for WSIB and overtime.

As well, several vacant city positions were eliminated.  However, some of the reductions in other services in the other more “intrusive” categories such as the elimination of weekend residential street snow or sidewalk plowing were not accepted.

When all was said and done, the increase in the total tax levy was brought down from initial 3.3 percent (that had actually jumped to 3.69 percent) – to 2.29 – that is from $195.9 million to $194.1 million – about $1.8 million dollars.  That does not seem like a lot because there was also the addition of about $1 million in new spending for police services (the jump to 3.69 percent) as a result of the need to deal with the recommendations of the Ontario Independent Police Review Director on the relations between the police and Indigenous people.  The budget still has to be ratified and that vote is scheduled for February 11th. 

So, while an effort was made to restrain spending, when you look at the updated figures (See Figures 1 & 2)  that include the original proposed increases and the new revised January 30th figures, there is still work to be done.  The new revised budget figures still entail an increase in the total tax levy though the rate of increase is now much closer to the inflation rate and lower than the average increase of 3.9 percent over the period 2000 to 2018.


It remains that despite what seem like numerous reductions to many items, there is still more tax revenue needed.  The City Budget is in some ways analogous to our hydro and water bills where even after people reduce their usage considerably, the total bill still goes up because of “fixed costs.”  Indeed, what has been done in the most recent budget meeting can best be termed as dealing with the “low hanging fruit.”  A more substantive effort requires a comprehensive expenditure and service review that needs to consider more substantial long-term changes. 

Among these, there does need to be a review of services like snow removal or garbage collection or transit that examines how they can be done with less money while preserving a core service requirement.  There needs to be a review of overall city staffing that can start with a hiring freeze and reduction of the total complement via attrition with restructuring of management of services and service delivery so that fewer people – including managers - are required.   

As retirements occur, management departments could be amalgamated.  A glance at the City organizational chart shows numerous divisions within each category and one wonders for example why under Corporate Services and Long-Term Care there are separate divisions for Financial Service, Revenue and Internal Audit given that they are all finance related.   Why is the Waterfront Coordinator not under Tourism Thunder Bay? Why is there a Central Support division in Community Services and another in Infrastructure and Operations? There is both a Corporate Strategic Services block as well as a Corporate Projects division in Community Services. There may well be good reasons for some of these organizational patterns but they do need to be reviewed and examined for efficiencies.

In terms of services, weekly winter garbage collection – say from November to 1st to March 30th could probably be changed to every two weeks with a three can limit every collection period.  This would reduce the core staff required with the uptake in summer filled by summer seasonal student workers when weekly two can limit service resumes.  Snow removal on weekends in residential neighborhoods could be moved from the current 5cm threshold to 10 cm which could help reduce overtime costs. 

In short, Council has made a start but there is still more to be done after this year’s budget is passed.