Northern Economist 2.0

Wednesday 24 August 2022

Employment Density in Canadian CMAs

 Labor markets are at the forefront in terms of current policy issues given the shortages that are plaguing so many sectors in Canada's economy.  During the pandemic year, employment in Canada took a major hit but had largely recovered by the end of 2021.  When we look at employment and jobs in Canada using data from Statistics Canada, our usual approach to where the jobs are is something akin to what we see in Figure 1 below.  Canada has 35 major Census Metropolitan Areas (CMAs) each of which is a regional labor market on its own with employment opportunities that need to be filled and employment that is created. Canada's largest nodes of employment are Toronto, Montreal and Vancouver with average monthly employment in 2021 at 3.4, 2.4 and 1.5 million jobs respectively. The numbers fall quite dramatically after that and by 11th place London you below 300,000 jobs.  Twelve cities have fewer than 100,000 people employed ranging from Guelph at an average of 91,000 to Belleville which is just below 50,000.  Incidentally, Thunder Bay has the second smallest total number of jobs of these 35 Canadian CMAs.


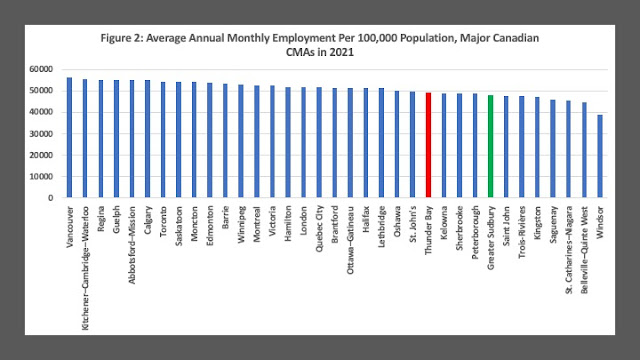
Of course, larger population centers generally are going to have more total employment.  Another way to look at employment is in terms of employment intensity or density.  In per capita terms, do some cities simply have more employment depth or density adjusted for population meaning ultimately more jobs and opportunity?  This is done in Figure 2 where the same cities are now ranked in terms of employment per 100,000 population.  The falloff from the top to bottom performers is no longer as dramatic when the comparison is done this way.  Vancouver is now the most employment dense CMA with 56,507 people employment per 100,000 population while Windsor is the least employment dense at 39,122.  Thunder Bay moves up significantly from the previous ranking now placing 24th out of 35.  Meanwhile, Toronto is not as employment dense as Regina or Guelph but tops Saskatoon and Moncton. 

A historical point: Thunder Bay's CMA population has not changed much in 40 years but its total employment prior to the forest sector crisis of the early 2000s used to fluctuate between 65,000 and 70,000 jobs whereas now it fluctuates around 60,000.  That means that several decades ago, Thunder Bay was more employment dense than the present. Naturally, a historical examination of employment density is in order for many Canadian CMAs but one suspects it would provide answers that many would rather not hear.


Still, if you are looking for employment nationally, it is not just the total size of the labour market in terms of jobs that you should be looking at but also the density of employment.  On the one hand, places with low employment density may be facing more of a labour shortage and therefore be a source of opportunity.  More likely, places with higher employment to population ratios are simply more dynamic economically and have more opportunities to offer.  Places with low employment to population ratios may simply be more economically depressed that those with higher ones. 

Thursday 15 July 2021

Income Growth in Canada: The Regional Results May or May Not Surprise You

Statistics Canada has just released its data on the income of families and individuals in sub-provincial areas for 2019.  There are two aspects to any comparison of census metropolitan areas in Canada - the level of income and the growth in that income.  The first figure below plots median after tax income of census families and persons not in census families by CMA for 2019 and the results show that higher incomes are a feature of western cities and also smaller centres.  Calgary and Edmonton are in first place followed by the Ontario part of Ottawa-Gatineau but Saskatoon, Guelph, and Regina are also up there with median incomes above $60,000.  Thunder Bay and Sudbury fare quite well also and are at the top of of the list at $57,510 and $54,780 respectively.  Canada's major metropolitan centres - Vancouver, Toronto and Montreal - do not fare as well coming in the bottom third of this list.  The five lowest median incomes are mainly in Quebec with the addition of St. Catharines-Niagara in Ontario.  In many respects this is not that big of a surprise.  Smaller cities especially in resource based regions tend to have higher incomes. The big cities have a lot of very high income people but also a lot of low incomes bringing down the average.


What is more interesting is where the growth has been over the last five years.  The next figure presents the percentage growth in median after-tax income of census families and persons not in census families by CMA between 2014 and 2019.  Vancouver and Montreal saw the largest growth at 6.8 and 6.4 percent respectively.  Indeed, cities in Quebec and BC dominate the top rungs in terms of median income growth with an Ontario city - Toronto - coming in 9th place.  Sudbury comes in the middle of the pack at 1.4 percent and Thunder Bay is in the bottom third with its median income growing barely one percent over the course of five years.  Cities in the west - hard hit by the resource sector downturn - see negative income growth along with St. John's in Newfoundland and Labrador which is at the bottom at -4.9 percent.  However, the high tech Kitchener-Cambridge-Waterloo area also saw negative income growth during this five year period. 


British Columbia and Quebec have seen the best growth over the last five years with cities in western Canada experiencing the worst growth and everyone else somewhere in between.  The broader GTA from Oshawa to Niagara Falls and is not doing as well as Quebec or British Columbia and of course these numbers are all from before the pandemic.

Tuesday 27 October 2020

The Importance of Manufacturing in the Age of COVID-19


Ontario’s economy has been hit hard by the Covid-19 pandemic.  Seasonally adjusted monthly employment in Ontario between February 2020 and September 2020 fell 6.3 percent - from 7,551,900 jobs to 7,077,600 jobs.  However, as illustrated in my last post, the employment drop varied across its CMAs.  The worst hit CMAs are Kitchener-Waterloo-Cambridge and Thunder Bay - which saw declines of 11.2 and 9.2 percent respectively while at the other end are Guelph and Brantford, which despite early losses have now recovered and in the case of Guelph even seen a small increase.  The question of course is what might account for this variable performance?

One’s first thought is that it is the result of the impact of Covid-19 with cities harder hit by the virus getting a bigger employment wallop.  However, a plot of the percent change in employment levels across Ontario’s 15 largest CMAs from February 2020 to September 2020 (Figure 1) against Covid-19 cases per million population as of mid-October show only a slight relationship between more negative employment growth and higher case counts.  


 Can the effect of Covid-19 on employment depend on a community’s employment structure?  For example, are communities more dependent on occupations in health, social services, education and public administration  (HSEP)– which are mainly broader public sector jobs – more insulated from employment effects of Covid-19?  Figure 2 illustrates this relationship for Ontario’s 15 largest CMAs and again there really is not much of a relationship.  Indeed, outside of Ottawa, Kingston and Thunder Bay have the largest HSEP shares in Ontario at 42 and 37 percent respectively and they are not exactly coasting. And, if one looks at the share of employment in food and accommodation services (not shown) it is also a pretty flat curve.  Indeed, the employment drop across CMAs seems to be impervious to being more service intensive as well as the specific effects of Covid-19. 


However, there is one more figure that is worth considering. Figure 3 plots the percent of employment in manufacturing against the percentage change in employment. What is interesting here is that the relationship is a positively sloping one – that is, on average, larger employment shares in manufacturing seem to be associated with a smaller employment drop over the February to September period.  It is of course by no means an ironclad relationship.  Kitchener-Cambridge-Waterloo, for example has a manufacturing employment share of 17 percent but nevertheless experienced the largest employment drop of the 15 CMAs at 11 percent. 


However, the four CMAs with the largest manufacturing employment share are Windsor (23%), Brantford (19%), Guelph (19%) and Kitchener-Cambridge-Waterloo (17%).  They average 19.4 percent in manufacturing as a share of employment and their average employment drop was 4.5 percent.  Meanwhile, the four cities with the lowest manufacturing employment share are Thunder Bay (6%), Kingston (5%), Sudbury (3%), and Ottawa (2%). They averaged a manufacturing employment share at approximately 4 percent, but an average drop in employment of 7 percent.  What is it about manufacturing that may insulate your economy more from Covid-19 related employment drops over the longer term?


Good question. Obviously, it is easier to shut down things are deemed non-essential such as personal services and perhaps even some broader public sector service activities.  Moreover, some of these sectors are relatively low-paying and the fairly generous CERB payments probably more attractive than returning to work.  These are very labour-intensive activities and when hit hard can generate a lot of employment losses.  On the other hand, manufacturing – especially advanced manufacturing – is already quite capital intensive so it is relatively more difficult to shed employment.  Moreover, once the economy reopened – it was things that were needed be they masks or toilet paper or metal products – and production resumed as quickly as possible. And, manufacturing is much higher paying making staying on the CERB less attractive.


The relative robustness of employment in the Covid-19 era as a result of manufacturing intensiveness may have global implications for economic recovery.  Economies around the world have been hit hard with large drops in GDP and employment. However, many countries over the last few decades have seen an evolution of their economies away from goods production and towards services.  The G-7 countries certainly are in this category.  This means countries that are currently more manufacturing intensive will likely do much better in the short to medium term especially if they are producing goods in high demand.


This also explains China’s seemingly robust economic recovery.  Given that so much of the world’s manufacturing has relocated to China over the last two decades, they are poised to dominate economic recovery over the next couple of years.  China’s success however may be fragile. First, their longer-term export success requires that other economies recover.  Being a mercantilist means you want to expand your national economy and power by exporting high value-added products and importing low value-added items.  However, having your export markets devastated by Covid-19 is going to be bad for business. Second, most other countries are about to embark on a manufacturing repatriation program as they realize that having a mercantilist and authoritarian country with a monopoly on goods production does place your supply chain at risk and ultimately your national economic welfare.


Saturday 24 October 2020

Ranking Employment Change in Ontario CMAs During COVID

 The economic impact of Covid-19 has affected output and employment in economies around the world and of course, Ontario is no exception.  However, just as the economic impact varies across countries around the world, so does it vary within countries and within regions.  Seasonally adjusted monthly employment in Ontario between February 2020 and September 2020 has fallen from 7,551,900 jobs to 7,077,600 jobs - a percentage drop in employment of 6.3 percent.  The drop was steepest from February to June - which saw a drop of 13 percent but the rebound since has recovered some but not all of the jobs lost.  

The accompanying figure plots the percentage change in employment level for the province along with its major CMAs during this eight month period of the pandemic for which Statistics Canada has released the seasonally adjusted monthly employment numbers.  The results are interesting. The worst hit CMAs are Kitchener-Waterloo-Cambridge and Thunder Bay - which saw declines of 11.2 and 9.2 percent respectively.  At the other extreme are Guelph and Brantford, which have now recovered all of their lost employment and in the case of Guelph seen a small increase.  

There is no apparent pattern to the impact of employment losses based on the impact of  COVID.  Thunder Bay had a very mild impact from Covid-19 in terms of cases and mortality (to date Thunder Bay District is at a total of 114 cases and one death - one of the lowest rates in the province given a population of about 140,000) and yet it had the second highest percentage employment losses.  Toronto and Ottawahave had higher rates incidence and mortality compared to Hamilton and yet are in the middle of the pack in terms of employment losses while Hamilton has done worse than they have  The employment losses really make little sense in terms of the impact of the virus.

 There also seems to be no obvious patterns in terms of location.The hardest hit in terms of employment losses are in northern Ontario, the Golden Horseshoe, central Ontario and eastern Ontario. The smallest hits are in central Ontario, eastern Ontario and southwestern Ontario.  Good and bad performance is spread everywhere which brings us to perhaps factors such as local response to the pandemic by employers and health authorities as well as composition of the local economy.  

Were some communities quicker to implement lock downs and shutdowns and with more stringent rules and slower return to work? The case of the two northern Ontario CMAs may be a case in point given the share share of public sector employment in those cities and yet their poorer employment performance. 

The Kitchener-Waterloo area is exceptionally dependent on students and the businesses servicing those students so maybe that is a factor.  A detailed look at the restaurant, accommodation, hospitality, recreation and cultural/entertainment shares of local employment may also yield insight into why some CMAs did so poorly relative to others given these sectors were exceptionally hard hit.  Of course, as we move into winter one grows concerned that additional impacts on these sectors may have permanent long-term effects.

Until we drill down into more detailed data, the differential impact is a bit of a puzzle.


Monday 29 June 2020

Pandemic's Economic Impact: Building Permits

Statistics Canada released the May building permit numbers today and they document the impact of COVID-19 on residential, business, industrial and institutional capital investment quite nicely.   The good news is that the total value of building permits issued by Canadian municipalities in May grew  20.2% to $7.4 billion.  This was a nice rebound following declines of 13.4% in March and 15.4% in April. Indeed, on a monthly basis, this was the largest percentage increase since March 2009, and according to the report it coincided with the relaxing of COVID-19 construction restrictions in Ontario, Quebec and Prince Edward Island. However, the May level is still 20.4% below the last peak observed in January 2020 and when the year-over-year statistics are looked at, we are down 10 percent.


The year-over-year percentage changes are important to look at in that they provide a better long-term comparison and they reveal that some Canadian CMAs are actually rebounding nicely.  Brantford and Barrie on a year-over-year basis saw increases of over 200 percent.  Peterborough and Thunder Bay were next with annualized increases of 51 and 44 percent respectively.  Indeed, 13 of Canada's 34 CMAs saw increases year-over-year including even Toronto at 11 percent and Windsor at 10 percent.  Both cities were exceptionally hard hit by COVid-19.  The worst hit cities in terms of annualized declines in building permit values were Kingston, Moncton, Gatineau (Part of Ottawa-Gatineau)  and Saskatoon.

For some of the smaller cities, the rebound is a bit of a small number's game. Thunder Bay, for example reported 9.5 million dollars in permits in May of 2019 and 13.7 million in May 2020.  I did notice a new mini-mall having land cleared in the River Terrace area so if that was issued in May, it would have helped the numbers.  A new mini-mall would obviously not have the same impact on numbers in the GTA. As for Peterborough, over the same period, the numbers go from 12.2 million dollars to 18.5 million.  Winnipeg, on the other hand went from 254 million dollars to 151.7 - in terms of scale, a much more impactful drop. As for Toronto, it goes from 1.6 to 1.8 billion dollars and Hamilton from 187 billion  to 255 billion dollars.

Interesting stuff.

Friday 8 May 2020

COVID-19 and Employment Effects Across Canadian CMAs (Check out Barrie!)

The April 2020 labour force numbers are out from Statistics Canada and the numbers are indeed grim.   Employment dropped by one million in March, and fell by nearly two million in April, bringing the total employment decline since the beginning of the COVID-19 economic shutdown to over three million.  In addition, the number of people who were employed but worked less than half of their usual hours for reasons related to COVID-19 increased by 2.5 million from February to April.

Statistics Canada noted - and this was picked by by the media - that the size  of the decline in employment since February (-15.7%) far exceeds declines observed in the 1981-1982 recession which resulted in a total employment decline of 612,000 (-5.4%) over approximately 17 months.  However, the national unemployment rate in April 2020 is what the unemployment was like at the peak of the 1981-82 recession - at 13 percent.  Employment and the labour force have grown substantially over the last 40 years making such comparisons of absolute numbers problematic.  Nevertheless, the increase in unemployment rates and the percentage declines in employment are dramatic given that declines in previous recession were spread out over months while this one has happened in 30 days.

A comparison across CMAs is quite interesting.  All of Canada's 35 CMAs saw an increase in their unemployment rates (3 month moving average) with the highest unemployment rates currently in Saguenay(13.1 percent), Windsor and Calgary.  The lowest are in Victoria, Ottawa, and Abbostford-Mission (6.2 percent).  Thunder Bay clocks in the middle of all this at  9.2 percent with Sudbury much lower at 8.9 percent.


As for employment declines in percentage terms, everyone saw their total employment decline relative to April 2019 - except for Barrie of all places.  Even with the March to April drop of 6400 jobs,  Barrie has been growing so robustly that its April 2020 total employment is still 5 percent higher than April 2019.  However, the employment drops are quite steep especially for Peterborough and Windsor which saw their employment drop 17.7 and 15.8 percent respectively.  Relatively unscathed - along with Barrie - are London, the Ontario portion of Ottawa-Gatineau, Trois Rivieres and Moncton. Thunder Bay is again close to the middle in terms of employment declines at -6.3 percent while Sudbury was -8.9 percent.


So, there you have it.  The numbers will probably get worse before they get better.  The numbers for May - which will come out in June - will probably show an increase in the unemployment rate as well as a further decline in employment.  However, the additional declines should be substantially less.  One can start to expect to see improvements in the employment numbers in June which will be reflected in July's release.

Thursday 22 November 2018

Homicide Rates for 2017: Canada (and Sudbury) Up but Thunder Bay Down


Well, with all the excitement about the Federal Fall Economic Statement yesterday, the release by Statistics Canada of the 2017 homicide numbers flew in somewhat under the media radar.  According to Statistics Canada, the homicides in Canada hit its highest rate in almost a decade in 2017 with much of the increase attributed to more firearm-related and gang-related incidents. The firearm-related homicide rate increased 18 percent from 2016 to 0.72 per 100,000 population—the highest rate since 1992. Police reported 660 homicide victims in Canada in 2017, 48 more than in 2016. The homicide rate rose 7 percent in 2017 to 1.80 victims per 100,000 population—the highest level since 2009.  It would appear that the upward increase in homicide rates was driven by British Columbia and Quebec.


What is also of interest is the homicide rate by CMA for 2017 as shown in Figure 1.  In 2017, the homicide rate per 100,000 ranged from a high of 5.8 in Thunder Bay to a low of 0 in Saguenay.  Greater Sudbury came in close to the bottom at 0.61.  The good news for Thunder Bay is that the homicide rate for 2017 is down from 2016 when it stood at 6.62 per 100,000.  The bad news is if one takes the average homicide rates for all CMAs for the period 2006 to 2016 (see Figure 2)  Thunder Bay also ranks the highest at an average of 4.04 per 100,000, just ahead of Winnipeg at an average of 3.69. As for Sudbury, its homicide rate is up from last year - when it stood at zero - but given the rankings there does not seem to be that much to worry about there.

Needless to say, despite an improvement in 2017 Thunder Bay still has work to do.

Monday 9 July 2018

Advanced Industries: A Northern Ontario Economic Challenge


A recently released report jointly released by the Brookings Institute and the Martin Prosperity Institute lays out Canada’s path to future prosperity via advanced industries and the challenges Canada faces in this economic sector.  The report is titled Canada’s Advanced Industries: A Path to Prosperity and is authored by Mark Muro, Joseph Parilla, Gregory M. Spencer, Deiter F. Kogler and David Rigby. These industries are not just in manufacturing but span a number of diverse industries with the commonality being the application of advanced technology and innovation.  Brookings defines advanced industries as: “industries as diverse as auto and aerospace production, oil and gas extraction, and information technology—are the high-value innovation and technology application industries that inordinately drive regional and national prosperity. Such industries matter because they generate disproportionate shares of any nation’s output, exports, and research and development.”

The report argues that Canada’s advanced industries are not realizing their full potential and that these industries need to be targeted to build a dynamic advanced economy for future growth.  About 11 percent of Canada’s employment – about 1.9 million jobs – is currently employed in these higher wage advanced industries and they generate 17 percent of GDP, 61 percent of exports and 78 percent of research and development.  Services account for about half of the Canadian advanced industry worker base followed by manufacturing at about 36 percent.  What is more interesting is the variation in scale, intensity and diversity of this sector across provinces and Canadian CMAs. 

Ontario, Quebec, Alberta and British Columbia together account for 91 percent of advanced industry employment which is just a bit more than their total employment share which is about 87 percent.  Not surprisingly, the CMAs with the most advanced industry jobs are Toronto, Montreal, Calgary and Vancouver.  However, productivity growth in this sector has been lagging relative to the United states. What is particularly disconcerting from the point of view of northern Ontario economic development however is the fact that every Canadian CMA added advanced industry employment between 1996 and 2015 – the exceptions being St. Catharine’s-Niagara, Greater Sudbury and Thunder Bay.  Thunder Bay also ranks low when it comes to the regional value added generated by advanced industries (See figure taken from page 22 of report) whereas Sudbury does better because of the intensity of its mining sector. Moreover, Greater Sudbury and Thunder Bay are also at the bottom of the CMA rankings when the number of advanced industry specializations is compared in terms of local concentrations of activity.


Boosting advanced manufacturing in Canada according to this report requires a strategy of “four C’s” – capital, competition, connectivity and complexity.  Capital is of course the most fundamental – that is, investment in machinery and equipment but also knowledge capital such as information and technology systems.  The weakness in business investment has been a long-known factor in Canada.  As for competitiveness, Canadian industries have traditionally had less exposure to intense competition and this may be limiting the capacity of its advanced industries to innovate.  Fixing this requires greater market competition and indeed deregulation and easing foreign ownership restrictions.  Connectivity involves Canadian firms participating more in global value and production chains and networks.  Finally, complexity requires firms to master the technological complexity and specialization of the modern economy and this is often measured by patent activity which in Canadian CMAs is generally below American ones.  Policies for building connectivity and complexity in the end also involve the unleashing of greater competitive forces within the Canadian economy in order to achieve the market size or scale within which advanced industrial output can grow.

Thus, a major obstacle for Canada when it comes to growing its advanced industrial sector is its highly regional nature which in the end results in barriers to internal trade, less competition and small market sizes that militate against the scale needed to grow output.  In the case of northern Ontario, even with the growth in local entrepreneurship which has been quite noticeable in its larger cities such as Thunder Bay and Sudbury, it remains that without growth in market size, new innovative ideas will be like so much seed fallen in rock if the companies cannot grow their output.  In the end, any regional economic policy must focus on increasing the scale of output by boosting market size either via exports or via immigration and local population growth.

Thursday 15 February 2018

Population Growth Results: Thunder Bay and Sudbury at the Bottom


Statistics Canada has released its recent sub-provincial population estimates for 2016/17 and the results find that population is still growing faster in the Prairies well as parts of Ontario but the two major northern Ontario CMAs are not in the pack.   According the Statistics Canada, the 10 CMAs with the highest population growth in 2016/2017 were in either the Prairies or Ontario. In 2016/2017, the population growth rate was 2.0% or higher in four CMAs: Saskatoon (+2.8%), Regina (+2.4%), Guelph (+2.2%) and Ottawa–Gatineau (Ontario part) (+2.2 and were followed by Toronto (+1.9%), Oshawa, Winnipeg, Edmonton and Calgary (+1.8% each), and Kitchener–Cambridge–Waterloo (+1.7%).  The figure below shows the picture pretty clearly.


At the bottom of the rankings are Sudbury, Thunder Bay and Saguenay.  Sudbury is third from the bottom with a population increase of only 0.1 percent.  The population decreased in the Saguenay (-0.2%) and Thunder Bay (-0.1%) CMAs for the fourth consecutive year with Saguenay’s population decrease partly attributable to out-migration of young adults aged 18 to live elsewhere in Quebec. In Thunder Bay, the number of deaths surpassed the number of births, and has done so since 2006/2007, contributing to its population decline. 


Thursday 19 January 2017

Employment Growth Strongest in Ontario’s Golden Triangle: How the Major CMAs Stack Up


Employment is always an important indicator of economic growth and success and the figure below provides a good perspective on how some of Ontario’s major centers are doing when it comes to job creation.  Employment data from Statistics Canada is used to compare total employment growth between 2001 and 2016 for 15 major CMAs.  These major CMAs are ranked from highest to lowest and their employment growth ranges from a high of 38.8 percent for Oshawa to a low of -2.4 percent for Thunder Bay.